Galley Equipment Market Report Scope & Overview:
The Galley Equipment Market was valued at USD 8.57 billion in 2023 and is expected to grow to USD 12.61 billion by 2032, reflecting a compound annual growth rate (CAGR) of 4.42% over the forecast period from 2024 to 2032.
Onboard kitchen gadgets used for cooking and storing food materials aboard land, sea, and aerial boats are referred to as galley equipment. They include non-electric and electric components such as serving pots, trays, racks, trolleys, and trash compartments, as well as food processing equipment, chillers, and washing machines. One of the primary factors driving market expansion during the forecast period is the rising travel and tourist industry.

To get more information on Galley Equipment Market - Request Free Sample Report
MARKET DYNAMICS
KEY DRIVERS
-
Demand for Lightweight Galley Equipment is Growing
-
Customization of Galleys Based on Customer Preference
RESTRAINTS
-
Shipment delays as a result of new programme
-
Suppliers' Adoption of a Wait-and-See Strategy
OPPORTUNITIES:
-
Increased Customer Experience Demand
-
Shipments are increasing in Asia-Pacific, Latin America, and the Middle East.
CHALLENGES
-
Increasing Efficiency by Reducing Equipment Space and Weight
-
Different Galley Design Preferences
IMPACT OF COVID-19
The epidemic of Covid 19 has harmed the performance of the aviation galley equipment industry. Air traffic has decreased as a result of the implementation of severe social distance and lockdown standards and guidelines. It has hampered market expansion. However, according to the thorough aeroplane galley equipment industry prediction, the market will recover in the future as the number of flyers increases. As a result, the elimination of lockdown guidelines could resurrect the market and help it thrive in the future.
The Galley Equipment Market is classified according to Application, Aircraft Type, Ship Type, Insert Type, and Fit. The global market is divided into four applications: aviation, marine, defence, and commercial. The global market is divided into three categories: single-aisle, twin-aisle, and business general aviation.
Surface Ships, Amphibious Ships, Passenger Vessels, Recreational Boats, and Bulk Carriers are the global market segments. The global market is segmented by Insert Type into Aviation Galleys, Electric Insert, Non-Electric Insert, Ship Galleys, Electric Insert, and Non-Electric Insert. The global market is divided into two segments based on fit: Line Fit and Retro Fit.
A large increase in modern aircraft sales, as well as an increase in fleet deployments around the world, is also contributing to market growth. There is also significant usage of lightweight galley equipment in various ships and aeroplane, which helps to improve operating efficiency while also providing comfort and convenience for passengers, propelling market growth in the next years. If airlines used better galleries, they would be able to serve nicer food and beverages. These factors could have a significant impact on worldwide market performance. The growing demand for modular galleys is also helping to drive market expansion.
Manufacturers are producing novel and aesthetically appealing product versions that can be customised to meet the needs of customers, boosting market expansion in the future years. Furthermore, factors such as rising urbanisation and substantial R&D activities in the aviation industry are expected to drive the market in the next years. Despite its diverse applications, the galley equipment market's progress is limited by a few problems. The increasing popularity of low-cost carriers for a wide range of commercial and personal purposes has hampered the growth of galley equipment. Furthermore, the necessity to reduce the weight and size of galley equipment is a constant problem for businesses in this area
KEY MARKET SEGMENTATION
By Aircraft Type
-
Single-aisle
-
Twin-aisle
-
Business general aviation
By Application
-
Aviation
-
Single-aisle
-
Twin-aisle
-
Business general aviation
-
Marine
-
Defense
-
Commercial
By Insert Type
-
Aviation Galleys
-
Electric Insert
-
Non-Electric Insert
-
Ship Galleys
-
Electric Insert
-
Non-Electric Insert
By Fit
-
Line Fit
-
Retro Fit
By Ship Type
-
Surface Ships
-
Amphibious Ships
-
Passenger Vessels
-
Recreational Boats
-
Bulk Carriers
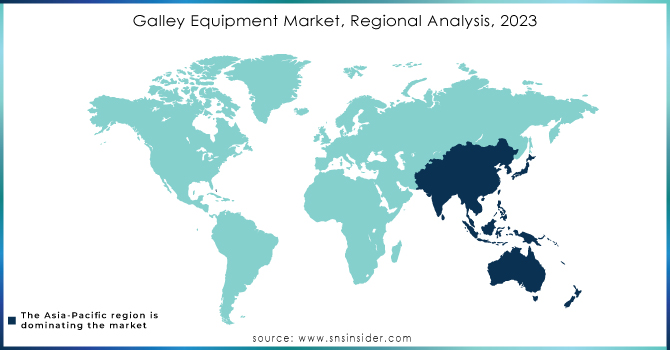
REGIONAL ANALYSIS
The APAC region is expected to have the highest growth rate in the galley equipment market during the projected period. The region has seen significant growth in the aviation and marine industries in recent years, owing mostly to rising demand for new aircraft deliveries and an increase in the region's marine fleet, which is expected to benefit the galley equipment market. This expansion can also be linked to increased government spending on strengthening naval forces, which increases the disposable income of the citizenry in emerging markets such as India and China.
The North American Galley Equipment Market is predicted to grow rapidly due to the increasing number of commercial aircraft and the region's desire for new commercial aircraft and business jets. Furthermore, the cruise industry in North America is expanding as more people opt for cruise travel in the region; new cruise ships with expanded capacity are likely to be delivered in the future, fueling market expansion.
Need any customization research on Galley Equipment Market - Enquiry Now
REGIONAL COVERAGE:
-
North America
-
USA
-
Canada
-
Mexico
-
-
Europe
-
Germany
-
UK
-
France
-
Italy
-
Spain
-
The Netherlands
-
Rest of Europe
-
-
Asia-Pacific
-
Japan
-
south Korea
-
China
-
India
-
Australia
-
Rest of Asia-Pacific
-
-
The Middle East & Africa
-
Israel
-
UAE
-
South Africa
-
Rest of Middle East & Africa
-
-
Latin America
-
Brazil
-
Argentina
-
Rest of Latin America
-
KEY PLAYERS
The Major Players are Rockwell Collins Inc., JAMCO Corporation, Bucher Group, Aerolux, Turkish Cabin Interior, Korita Aviation, Zodiac Aerospace, AIM Altitude, Diehl Stiftung & Co. KG., and other players
| Report Attributes | Details |
|---|---|
| Market Size in 2023 | US$ 8.57 Billion |
| Market Size by 2032 | US$ 12.61 Billion |
| CAGR | CAGR of 4.42% From 2024 to 2032 |
| Base Year | 2023 |
| Forecast Period | 2024-2032 |
| Historical Data | 2020-2022 |
| Report Scope & Coverage | Market Size, Segments Analysis, Competitive Landscape, Regional Analysis, DROC & SWOT Analysis, Forecast Outlook |
| Key Segments | • By Fit (Line Fit, Retro Fit) • By Galley Type (Single Aisle, Twin Aisle, Business Aviation) • By Galley Inserts (Electric Inserts and Non-Electric Inserts) • By Application (Aviation, Marine) |
| Regional Analysis/Coverage | North America (USA, Canada, Mexico), Europe (Germany, UK, France, Italy, Spain, Netherlands, Rest of Europe), Asia-Pacific (Japan, South Korea, China, India, Australia, Rest of Asia-Pacific), The Middle East & Africa (Israel, UAE, South Africa, Rest of Middle East & Africa), Latin America (Brazil, Argentina, Rest of Latin America) |
| Company Profiles | Rockwell Collins Inc., JAMCO Corporation, Bucher Group, Aerolux, Turkish Cabin Interior, Korita Aviation, Zodiac Aerospace, AIM Altitude, Diehl Stiftung & Co. KG., and other players. |
| DRIVERS | • Demand for Lightweight Galley Equipment is Growing • Customization of Galleys Based on Customer Preference |
| RESTRAINTS | • Shipment delays as a result of new programme • Suppliers' Adoption of a Wait-and-See Strategy |
Get in Touch
