Gaming Accessories Market Report Scope & Overview:

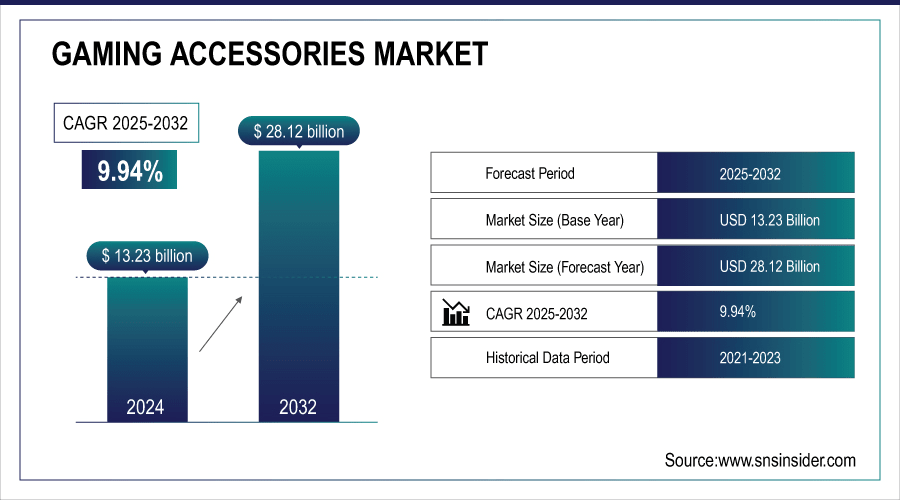
The Gaming Accessories Market size was valued at USD 13.23 Billion in 2024 and is projected to reach USD 28.12 Billion by 2032, growing at a CAGR of 9.94% during 2025-2032.

The global market is experiencing strong growth primarily due to the growing adoption of cutting-edge peripherals, increasing popularity of e-sports, and rising penetration of virtual reality technologies. Some manufacturers are even innovating their own solutions to provide a better immersive experience through various platforms and distribution channels. Covering the gaming accessories market analysis of driving factors, restraining factors, opportunity analysis, segmental analysis, and regional analysis shaping the industry, this report showcases the developing gaming accessories market trends and competitive strategies fueling global market expansion.

  • Over 50% of gamers play on multiple devices (PC, console, and mobile), accelerating demand for universal and wireless accessories.

  • Rising trend of RGB mechanical keyboards and wireless mice, with wireless accessories now making up over 40% of new purchases.

Gaming-Accessories-Market

To Get More Information On Gaming Accessories Market - Request Free Sample Report

Gaming Accessories Market Trends:

  • Rising penetration of cloud gaming and streaming platforms such as Xbox Cloud Gaming, NVIDIA GeForce NOW, and PlayStation Now is reshaping the gaming ecosystem.

  • Growing demand for multi-device compatible accessories that work seamlessly across PCs, mobiles, and consoles is strengthening market opportunities.

  • Manufacturers are focusing on wireless, lightweight, and versatile peripherals to enable portable and cross-platform gameplay experiences.

  • Increasing adoption of virtual reality (VR) and augmented reality (AR) technologies is driving sales of headsets, motion controllers, and immersive accessories.

  • Expansion of metaverse platforms and AR-based games is creating new opportunities for producers to diversify product portfolios.

  • Innovation by leading brands such as Oculus and HTC Vive is inspiring higher consumer spending, fueling demand for next-generation gaming environment accessories.

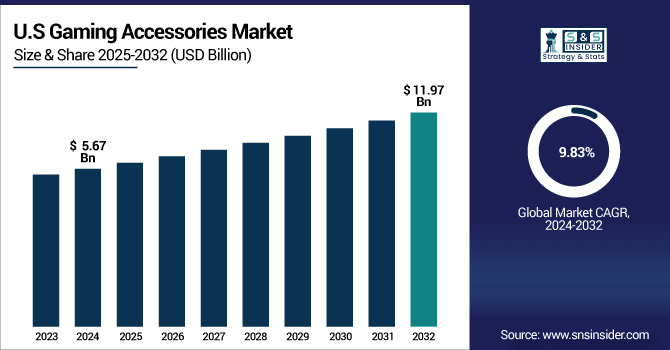
The U.S. Gaming Accessories Market size was valued at USD 5.67 Billion in 2024 and is projected to reach USD 11.97 Billion by 2032, growing at a CAGR of 9.83% during 2025-2032. The U.S. gaming accessories market is currently skyrocketing due to high e-sports penetration, and growing expenditure on high-tech peripherals, particularly among households, and widespread adoption of platforms (PCs, consoles, and VR systems). Further, proliferation of gaming communities, high levels of disposable income, and demand for immersive user experience also boosts the growth of the market. All these factors hold the U.S. in the position of a global gaming innovation centre, nurturing the technology and product advancement throughout the industry.

Gaming-Accessories-Market-Us

The Gaming Accessories Market trends point toward sustained growth with e–sports expansion and VR adoption bode the consumer due to an increase in adventure gameplay which emphasizes gaming accessories–guided experiences to increase manifold nearly doubling the value through 2032.

Gaming Accessories Market Segment Analysis:

  • By Type, Headsets with ~42.10% share in 2024; Virtual Reality Equipment fastest growing (CAGR 10.73%).

  • By Platform, PC dominated ~35.20% in 2024; Mobile fastest growing (CAGR 10.69%).

  • By Distribution Channel, Offline Retail led ~45.10% in 2024; Online Retail fastest growing (CAGR 10.55%).

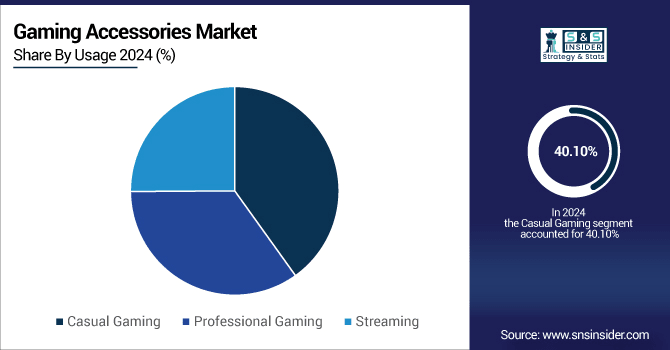
  • By Usage, Casual Gaming led with ~40.10% in 2024; Professional Gaming fastest growing (CAGR 10.29%).

By Usage, Casual Gaming Lead While Professional Gaming Grows the Fastest

Casual Gaming segment accounted for a revenue share of around 40.10% in 2024, attributed to a vast casual gamer population globally and growing inclination towards affordable and mid-priced accessories. For casual gamers, Logitech has a whole host of inexpensive yet durable accessories to meet this demand. The Professional Gaming segment is expected to record the fastest growth rate, CAGR of 10.29% in 2024-2032, due to e-sports, sponsorship, professional leagues, with gamers demanding high-performance, with customizable, and durable accessories. Companies, such as SteelSeries, specializing in high-end pro-level gear for esports athletes.

Gaming-Accessories-Market-By-Usage

By Type, Headsets Leads Market While Virtual Reality Equipment Registers Fastest Growth

Headsets segment accounted for the largest revenue share of approximately 42.10% in 2024, due to the immersive sound quality, noise cancellation, and communication features that are important for multiplayer and competitive gaming. Although there are exceptions, brands, such as HyperX regularly penetrate the market with affordable but top-quality gaming headsets. E-sports viewership and live streaming have also seen a surge, with gamers increasingly willing to pay for high-end audio quality for both competitive and non-competitive gaming environments. The Virtual Reality Equipment segment is anticipated to register the fastest CAGR of nearly 10.73%, throughout 2024-2032, propelled by rapid adoption of VR-based games, the growing engagement with the metaverse, and a continuous development of new technology to improve VR headsets and controllers. Oculus has been a big driving force in moving VR adoption forward with its affordable and pioneering headset options.

By Platform, PC Dominate While Mobile Shows Rapid Growth

PC segment led the gaming accessories market share with over 35.20% revenue in 2024, driven by high adoption of gaming PCs, high-end graphic capabilities, and e-sports tournaments that are mostly based on PC platforms. Razer has long been one of the cornerstones of a solid PC gaming ecosystem, providing high-performance keyboards, mice, and headsets. This is further driven by the continuous upgrades of hardware. Mobile segment is projected to achieve the fastest CAGR of approximately 10.69% over 2024-2032, where growth is driven by high penetration of smartphone gaming, wide availability of high-performance devices, and a rising trend of mobile-based multiplayer and cloud gaming platforms. There are however some companies, such as GameSir have livened things up, creating portable controllers and accessories dedicated on mobile gaming.

By Distribution Channel, Offline Retail Lead While Online Retail Registers Fastest Growth

Offline Retail segment held the highest revenue share of the gaming accessories market at ~45.10% in 2024, driven by major consumer preference toward purchasing accessories from physical stores as the buyer can test the accessories before buying and presence of variety of brands in the physical retail ecosystem as well. Best Buy has been one of the key offline retail players from which gamers can buy a variety of gaming peripherals. The Online Retail segment is anticipated to grow at the highest CAGR of approximately 10.55% during 2024-2032, owing to the comfort associated with e-commerce, competitive pricing, product diversity, and rising consumer confidence in gaming peripherals from online channels. These portals are also encouraging the accessibility and global reach of gaming accessories, such as amazon.

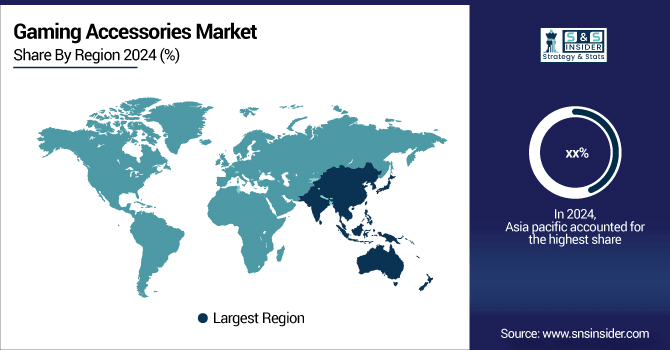
Asia pacific Gaming Accessories Market Insights

Asia Pacific segment is projected to witness the fastest CAGR of 10.87% during the forecast period of 2024–2032 owing to growing smartphone penetration, increasing gaming population, higher disposable income, and increasing investment on gaming infrastructure and e-sports ecosystem. A span of this expansion is significantly affecting the area led by Sony with its PlayStation consoles and embellishments.

Gaming-Accessories-Market-By-Region

Get Customized Report as Per Your Business Requirement - Enquiry Now

North America Gaming Accessories Market Insights

North America accounted for the highest revenue share of approximately 52.30% in 2024 of the Gaming Accessories Market due to presence of dominant manufacturers, early adoption of next generation gaming consoles, and high penetration of e-sports events and communities. Microsoft's Xbox ecosystem is an essential contributor to accessory sales around the region.

Europe Gaming Accessories Market Insights

The Europe gaming accessories market is expected to grow at a steady market during the forecast period 2024-2032, owing to the growing e-sports activities, increasing adoption of console and PC gaming and rising demand for immersive peripherals. Germany, the U.K. and France top the market, buoyed by extensive gaming communities and better infrastructure. Europe has also benefitted from the expansion of online retail and global brand innovation assisting market expansion.

Latin America (LATAM) and Middle East & Africa (MEA) Gaming Accessories Market Insights

The Middle East & Africa gaming accessories market is gaining traction, particularly in UAE, Saudi Arabia, and South Africa, owing to the increasing number of e-sports and console adoption. The market growth is driven by Brazil and Argentina but the region benefits from widespread mobile penetration, cheaper peripherals and larger online gaming communities across the region.

Gaming Accessories Market Growth Drivers:

  • Increasing Adoption of Virtual Reality and Augmented Reality Technologies Enhancing Gaming Experiences across Platforms

The growing usage of virtual reality (VR) and augmented reality (AR) technologies is altering the gaming experience, which is spurring accessory sales. Consumers are taking the plunge into VR headsets, motion controllers, and other peripherals that can make their gameplay more interactive than ever before. Which means that the changeover metaverse platforms and AR prime games are opening up new doors for producers to enlarge product portfolios. Advancements on brands, such as Oculus and HTC Vive are inspiring higher consumers spend. This embrace expands the gaming ecosystem itself and drives more rapid demand for next-gen gaming environment accessories.

Over 70% of gamers feel VR headsets enhance immersion, increasing preference for motion controllers and haptic accessories.

Motion controllers and VR gloves are now used by over 40% of VR gamers, expanding beyond headsets.

Gaming Accessories Market Restraints:

  • High Cost of Advanced Gaming Accessories Limiting Adoption Among Price-Sensitive Consumers in Developing Economies

Pricing is still the biggest roadblock to high-end gaming accessories, especially the emerging markets with low price sensitivity. Casual or entry-level gamers are simply priced out of a lot of premium headsets, keyboards, and VR devices. This limits adoption and thereby the overall growth of the market. Though brands have been experimenting with mid-range offerings, affordability continues to be an impediment to widespread adoption. Demand is additionally stymied in developing markets where economic instability drives play behavior toward budget options or deferred upgrades of personal devices, limiting overall growth potential.

Gaming Accessories Market Opportunities:

  • Rising Penetration of Cloud Gaming and Streaming Platforms Creating New Demand for Multi-Device Compatible Accessories

The growing penetration of cloud gaming and streaming platforms is changing the gaming ecosystem that will also benefit gaming peripherals compatible with multiple devices. With services including Xbox Cloud Gaming, NVIDIA GeForce NOW, and PlayStation Now part of gaming today, demand is strengthening for accessories that work across PCs, mobiles, and consoles. Portable and seamless cross-platform play has become a kind of commodity as expectations grow from gamers. Accessory manufacturers are developing wireless, lightweight, and versatile alternatives with cross-platform compatibility. Not only does this trend catalyze worldwide uptake, it also creates additional avenues for revenue for manufacturers and promotion of growth in emerging and robust gaming markets alike.

Around 65% of gamers expect accessories to support cross-platform play seamlessly.

Mobile accounts for nearly 50% of gaming hours, driving interest in portable, lightweight headsets, controllers, and keyboards.

Gaming Accessories Market Competitive Landscape:

Logitech International S.A. is a Swiss manufacturer of peripherals and accessories for computers, such as gaming gear, and is a leading global brand that blends innovation and quality as one. The Logitech G Pro X Gaming Headset delivers pro-grade sound with Blue VOICE microphone technology, delivering communication enhancements needed for competitive gaming. A 25,600 DPI precise sensor with adaptable weights helps maintain its popularity among e-sports players for the Logitech G502 HERO Gaming Mouse. To this day, Logitech remains a leading manufacturer of reliable performance-oriented products for every type of gamer on the planet.

  • In May 2025, Logitech launched the Logitech Powerplay 2 wireless charging mouse pad, emphasizing convenience with a thinner form factor and simplified wireless charging.

Razer Inc. is a global leader in gaming lifestyle, also known for award-to-winning hardware, software and streaming for the best gamer-fueled experience. The Razer® BlackWidow V4 Pro Mechanical Gaming Keyboard is engineered precision with programmable keys, advanced switches, and RGB Chroma™ lighting for professionals. Immersive surround sound and haptic feedback in the Razer Kraken V3 HyperSense Headset Razer has set itself apart as the trusted hardware partner for competitive and casual gamers around the globe, through design and performance innovation.

  • In March 2025, Announced Razer Basilisk Mobile mouse and Razer Joro compact keyboard, aiming at the portable gaming market with lightweight design and mobile-focused features.

Corsair Gaming, Inc. is a U.S. based global leader in high-performance gaming gear and PC components. Corsair HS80 RGB Wireless Headset: Gamers cannot miss the immersive sound from Corsair headsets, and we gave it the award for best sound for its true Dolby Atmos spatial audio and lag-free wireless performance. With programmable macro keys, per-key RGB and Cherry MX switches, the Corsair K95 RGB Platinum XT Mechanical Keyboard is a pro favorite. Corsair is a company that never stops innovating and is still churning out products that are durable, customizable, and make gaming to the maximum extent of performance.

  • In April 2024, Corsair Gaming launched the Corsair HS80 Max gaming headset, targeting gamers with high-fidelity audio and wireless convenience.

SteelSeries ApS, based in Denmark, develops high-end gaming peripherals for e-sports. With high-fidelity drivers, active noise cancellation, and multi-device connectivity to bolster competitive gaming, its SteelSeries Arctis Nova Pro Wireless Headset makes it even better. Features comfy OmniPoint adjustable switches for unprecedented performance, and unbeatable durability in the SteelSeries Apex Pro Mechanical Keyboard. SteelSeries has a well-known legacy of e-sport pedigree and engineering, consistently providing products designed with professionals and hardcore gamers in mind, ensuring peak performance, focus, and comfort with every outcome-driven movement.

  • In May 2024, Introduced the SteelSeries Arctis Nova Pro Wireless headset, offering dual-battery system, active noise cancellation, and multipurpose connectivity.

HyperX, the gaming division of HP Inc, is a leading global brand of gaming accessories that provides a best-in-class combined performance and value proposition in every price segment. HyperX Cloud Alpha Wireless Gaming Headset has amazing comfort, DTS Headphone:X spatial audio, 300 hours of battery life. The HyperX Alloy FPS RGB Mechanical Gaming Keyboard is compact, mechanical switches, and customizable lighting makes it perfect for FPS gamers on the go. With an emphasis on reliability and innovation, HyperX is building gamer trust among casual and professional gamers alike.

  • In April 2024, released the HyperX Cloud Alpha Wireless headset with a standout 300-hour battery life, appealing particularly to long-session gamers.

Gaming Accessories Market Key Players

Some of the Gaming Accessories Market Companies are:

  • Logitech International S.A.

  • Razer Inc.

  • Corsair Gaming Inc.

  • SteelSeries

  • HyperX

  • Turtle Beach Corporation

  • Cooler Master Technology Inc.

  • Anker Innovations Technology Co. Ltd.

  • Dell Technologies Inc.

  • HP Inc.

  • Mad Catz Global Limited

  • Sennheiser Electronic GmbH & Co. KG

  • Sony Group Corporation

  • Nintendo Co. Ltd.

  • ASUS

  • MSI (Micro-Star International Co., Ltd.)

  • Plantronics Inc.

  • Redragon

  • Sades

  • Gamdias

Gaming Accessories Market Report Scope:

Report Attributes Details
Market Size in 2024 USD 13.23 Billion
Market Size by 2032 USD 28.12 Millon
CAGR CAGR of 9.94% From 2025 to 2032
Base Year 2024
Forecast Period 2025-2032
Historical Data 2021-2023
Report Scope & Coverage Market Size, Segments Analysis, Competitive  Landscape, Regional Analysis, DROC & SWOT Analysis, Forecast Outlook
Key Segments • By Type (Controllers, Headsets, Keyboards, Mice and Virtual Reality Equipment)
• By Platform (PC, Console, Mobile, Virtual Reality and Augmented Reality)
• By Distribution Channel (Online Retail, Offline Retail, Direct Selling and E-commerce Platforms)
• By Usage (Casual Gaming, Professional Gaming and Streaming)
Regional Analysis/Coverage North America (US, Canada, Mexico), Europe (Germany, France, UK, Italy, Spain, Poland, Turkey, Rest of Europe), Asia Pacific (China, India, Japan, South Korea, Singapore, Australia, Taiwan,  Rest of Asia Pacific), Middle East & Africa (UAE, Saudi Arabia, Qatar, South Africa, Rest of Middle East & Africa), Latin America (Brazil, Argentina, Rest of Latin America)
Company Profiles Logitech International S.A., Razer Inc., Corsair Gaming Inc., SteelSeries, HyperX, Turtle Beach Corporation, Cooler Master Technology Inc., Anker Innovations Technology Co. Ltd., Dell Technologies Inc., HP Inc., Mad Catz Global Limited, Sennheiser Electronic GmbH & Co. KG, Sony Group Corporation, Nintendo Co. Ltd., ASUS, MSI (Micro-Star International Co., Ltd.), Plantronics Inc., Redragon, Sades and Gamdias.

Table Of Contents

1. Introduction

1.1 Market Definition & Scope

 1.2 Research Assumptions & Abbreviations

 1.3 Research Methodology

2. Executive Summary

2.1 Market Snapshot

 2.2 Market Absolute $ Opportunity Assessment & Y-o-Y Analysis, 2021–2032

 2.3 Market Size & Forecast, By Segmentation, 2021–2032

  2.3.1 Market Size By Type

  2.3.2 Market Size By Platform

         2.3.3 Market Size By Distribution Channel

         2.3.4 Market Size By Usage

 2.4 Market Share & Bps Analysis By Region, 2024

 2.5 Industry Growth Scenarios – Conservative, Likely & Optimistic

 2.6 Industry CxO’s Perspective

3. Market Overview

3.1 Market Dynamics

  3.1.1 Drivers

  3.1.2 Restraints

  3.1.3 Opportunities

  3.1.4 Key Market Trends

 3.2 Industry PESTLE Analysis

 3.3 Key Industry Forces (Porter’s) Impacting Market Growth

 3.4 Industry Supply Chain Analysis

  3.4.1 Raw Material Suppliers

  3.4.2 Manufacturers

  3.4.3 Distributors/Suppliers

  3.4.4 Customers/End-Users

 3.5 Industry Life Cycle Assessment

 3.6 Parent Market Overview

 3.7 Market Risk Assessment

4. Statistical Insights & Trends Reporting

4.1 Consumer Behavior & Usage Trends

              4.1.1 Overview of consumer demographics and behavior patterns

              4.1.2 Average spending per user by product category

              4.1.3 Device ownership and multi-device usage statistics

              4.1.4 Usage patterns by casual vs. professional users

              4.1.5 Product replacement and upgrade cycle statistics

              4.1.6 Key purchase drivers and preferences (price, brand, performance, etc.)

4.2 Technology Integration & Innovation

              4.2.1 Overview of technology adoption in products

              4.2.2 Penetration of advanced features (e.g., RGB lighting, haptics, VR/AR compatibility)

              4.2.3 Adoption rate of cloud-enabled or smart-integrated products

              4.2.4 Innovation in modular/customizable product formats

              4.2.5 Emerging trends in AI/ML-powered devices

4.3 Cost & Pricing Statistics

              4.3.1 Overview of pricing landscape

              4.3.2 Average price ranges by product category

              4.3.3 Price benchmarking among leading brands

              4.3.4 Historical price trend analysis

              4.3.5 Gross margin and profitability statistics by category

              4.3.6 Regional pricing differences and currency impact

4.4 E-commerce & Distribution Metrics

              4.4.1 Overview of distribution channels

              4.4.2 Online vs. offline sales share (%)

              4.4.3 Marketplace vs. brand-direct sales contribution

              4.4.4 Subscription-based or recurring sales models

              4.4.5 Seasonal, event-driven, and promotional sales spikes

              4.4.6 Delivery performance and logistics efficiency metrics

4.5 Operational & Manufacturing Statistics

              4.5.1 Overview of manufacturing operations

              4.5.2 Production costs by product type

              4.5.3 Supply chain dependency and risk metrics

              4.5.4 Use of sustainable or eco-friendly materials (%)

              4.5.5 Regional manufacturing hub contributions

              4.5.6 Production yield, cycle time, and capacity utilization

4.6 Future Outlook & Emerging Trends

              4.6.1 Overview of market outlook

              4.6.2 Forecasted adoption of eco-friendly and recyclable products

              4.6.3 Emerging AI/ML or smart technology integration

              4.6.4 Growth of metaverse-ready or VR/AR-compatible products

              4.6.5 Expansion of modular and customizable products

              4.6.6 Potential disruptors and scenario-based risk assessment

5. Gaming Accessories Market Segmental Analysis & Forecast, By Type, 2021 – 2032, Value (Usd Billion)

5.1 Introduction

 5.2 Controllers

  5.2.1 Key Trends

  5.2.2 Market Size & Forecast, 2021 – 2032

 5.3 Headsets

  5.3.1 Key Trends

  5.3.2 Market Size & Forecast, 2021 – 2032

    5.4 Keyboards

  5.4.1 Key Trends

  5.4.2 Market Size & Forecast, 2021 – 2032

  5.5 Mice

  5.5.1 Key Trends

  5.5.2 Market Size & Forecast, 2021 – 2032

 5.6 Virtual Reality Equipment

  5.6.1 Key Trends

  5.6.2 Market Size & Forecast, 2021 – 2032

6. Gaming Accessories Market Segmental Analysis & Forecast, By Platform, 2021 – 2032, Value (Usd Billion)

    6.1 Introduction

 6.2 PC

  6.2.1 Key Trends

  6.2.2 Market Size & Forecast, 2021 – 2032

 6.3 Console

  6.3.1 Key Trends

  6.3.2 Market Size & Forecast, 2021 – 2032

   6.4 Mobile

  6.4.1 Key Trends

  6.4.2 Market Size & Forecast, 2021 – 2032

   6.5 Virtual Reality

  6.5.1 Key Trends

  6.5.2 Market Size & Forecast, 2021 – 2032

  6.6 Augmented Reality

  6.6.1 Key Trends

  6.6.2 Market Size & Forecast, 2021 – 2032

7. Gaming Accessories Market Segmental Analysis & Forecast, By Distribution Channel, 2021 – 2032, Value (Usd Billion)

    7.1 Introduction

 7.2 Online Retail

  7.2.1 Key Trends

  7.2.2 Market Size & Forecast, 2021 – 2032

 7.3 Offline Retail

  7.3.1 Key Trends

  7.3.2 Market Size & Forecast, 2021 – 2032

    7.4 Direct Selling

  7.4.1 Key Trends

  7.4.2 Market Size & Forecast, 2021 – 2032

  7.5 E-commerce Platforms

  7.5.1 Key Trends

  7.5.2 Market Size & Forecast, 2021 – 2032

8. Gaming Accessories Market Segmental Analysis & Forecast, By Usage, 2021 – 2032, Value (Usd Billion)

    8.1 Introduction

 8.2 Casual Gaming

  8.2.1 Key Trends

  8.2.2 Market Size & Forecast, 2021 – 2032

 8.3 Professional Gaming

  8.3.1 Key Trends

  8.3.2 Market Size & Forecast, 2021 – 2032

   8.4 Streaming

  8.4.1 Key Trends

  8.4.2 Market Size & Forecast, 2021 – 2032

9. Gaming Accessories Market Segmental Analysis & Forecast By Region, 2021 – 2025, Value (Usd Billion)

9.1 Introduction

9.2 North America

 9.2.1 Key Trends

 9.2.2 Gaming Accessories Market Size & Forecast, By Type, 2021 – 2032

 9.2.3 Gaming Accessories Market Size & Forecast, By Platform, 2021 – 2032

 9.2.4 Gaming Accessories Market Size & Forecast, By Distribution Channel, 2021 – 2032

 9.2.5 Gaming Accessories Market Size & Forecast, By Usage, 2021 – 2032

 9.2.6 Gaming Accessories Market Size & Forecast, By Country, 2021 – 2032

  9.2.6.1 USA

   9.2.6.1.1 Gaming Accessories Market Size & Forecast, By Type, 2021 – 2032

   9.2.6.1.2 Gaming Accessories Market Size & Forecast, By Platform, 2021 – 2032

   9.2.6.1.3 Gaming Accessories Market Size & Forecast, By Distribution Channel, 2021 – 2032

   9.2.6.1.4 Gaming Accessories Market Size & Forecast, By Usage, 2021 – 2032

  9.2.6.2 Canada

   9.2.6.2.1 Gaming Accessories Market Size & Forecast, By Type, 2021 – 2032

   9.2.6.2.2 Gaming Accessories Market Size & Forecast, By Platform, 2021 – 2032

   9.2.6.2.3 Gaming Accessories Market Size & Forecast, By Distribution Channel, 2021 – 2032

   9.2.6.2.4 Gaming Accessories Market Size & Forecast, By Usage, 2021 – 2032

9.3 Europe

 9.3.1 Key Trends

 9.3.2 Gaming Accessories Market Size & Forecast, By Type, 2021 – 2032

 9.3.3 Gaming Accessories Market Size & Forecast, By Platform, 2021 – 2032

 9.3.4 Gaming Accessories Market Size & Forecast, By Distribution Channel, 2021 – 2032

 9.3.5 Gaming Accessories Market Size & Forecast, By Usage, 2021 – 2032

 9.3.6 Gaming Accessories Market Size & Forecast, By Country, 2021 – 2032

  9.3.6.1 Germany

   9.3.6.1.1 Gaming Accessories Market Size & Forecast, By Type, 2021 – 2032

   9.3.6.1.2 Gaming Accessories Market Size & Forecast, By Platform, 2021 – 2032

   9.3.6.1.3 Gaming Accessories Market Size & Forecast, By Distribution Channel, 2021 – 2032

   9.3.6.1.4 Gaming Accessories Market Size & Forecast, By Usage, 2021 – 2032

  9.3.6.2 UK

   9.3.6.2.1 Gaming Accessories Market Size & Forecast, By Type, 2021 – 2032

   9.3.6.2.2 Gaming Accessories Market Size & Forecast, By Platform, 2021 – 2032

   9.3.6.2.3 Gaming Accessories Market Size & Forecast, By Distribution Channel, 2021 – 2032

   9.3.6.2.4 Gaming Accessories Market Size & Forecast, By Usage, 2021 – 2032

  9.3.6.3 France

   9.3.6.3.1 Gaming Accessories Market Size & Forecast, By Type, 2021 – 2032

   9.3.6.3.2 Gaming Accessories Market Size & Forecast, By Platform, 2021 – 2032

   9.3.6.3.3 Gaming Accessories Market Size & Forecast, By Distribution Channel, 2021 – 2032

   9.3.6.3.4 Gaming Accessories Market Size & Forecast, By Usage, 2021 – 2032

  9.3.6.4 Italy

   9.3.6.4.1 Gaming Accessories Market Size & Forecast, By Type, 2021 – 2032

   9.3.6.4.2 Gaming Accessories Market Size & Forecast, By Platform, 2021 – 2032

   9.3.6.4.3 Gaming Accessories Market Size & Forecast, By Distribution Channel, 2021 – 2032

   9.3.6.4.4 Gaming Accessories Market Size & Forecast, By Usage, 2021 – 2032

  9.3.6.5 Spain

   9.3.6.5.1 Gaming Accessories Market Size & Forecast, By Type, 2021 – 2032

   9.3.6.5.2 Gaming Accessories Market Size & Forecast, By Platform, 2021 – 2032

   9.3.6.5.3 Gaming Accessories Market Size & Forecast, By Distribution Channel, 2021 – 2032

   9.3.6.5.4 Gaming Accessories Market Size & Forecast, By Usage, 2021 – 2032

  9.3.6.6 Russia

   9.3.6.6.1 Gaming Accessories Market Size & Forecast, By Type, 2021 – 2032

   9.3.6.6.2 Gaming Accessories Market Size & Forecast, By Platform, 2021 – 2032

   9.3.6.6.3 Gaming Accessories Market Size & Forecast, By Distribution Channel, 2021 – 2032

   9.3.6.6.4 Gaming Accessories Market Size & Forecast, By Usage, 2021 – 2032

  9.3.6.7 Poland

   9.3.6.7.1 Gaming Accessories Market Size & Forecast, By Type, 2021 – 2032

   9.3.6.7.2 Gaming Accessories Market Size & Forecast, By Platform, 2021 – 2032

   9.3.6.7.3 Gaming Accessories Market Size & Forecast, By Distribution Channel, 2021 – 2032

   9.3.6.7.4 Gaming Accessories Market Size & Forecast, By Usage, 2021 – 2032

  9.3.6.8 Rest of Europe

   9.3.6.8.1 Gaming Accessories Market Size & Forecast, By Type, 2021 – 2032

   9.3.6.8.2 Gaming Accessories Market Size & Forecast, By Platform, 2021 – 2032

   9.3.6.8.3 Gaming Accessories Market Size & Forecast, By Distribution Channel, 2021 – 2032

   9.3.6.8.4 Gaming Accessories Market Size & Forecast, By Usage, 2021 – 2032   

9.4 Asia-Pacific

 9.4.1 Key Trends

 9.4.2 Gaming Accessories Market Size & Forecast, By Type, 2021 – 2032

 9.4.3 Gaming Accessories Market Size & Forecast, By Platform, 2021 – 2032

 9.4.4 Gaming Accessories Market Size & Forecast, By Distribution Channel, 2021 – 2032

 9.4.5 Gaming Accessories Market Size & Forecast, By Usage, 2021 – 2032

 9.4.6 Gaming Accessories Market Size & Forecast, By Country, 2021 – 2032

  9.4.6.1 China

   9.4.6.1.1 Gaming Accessories Market Size & Forecast, By Type, 2021 – 2032

   9.4.6.1.2 Gaming Accessories Market Size & Forecast, By Platform, 2021 – 2032

   9.4.6.1.3 Gaming Accessories Market Size & Forecast, By Distribution Channel, 2021 – 2032

   9.4.6.1.4 Gaming Accessories Market Size & Forecast, By Usage, 2021 – 2032

  9.4.6.2 India

   9.4.6.2.1 Gaming Accessories Market Size & Forecast, By Type, 2021 – 2032

   9.4.6.2.2 Gaming Accessories Market Size & Forecast, By Platform, 2021 – 2032

   9.4.6.2.3 Gaming Accessories Market Size & Forecast, By Distribution Channel, 2021 – 2032

   9.4.6.2.4 Gaming Accessories Market Size & Forecast, By Usage, 2021 – 2032

  9.4.6.3 Japan

   9.4.6.3.1 Gaming Accessories Market Size & Forecast, By Type, 2021 – 2032

   9.4.6.3.2 Gaming Accessories Market Size & Forecast, By Platform, 2021 – 2032

   9.4.6.3.3 Gaming Accessories Market Size & Forecast, By Distribution Channel, 2021 – 2032

   9.4.6.3.4 Gaming Accessories Market Size & Forecast, By Usage, 2021 – 2032

  9.4.6.4 South Korea

   9.4.6.4.1 Gaming Accessories Market Size & Forecast, By Type, 2021 – 2032

   9.4.6.4.2 Gaming Accessories Market Size & Forecast, By Platform, 2021 – 2032

   9.4.6.4.3 Gaming Accessories Market Size & Forecast, By Distribution Channel, 2021 – 2032

   9.4.6.4.4 Gaming Accessories Market Size & Forecast, By Usage, 2021 – 2032

  9.4.6.5 Australia

   9.4.6.5.1 Gaming Accessories Market Size & Forecast, By Type, 2021 – 2032

   9.4.6.5.2 Gaming Accessories Market Size & Forecast, By Platform, 2021 – 2032

   9.4.6.5.3 Gaming Accessories Market Size & Forecast, By Distribution Channel, 2021 – 2032

   9.4.6.5.4 Gaming Accessories Market Size & Forecast, By Usage, 2021 – 2032

  9.4.6.6 ASEAN Countries

   9.4.6.6.1 Gaming Accessories Market Size & Forecast, By Type, 2021 – 2032

   9.4.6.6.2 Gaming Accessories Market Size & Forecast, By Platform, 2021 – 2032

   9.4.6.6.3 Gaming Accessories Market Size & Forecast, By Distribution Channel, 2021 – 2032

   9.4.6.6.4 Gaming Accessories Market Size & Forecast, By Usage, 2021 – 2032

  9.4.6.7 Rest of Asia-Pacific

   9.4.6.7.1 Gaming Accessories Market Size & Forecast, By Type, 2021 – 2032

   9.4.6.7.2 Gaming Accessories Market Size & Forecast, By Platform, 2021 – 2032

   9.4.6.7.3 Gaming Accessories Market Size & Forecast, By Distribution Channel, 2021 – 2032

   9.4.6.7.4 Gaming Accessories Market Size & Forecast, By Usage, 2021 – 2032

9.5 Latin America

 9.5.1 Key Trends

 9.5.2 Gaming Accessories Market Size & Forecast, By Type, 2021 – 2032

 9.5.3 Gaming Accessories Market Size & Forecast, By Platform, 2021 – 2032

 9.5.4 Gaming Accessories Market Size & Forecast, By Distribution Channel, 2021 – 2032

 9.5.5 Gaming Accessories Market Size & Forecast, By Usage, 2021 – 2032

 9.5.6 Gaming Accessories Market Size & Forecast, By Country, 2021 – 2032

  9.5.6.1 Brazil

   9.5.6.1.1 Gaming Accessories Market Size & Forecast, By Type, 2021 – 2032

   9.5.6.1.2 Gaming Accessories Market Size & Forecast, By Platform, 2021 – 2032

   9.5.6.1.3 Gaming Accessories Market Size & Forecast, By Distribution Channel, 2021 – 2032

   9.5.6.1.4 Gaming Accessories Market Size & Forecast, By Usage, 2021 – 2032

  9.5.6.2 Argentina

   9.5.6.2.1 Gaming Accessories Market Size & Forecast, By Type, 2021 – 2032

   9.5.6.2.2 Gaming Accessories Market Size & Forecast, By Platform, 2021 – 2032

   9.5.6.2.3 Gaming Accessories Market Size & Forecast, By Distribution Channel, 2021 – 2032

   9.5.6.2.4 Gaming Accessories Market Size & Forecast, By Usage, 2021 – 2032

  9.5.6.3 Mexico

   9.5.6.3.1 Gaming Accessories Market Size & Forecast, By Type, 2021 – 2032

   9.5.6.3.2 Gaming Accessories Market Size & Forecast, By Platform, 2021 – 2032

   9.5.6.3.3 Gaming Accessories Market Size & Forecast, By Distribution Channel, 2021 – 2032

   9.5.6.3.4 Gaming Accessories Market Size & Forecast, By Usage, 2021 – 2032

  9.5.6.4 Colombia

   9.5.6.4.1 Gaming Accessories Market Size & Forecast, By Type, 2021 – 2032

   9.5.6.4.2 Gaming Accessories Market Size & Forecast, By Platform, 2021 – 2032

   9.5.6.4.3 Gaming Accessories Market Size & Forecast, By Distribution Channel, 2021 – 2032

   9.5.6.4.4 Gaming Accessories Market Size & Forecast, By Usage, 2021 – 2032

  9.5.6.5 Rest of Latin America

   9.5.6.5.1 Gaming Accessories Market Size & Forecast, By Type, 2021 – 2032

   9.5.6.5.2 Gaming Accessories Market Size & Forecast, By Platform, 2021 – 2032

   9.5.6.5.3 Gaming Accessories Market Size & Forecast, By Distribution Channel, 2021 – 2032

   9.5.6.5.4 Gaming Accessories Market Size & Forecast, By Usage, 2021 – 2032

9.6 Middle East & Africa

 9.6.1 Key Trends

 9.6.2 Gaming Accessories Market Size & Forecast, By Type, 2021 – 2032

 9.6.3 Gaming Accessories Market Size & Forecast, By Platform, 2021 – 2032

 9.6.4 Gaming Accessories Market Size & Forecast, By Distribution Channel, 2021 – 2032

 9.6.5 Gaming Accessories Market Size & Forecast, By Usage, 2021 – 2032

 9.6.6 Gaming Accessories Market Size & Forecast, By Country, 2021 – 2032

  9.6.6.1 UAE

   9.6.6.1.1 Gaming Accessories Market Size & Forecast, By Type, 2021 – 2032

   9.6.6.1.2 Gaming Accessories Market Size & Forecast, By Platform, 2021 – 2032

   9.6.6.1.3 Gaming Accessories Market Size & Forecast, By Distribution Channel, 2021 – 2032

   9.6.6.1.4 Gaming Accessories Market Size & Forecast, By Usage, 2021 – 2032

  9.6.6.2 Saudi Arabia

   9.6.6.2.1 Gaming Accessories Market Size & Forecast, By Type, 2021 – 2032

   9.6.6.2.2 Gaming Accessories Market Size & Forecast, By Platform, 2021 – 2032

   9.6.6.2.3 Gaming Accessories Market Size & Forecast, By Distribution Channel, 2021 – 2032

   9.6.6.2.4 Gaming Accessories Market Size & Forecast, By Usage, 2021 – 2032

  9.6.6.3 Qatar

   9.6.6.3.1 Gaming Accessories Market Size & Forecast, By Type, 2021 – 2032

   9.6.6.3.2 Gaming Accessories Market Size & Forecast, By Platform, 2021 – 2032

   9.6.6.3.3 Gaming Accessories Market Size & Forecast, By Distribution Channel, 2021 – 2032

   9.6.6.3.4 Gaming Accessories Market Size & Forecast, By Usage, 2021 – 2032

  9.6.6.4 Egypt

   9.6.6.4.1 Gaming Accessories Market Size & Forecast, By Type, 2021 – 2032

   9.6.6.4.2 Gaming Accessories Market Size & Forecast, By Platform, 2021 – 2032

   9.6.6.4.3 Gaming Accessories Market Size & Forecast, By Distribution Channel, 2021 – 2032

   9.6.6.4.4 Gaming Accessories Market Size & Forecast, By Usage, 2021 – 2032

  9.6.6.5 South Africa

   9.6.6.5.1 Gaming Accessories Market Size & Forecast, By Type, 2021 – 2032

   9.6.6.5.2 Gaming Accessories Market Size & Forecast, By Platform, 2021 – 2032

   9.6.6.5.3 Gaming Accessories Market Size & Forecast, By Distribution Channel, 2021 – 2032

   9.6.6.5.4 Gaming Accessories Market Size & Forecast, By Usage, 2021 – 2032

  9.6.6.6 Rest of Middle East & Africa

   9.6.6.6.1 Gaming Accessories Market Size & Forecast, By Type, 2021 – 2032

   9.6.6.6.2 Gaming Accessories Market Size & Forecast, By Platform, 2021 – 2032

   9.6.6.6.3 Gaming Accessories Market Size & Forecast, By Distribution Channel, 2021 – 2032

   9.6.6.6.4 Gaming Accessories Market Size & Forecast, By Usage, 2021 – 2032

10. Competitive Landscape

 10.1 Key Players' Positioning

 10.2 Competitive Developments

  10.2.1 Key Strategies Adopted (%), By Key Players, 2024

  10.2.2 Year-Wise Strategies & Development, 2021 – 2025

  10.2.3 Number Of Strategies Adopted By Key Players, 2024

 10.3 Market Share Analysis, 2024

 10.4 Product/Service & Application Benchmarking

  10.4.1 Product/Service Specifications & Features By Key Players

  10.4.2 Product/Service Heatmap By Key Players

  10.4.3 Application Heatmap By Key Players

 10.5 Industry Start-Up & Innovation Landscape

10.6 Key Company Profiles

 10.6.1 Logitech International S.A.

  10.6.1.1 Company Overview & Snapshot

  10.6.1.2 Product/Service Portfolio

  10.6.1.3 Key Company Financials

  10.6.1.4 SWOT Analysis

 10.6.2 Razer Inc.

  10.6.2.1 Company Overview & Snapshot

  10.6.2.2 Product/Service Portfolio

  10.6.2.3 Key Company Financials

  10.6.2.4 SWOT Analysis

 10.6.3 Corsair Gaming Inc.

  10.6.3.1 Company Overview & Snapshot

  10.6.3.2 Product/Service Portfolio

  10.6.3.3 Key Company Financials

  10.6.3.4 SWOT Analysis

 10.6.4 SteelSeries

  10.6.4.1 Company Overview & Snapshot

  10.6.4.2 Product/Service Portfolio

  10.6.4.3 Key Company Financials

  10.6.4.4 SWOT Analysis

 10.6.5 HyperX

  10.6.5.1 Company Overview & Snapshot

  10.6.5.2 Product/Service Portfolio

  10.6.5.3 Key Company Financials

  10.6.5.4 SWOT Analysis

 10.6.6 Turtle Beach Corporation

  10.6.6.1 Company Overview & Snapshot

  10.6.6.2 Product/Service Portfolio

  10.6.6.3 Key Company Financials

  10.6.6.4 SWOT Analysis

 10.6.7 Cooler Master Technology Inc.

  10.6.7.1 Company Overview & Snapshot

  10.6.7.2 Product/Service Portfolio

  10.6.7.3 Key Company Financials

  10.6.7.4 SWOT Analysis

 10.6.8 Anker Innovations Technology Co. Ltd.

  10.6.8.1 Company Overview & Snapshot

  10.6.8.2 Product/Service Portfolio

  10.6.8.3 Key Company Financials

  10.6.8.4 SWOT Analysis

 10.6.9 Dell Technologies Inc.

  10.6.9.1 Company Overview & Snapshot

  10.6.9.2 Product/Service Portfolio

  10.6.9.3 Key Company Financials

  10.6.9.4 SWOT Analysis

 10.6.10 HP Inc.

  10.6.10.1 Company Overview & Snapshot

  10.6.10.2 Product/Service Portfolio

  10.6.10.3 Key Company Financials

  10.6.10.4 SWOT Analysis

 10.6.11 Mad Catz Global Limited

  10.6.11.1 Company Overview & Snapshot

  10.6.11.2 Product/Service Portfolio

  10.6.11.3 Key Company Financials

  10.6.11.4 SWOT Analysis

 10.6.12 Sennheiser Electronic GmbH & Co. KG

  10.6.12.1 Company Overview & Snapshot

  10.6.12.2 Product/Service Portfolio

  10.6.12.3 Key Company Financials

  10.6.12.4 SWOT Analysis

 10.6.13 Sony Group Corporation

  10.6.13.1 Company Overview & Snapshot

  10.6.13.2 Product/Service Portfolio

  10.6.13.3 Key Company Financials

  10.6.13.4 SWOT Analysis

 10.6.14 Nintendo Co. Ltd.

  10.6.14.1 Company Overview & Snapshot

  10.6.14.2 Product/Service Portfolio

  10.6.14.3 Key Company Financials

  10.6.14.4 SWOT Analysis

 10.6.15 ASUS

  10.6.15.1 Company Overview & Snapshot

  10.6.15.2 Product/Service Portfolio

  10.6.15.3 Key Company Financials

  10.6.15.4 SWOT Analysis

 10.6.16 MSI (Micro-Star International Co., Ltd.)

  10.6.16.1 Company Overview & Snapshot

  10.6.16.2 Product/Service Portfolio

  10.6.16.3 Key Company Financials

  10.6.16.4 SWOT Analysis

 10.6.17 Plantronics Inc.

  10.6.17.1 Company Overview & Snapshot

  10.6.17.2 Product/Service Portfolio

  10.6.17.3 Key Company Financials

  10.6.17.4 SWOT Analysis

 10.6.18 Redragon

  10.6.18.1 Company Overview & Snapshot

  10.6.18.2 Product/Service Portfolio

  10.6.18.3 Key Company Financials

  10.6.18.4 SWOT Analysis

 10.6.19 Sades

  10.6.19.1 Company Overview & Snapshot

  10.6.19.2 Product/Service Portfolio

  10.6.19.3 Key Company Financials

  10.6.19.4 SWOT Analysis

 10.6.20 Gamdias

  10.6.20.1 Company Overview & Snapshot

  10.6.20.2 Product/Service Portfolio

  10.6.20.3 Key Company Financials

  10.6.20.4 SWOT Analysis

11. Analyst Recommendations

 11.1 SNS Insider Opportunity Map

 11.2 Industry Low-Hanging Fruit Assessment

 11.3 Market Entry & Growth Strategy

 11.4 Analyst Viewpoint & Suggestions On Market Growth

12. Assumptions

13. Disclaimer

14. Appendix

 14.1 List Of Tables

 14.2 List Of Figures

Key Segments: 

By Type

  • Controllers

  • Headsets

  • Keyboards

  • Mice

  • Virtual Reality Equipment  

By Platform

  • PC

  • Console

  • Mobile

  • Virtual Reality

  • Augmented Reality

By Distribution Channel

  • Online Retail

  • Offline Retail

  • Direct Selling

  • E-commerce Platforms

By Usage

  • Casual Gaming

  • Professional Gaming

  • Streaming

Request for Segment Customization as per your Business Requirement: Segment Customization Request

Regional Coverage:

North America

  • US

  • Canada

Europe

  • Germany

  • UK

  • France

  • Italy

  • Spain

  • Russia

  • Poland

  • Rest of Europe

Asia Pacific

  • China

  • India

  • Japan

  • South Korea

  • Australia

  • ASEAN Countries

  • Rest of Asia Pacific

Middle East & Africa

  • UAE

  • Saudi Arabia

  • Qatar

  • South Africa

  • Rest of Middle East & Africa

Latin America

  • Brazil

  • Argentina

  • Mexico

  • Colombia

  • Rest of Latin America

Request for Country Level Research Report: Country Level Customization Request

Available Customization 

With the given market data, SNS Insider offers customization as per the company’s specific needs. The following customization options are available for the report: 

  • Detailed Volume Analysis 

  • Criss-Cross segment analysis (e.g. Product X Application) 

  • Competitive Product Benchmarking 

  • Geographic Analysis 

  • Additional countries in any of the regions 

  • Customized Data Representation 

  • Detailed analysis and profiling of additional market players

An accurate research report requires proper strategizing as well as implementation. There are multiple factors involved in the completion of good and accurate research report and selecting the best methodology to compete the research is the toughest part. Since the research reports we provide play a crucial role in any company’s decision-making process, therefore we at SNS Insider always believe that we should choose the best method which gives us results closer to reality. This allows us to reach at a stage wherein we can provide our clients best and accurate investment to output ratio.

Each report that we prepare takes a timeframe of 350-400 business hours for production. Starting from the selection of titles through a couple of in-depth brain storming session to the final QC process before uploading our titles on our website we dedicate around 350 working hours. The titles are selected based on their current market cap and the foreseen CAGR and growth.


The 5 steps process:

Step 1: Secondary Research:

Secondary Research or Desk Research is as the name suggests is a research process wherein, we collect data through the readily available information. In this process we use various paid and unpaid databases which our team has access to and gather data through the same. This includes examining of listed companies’ annual reports, Journals, SEC filling etc. Apart from this our team has access to various associations across the globe across different industries. Lastly, we have exchange relationships with various university as well as individual libraries.

Secondary Research

Step 2: Primary Research

When we talk about primary research, it is a type of study in which the researchers collect relevant data samples directly, rather than relying on previously collected data.  This type of research is focused on gaining content specific facts that can be sued to solve specific problems. Since the collected data is fresh and first hand therefore it makes the study more accurate and genuine.

We at SNS Insider have divided Primary Research into 2 parts.

Part 1 wherein we interview the KOLs of major players as well as the upcoming ones across various geographic regions. This allows us to have their view over the market scenario and acts as an important tool to come closer to the accurate market numbers. As many as 45 paid and unpaid primary interviews are taken from both the demand and supply side of the industry to make sure we land at an accurate judgement and analysis of the market.

This step involves the triangulation of data wherein our team analyses the interview transcripts, online survey responses and observation of on filed participants. The below mentioned chart should give a better understanding of the part 1 of the primary interview.

Primary Research

Part 2: In this part of primary research the data collected via secondary research and the part 1 of the primary research is validated with the interviews from individual consultants and subject matter experts.

Consultants are those set of people who have at least 12 years of experience and expertise within the industry whereas Subject Matter Experts are those with at least 15 years of experience behind their back within the same space. The data with the help of two main processes i.e., FGDs (Focused Group Discussions) and IDs (Individual Discussions). This gives us a 3rd party nonbiased primary view of the market scenario making it a more dependable one while collation of the data pointers.

Step 3: Data Bank Validation

Once all the information is collected via primary and secondary sources, we run that information for data validation. At our intelligence centre our research heads track a lot of information related to the market which includes the quarterly reports, the daily stock prices, and other relevant information. Our data bank server gets updated every fortnight and that is how the information which we collected using our primary and secondary information is revalidated in real time.

Data Bank Validation

Step 4: QA/QC Process

After all the data collection and validation our team does a final level of quality check and quality assurance to get rid of any unwanted or undesired mistakes. This might include but not limited to getting rid of the any typos, duplication of numbers or missing of any important information. The people involved in this process include technical content writers, research heads and graphics people. Once this process is completed the title gets uploader on our platform for our clients to read it.

Step 5: Final QC/QA Process:

This is the last process and comes when the client has ordered the study. In this process a final QA/QC is done before the study is emailed to the client. Since we believe in giving our clients a good experience of our research studies, therefore, to make sure that we do not lack at our end in any way humanly possible we do a final round of quality check and then dispatch the study to the client.