Gas Detection Equipment Market Report Scope & Overview:
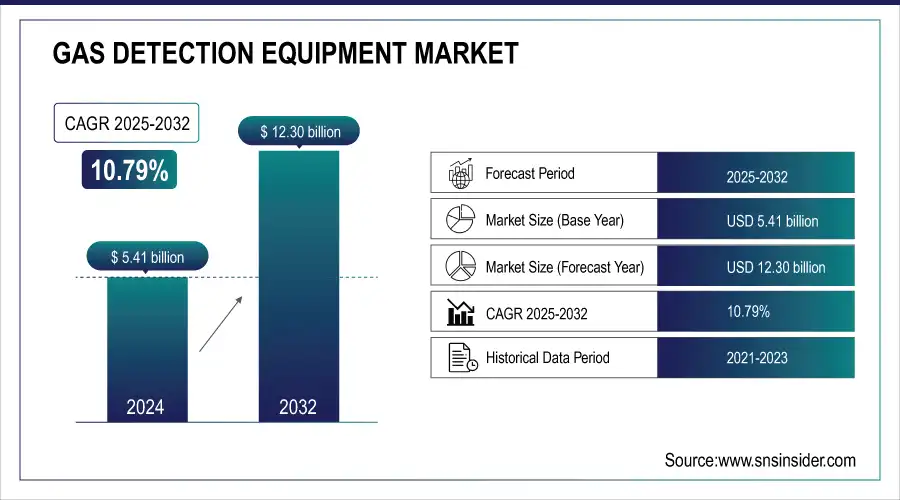
The Gas Detection Equipment Market size was valued at USD 5.41 Billion in 2025E and is expected to reach USD 12.30 Billion by 2033 and grow at a CAGR of 10.79% over the forecast period 2026-2033.
The Gas Detection Equipment Market is experiencing strong growth, driven by increasing industrialization, urbanization, and stringent safety regulations across sectors such as oil & gas, chemicals, mining, and manufacturing. Rising awareness of occupational health and safety standards is prompting companies to adopt advanced gas detection solutions for early identification of hazardous gases and prevention of accidents. Technological advancements, including real-time monitoring, wireless connectivity, and integration with IoT platforms, are enhancing detection accuracy and operational efficiency. Additionally, growing investments in hazardous industrial infrastructure, along with government mandates for workplace safety, are further fueling market expansion globally.
Market Size and Forecast:
-
Gas Detection Equipment Market Size in 2025E: USD 5.41 Billion
-
Gas Detection Equipment Market Size by 2033: USD 12.30 Billion
-
CAGR: 10.79% from 2026 to 2033
-
Base Year: 2025
-
Forecast Period: 2026–2033
-
Historical Data: 2022–2024
To get more information on Gas Detection Equipment Market - Request Free Sample Report
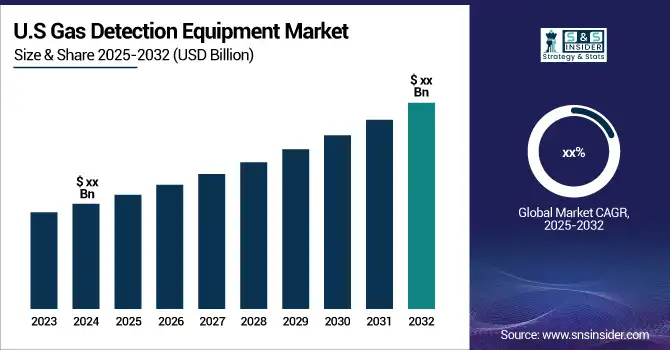
The U.S. Gas Detection Equipment market size was valued at an estimated USD 2.05 billion in 2025 and is projected to reach USD 4.75 billion by 2033, growing at a CAGR of 9.4% over the forecast period 2026–2033. Market growth is driven by stringent workplace safety regulations, increasing awareness of hazardous gas exposure, and rising demand from industries such as oil & gas, chemicals, mining, and manufacturing. Growing adoption of fixed and portable gas detection systems to ensure worker safety, monitor emissions, and prevent industrial accidents is accelerating market expansion. Additionally, advancements in sensor technologies, integration with IoT and wireless communication systems, and strong regulatory enforcement further support the steady growth outlook of the U.S. gas detection equipment market during the forecast period.
Key Gas Detection Equipment Market Trends
-
Growing integration of IoT-enabled and smart sensors for real-time monitoring and predictive safety management.
-
Rising demand for wireless and portable gas detectors to support mobility and flexible deployment across industries.
-
Increasing adoption of AI and advanced analytics for predictive risk assessment and automated alerts.
-
Development of compact multi-gas detection systems enabling simultaneous monitoring of multiple hazardous gases.
-
Expansion of gas detection usage in oil & gas, mining, chemicals, and industrial sectors driven by stringent safety norms.
-
Advancements in battery technology and sensor durability enhancing efficiency of portable gas detectors.
Gas Detection Equipment Market Growth Drivers
-
Stricter safety regulations are driving the demand for advanced gas detection equipment to ensure compliance and protect workers in industrial sectors.
Increasing safety regulations are a key driver of growth in the gas detection equipment market. With oil and gas, mining, chemicals, and manufacturing industries under increasing scrutiny, specialized government regulations and safety in the workplace for both employees and environment must be observed at all costs. These factors have compelled the need for sophisticated gas detection systems in order to monitor these toxic gases, alerting on time for leakages or hazardous concentrations. Often associate these regulations with overall sustainable industrial improvement, workplace accident reduction, and environmental compliance. As a result, businesses are investing in more advanced detection technologies, such as wireless systems, multi-gas sensors, and real-time monitoring solutions. With an increasing focus on the safety compliance, the market is expanding as organizations will be forced to implement and integrate effective gas detection systems to prevent any penalties and to safeguard the workers and facilities.
Gas Detection Equipment Market Restraints
-
High initial costs of advanced gas detection systems can be a barrier for SMEs, limiting their adoption due to budget constraints.
The high initial costs of advanced gas detection systems present a significant barrier, particularly for small and medium-sized enterprises (SMEs) with limited budgets. They typically require significant capital outlay for purchasing, installing and integrating advanced sensors and monitoring systems. For SMEs particularly in cost-sensitive industries, they are hard to justify, especially when compared to their operational budgets. Moreover, the costs do not end with the initial investment; regular upkeep, calibration, and service fees compound the financial load. This might delay or stop smaller businesses from investing in gas detection equipment, which could negatively affect worker safety and legal compliance. The high initial costs can also discourage companies from upgrading to more sophisticated, feature-rich systems, even though these systems could provide long-term benefits in terms of cost savings and risk management. Such market dynamics limit the adoption of life-saving technologies in certain segments of the economy.
Gas Detection Equipment Market Opportunities
-
The integration of IoT and smart solutions in gas detection systems enables real-time monitoring, remote alerts, and predictive maintenance for improved safety and efficiency.
The integration of IoT (Internet of Things) and smart solutions into gas detection systems is creating significant opportunities in the market. With more industries incorporating connected devices, manufacturers are joining with cloud-based platforms to allow real-time monitoring and data analysis of gas detection systems. This integration enables constant remote monitoring of gas levels, with operators able to receive real-time alerts when dangerous conditions arise. Moreover, IoT-powered systems allow for predictive maintenance, as they can monitor the performance of sensors and identify potential problems before they escalate. Real-time data utilization augments decision-making, response times, and whole operational processes wherever and whenever. For example, the trend toward smart, connected gas detection devices is particularly relevant in high-risk environments like oil and gas, mining, and chemicals, where fast detection of leaks or malfunctioning devices is critical. The demand for smart solutions is a high-growth opportunity for manufacturers that can provide sophisticated, customer-friendly, and highly efficient gas detection technologies.
Gas Detection Equipment Market Challenges
-
False alarms and inaccurate readings in gas detection systems can disrupt operations and compromise safety, undermining their reliability.
False alarms and accuracy issues in gas detection equipment pose significant challenges to the effectiveness of these systems. False alarms result in evacuations without the need, and cause disruptions in operations and affecting productivity leading to frustration for both workers and management. Furthermore, any deviations from gas detection systems based in the US can lead to an indifference towards a disturbing threat, or an overreaction to the gas readings. Either scenario affects the reliability of the equipment, and may call into question trust in the system. Factors such as environmental conditions, sensor degradation, or improper calibration can lead to incorrect readings. Gas Safety Systems manufacturers should not only enable continuous gas detection but develop reliable sensors with calibrations to yield accurate live data. In conclusion, overcoming these challenges is essential for ensuring worker safety, operational efficiency, and the future growth of the gas detection equipment market.
Gas Detection Equipment Market Segment Analysis
By Product
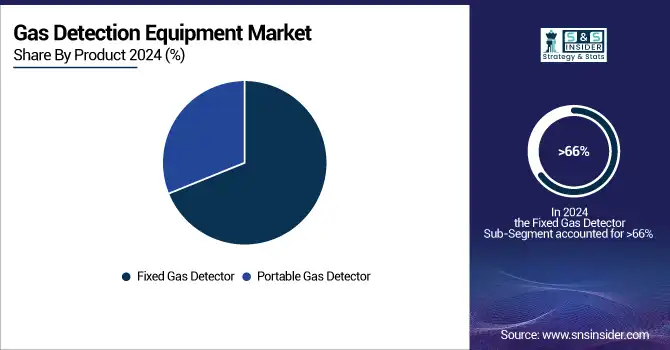
The Fixed Gas Detectors segment dominated with a market share of over 66% in 2025, due to their application in a wide range of industries and commercial operations. They offered around-the-clock preventive protection against leaks or toxic levels of gaseous fumes with real-time monitoring of dangerous gases. Their permanent installation capacity in dangerous areas like factories, chemical factories, and refineries make them a great solution for safety standards. Furthermore, Fixed Gas Detectors can be integrated with larger safety systems, enabling communication with other control and alarm systems. This merger makes them much more robust in the sense they provide early detection and automatic response, which are essential for achieving these goals and securing work settings in a gas hazard-prone environment.
By Technology
The Infrared (IR) segment dominated with a market share of over 32% in 2025, due to its precision and reliability in detecting a wide range of gases, such as carbon dioxide (CO2), methane, and hydrocarbons. IR sensors measure the presence of IR light absorbed by ambient particles and can accurately measure the amount of gas present despite lower concentrations. It is favored in such sectors as oil and gas, mining, and environmental monitoring because it offers real-time, continuous monitoring that requires limited maintenance. With the advantages of high sensitivity, and its resistance to harsh environments, IR technology is the go-to solution for reliable gas detection. Consequently, it has the highest market share while fulfilling vital safety and regulatory needs for different industries.
By End-Use
The Industrial segment dominated with a market share of over 34% in 2025, due to several key factors. Rising overall industrialization across the globe has driven the growth of manufacturing, chemicals, and mining industries that need efficient gas detection systems because they can endanger the safety of workers. Strict safety policies prevail, especially in the hazardous sectors, which require monitoring potentially toxic gases through gas detection and devices, to ensure adherence to occupational health and safety standards. It has increased the need for effective gas detection systems. Moreover, the oil and gas, chemicals, and mining sectors also work in environments where there is a potential for gas leaks and gas detection is vital as this directly impacts operational safety, thus propelling the demand for this segment.
Gas Detection Equipment Market Regional Analysis
Asia Pacific Gas Detection Equipment Market Insights
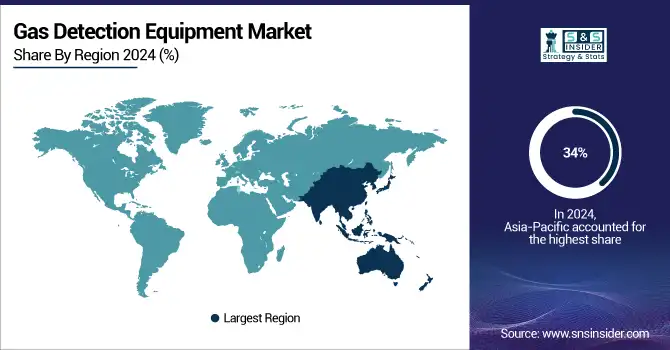
Asia-Pacific region dominated with a market share of over 34% in 2025, driven by rapid industrialization and expanding infrastructure across key economies such as China, India, and Japan. Growing safety regulation and adherence to environmental standards are increasingly being observed across the region, along with the high penetration of gas detection systems. In high-risk industries such as oil & gas, chemicals & mining, the safety threats from dangerous gas leaks make these systems imperative. As the industrial sectors in this region are expanding, thus the demand for reliable gas detection equipment to monitor the air quality and prevent any accidents is increasing. Ultimately, the combination of industrial expansion and safety concerns establishes Asia-Pacific as the strongest market for gas detection technologies.
Need any customization research on Gas Detection Equipment Market - Enquiry Now
North America Gas Detection Equipment Market Insights
North America is the fastest-growing region in the forecasted period 2026-2033, Gas Detection Equipment Market, fueled by significant technological advancements that enhance the efficiency and accuracy of gas detection systems. Although safety systems had been seen as a cost in the past, stringent safety regulations and a growing emphasis on workplace safety in industries including manufacturing, oil & gas, and chemicals has driven demand for these systems as well. A major driver behind the growth of the market within the region is the emphasis on improving safety standards in hazardous environments, particularly in the industrial as well as mining sectors. In addition, the expansion of oil and gas sector, especially in the U.S., is a significant factor for the increased demand for robust gas detection equipment, and is thereby aiding the rapid development of the market and the implementation of advanced technologies.
Europe Gas Detection Equipment Market Insights
Europe represents a robust market for gas detection equipment, supported by strict worker safety norms (ATEX directives) and a strong focus on environmental monitoring. Countries such as Germany, the U.K., and France are at the forefront of adoption due to high industrialization levels and renewable energy expansion, which requires continuous monitoring of gas leaks. Investments in smart factories and digital transformation initiatives are encouraging the deployment of advanced gas detectors integrated with AI and cloud analytics. Furthermore, EU-driven decarbonization goals are also creating demand for detectors that can monitor emissions in industrial facilities.
Latin America (LATAM) Gas Detection Equipment Market Insights
The Latin America market is growing steadily, primarily fueled by the oil & gas sector in countries like Brazil, Mexico, and Venezuela. The expansion of mining and construction activities is also driving adoption of portable gas detectors for worker safety. However, budget constraints and inconsistent regulatory enforcement in some countries pose challenges to widespread adoption. That said, increasing foreign investment in energy projects and rising awareness of workplace safety standards are expected to support steady growth in LATAM over the coming years.
Middle East & Africa (MEA) Gas Detection Equipment Market Insights
The MEA gas detection equipment market is expanding, with the Middle East dominating due to its vast oil & gas operations across Saudi Arabia, the UAE, and Qatar. Strict safety regulations and a strong focus on preventing industrial accidents are driving high demand for both fixed and portable detectors. Africa, led by South Africa and Nigeria, is witnessing increasing adoption in mining and energy industries. Additionally, regional governments are investing heavily in infrastructure and petrochemical projects, further fueling demand for reliable gas monitoring systems.
Gas Detection Equipment Market Competitive Landscape
Siemens
Siemens is a global technology company offering advanced automation, safety, and industrial solutions, including innovative gas detection equipment.
-
In 2024, Siemens introduced the FDA241 detector, leveraging dual-wavelength detection technology to identify smoldering or off-gas particles from lithium-ion batteries up to five times faster than conventional spot detectors. This innovation enhances safety in facilities where early detection of battery malfunctions is crucial.
Drägerwerk AG & Co. KGaA
Drägerwerk AG & Co. KGaA is a leading provider of medical and safety technology products, with a strong portfolio in respiratory protection, gas detection, and escape solutions.
-
In 2024, Dräger launched the OXY SR Cap III, a life-saving escape device designed specifically for underground workers. The launch underscores Dräger’s commitment to advancing personal safety in high-risk and hazardous work environments.
Gas Detection Equipment Market Key Players
Some of the major key players in the Gas Detection Equipment Market
-
ABB – (Gas detectors, process automation solutions)
-
Airtest Technologies, Inc. – (Indoor air quality monitoring, CO2 sensors)
-
FLIR Systems, Inc., – (Gas detection cameras, thermal imaging systems)
-
Fluke Corporation – (Gas analyzers, portable test instruments)
-
General Electric Company – (Industrial gas sensors, hazardous gas detection systems)
-
Honeywell International Inc. – (Portable gas detectors, fixed gas detection systems)
-
Lynred – (Gas sensing solutions, infrared detectors)
-
Opgal – (Thermal cameras, gas detection systems)
-
Siemens – (Gas monitoring systems, industrial process control)
-
Thermo Fisher Scientific, Inc. – (Gas analyzers, environmental monitoring instruments)
-
Drägerwerk AG & Co. KGaA – (Personal gas detectors, industrial safety products)
-
RKI Instruments, Inc. – (Portable and fixed gas detectors)
-
MSA Safety – (Gas detection systems, respiratory protection devices)
-
Emerson Electric Co. – (Gas analyzers, hazardous area solutions)
-
Crowcon Detection Instruments Ltd. – (Toxic and flammable gas detectors)
-
Linde Group – (Gas detection and safety systems)
-
GfG Instrumentation – (Portable gas detectors, fixed monitoring systems)
-
Industrial Scientific Corporation – (Multi-gas detectors, portable detection equipment)
-
Testo SE & Co. KGaA – (Gas analysis instruments, emission measurement)
-
City Technology Ltd. – (Electrochemical gas sensors, oxygen sensors)
Suppliers (they offer products that are widely used in industries like oil and gas, chemical manufacturing, mining, automotive, and environmental monitoring for safety and compliance purposes) on Gas Detection Equipment Market
-
Honeywell International Inc.
-
Thermo Fisher Scientific, Inc.
-
ABB
-
Fluke Corporation
-
Siemens
-
General Electric Company
-
FLIR Systems, Inc.
-
Lynred
-
Airtest Technologies, Inc.
-
Opgal
| Report Attributes | Details |
|---|---|
| Market Size in 2025E | USD 5.41 Billion |
| Market Size by 2033 | USD 12.30 Billion |
| CAGR | CAGR of 10.79% From 2026 to 2033 |
| Base Year | 2025 |
| Forecast Period | 2026-2033 |
| Historical Data | 2022-2024 |
| Report Scope & Coverage | Market Size, Segments Analysis, Competitive Landscape, Regional Analysis, DROC & SWOT Analysis, Forecast Outlook |
| Key Segments | • By Product (Fixed Gas Detector, Portable Gas Detector) • By Technology (Semiconductor, Infrared (IR), Laser-based Detection, Catalytic, PID, Others) • By End Use (Medical, Building Automation & Domestic Appliances, Environmental, Petrochemical, Automotive, Industrial, Others) |
| Regional Analysis/Coverage | North America (US, Canada), Europe (Germany, France, UK, Italy, Spain, Poland, Russsia, Rest of Europe), Asia Pacific (China, India, Japan, South Korea, Australia,ASEAN Countries, Rest of Asia Pacific), Middle East & Africa (UAE, Saudi Arabia, Qatar, Egypt, South Africa, Rest of Middle East & Africa), Latin America (Brazil, Argentina, Mexico, Colombia Rest of Latin America) |
| Company Profiles | ABB, Airtest Technologies, Inc., FLIR Systems, Inc., Fluke Corporation, General Electric Company, Honeywell International Inc., Lynred, Opgal, Siemens, Thermo Fisher Scientific, Inc., Drägerwerk AG & Co. KGaA, RKI Instruments, Inc., MSA Safety, Emerson Electric Co., Crowcon Detection Instruments Ltd., Linde Group, GfG Instrumentation, Industrial Scientific Corporation, Testo SE & Co. KGaA, City Technology Ltd. |
Frequently Asked Questions
Ans: Asia-Pacific dominated the Gas Detection Equipment Market in 2025.
Ans: The “Fixed Gas Detectors” segment dominated the Gas Detection Equipment Market.
Ans: Stricter safety regulations are driving the demand for advanced gas detection equipment to ensure compliance and protect workers in industrial sectors.
Ans: The Gas Detection Equipment Market was USD 5.41 Billion in 2025E and is expected to Reach USD 12.30 Billion by 2033.
Ans: The Gas Detection Equipment Market is expected to grow at a CAGR of 10.79% during 2026-2033.
Get in Touch
