Gas Treatment Market Size & Trends
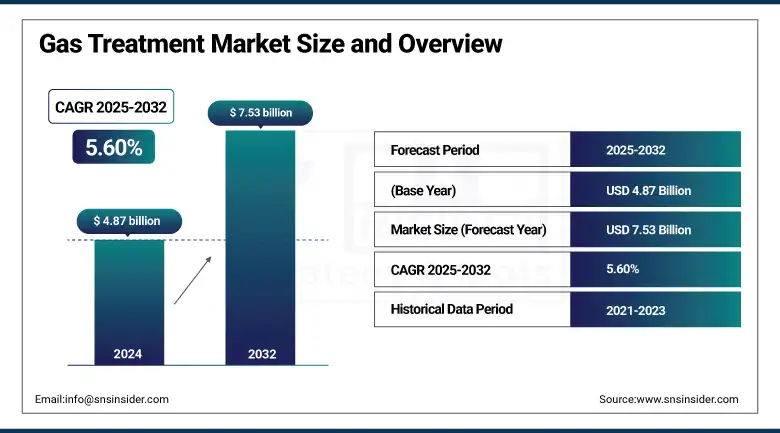
The Gas Treatment Market size was valued at USD 4.87 billion in 2024 and is expected to reach USD 7.53 billion by 2032, growing at a CAGR of 5.60% over the forecast period of 2025-2032.
Rising natural gas demand and stringent emission laws are driving the gas treatment market growth. Gas treatment market trends include increased use of advanced gas treatment chemicals, such as triazine scavengers and environmentally compatible non-amines, and a focus on the development of exhaust gas treatment technologies. Digital integration and carbon capture compatibility are some other drivers of the gas treatment market. The leading gas treatment firms are expanding their products to meet environmental and operational requirements.
To Get more information On Gas Treatment Market - Request Free Sample Report
According to the EPA’s 2024 Final Rule, the U.S. gas facilities must reduce methane emissions by 1.2 million metric tons by 2035. The inclusion of gas processing plants in the Toxics Release Inventory promotes regulatory compliance. These developments are shaping the gas treatment market analysis, expanding the gas treatment market size, and reinforcing gas treatment market share across regions as industrial sectors prioritize efficient and compliant gas treatment systems globally.
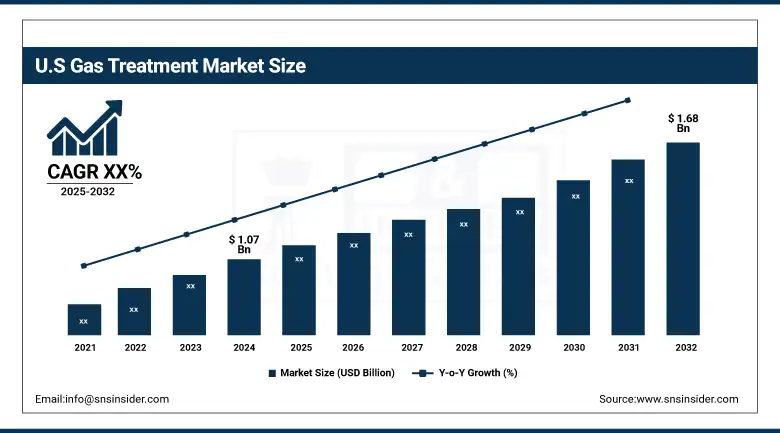
The U.S. leads North America with over 71% regional gas treatment market share valued at USD 1.07 billion in 2024 and is projected to reach a value of USD 1.68 billion by 2032. The U.S. Department of Energy’s San Juan Carbon Capture project uses advanced amine solvents to remove 95% CO₂. DOE and the U.S. EIA data highlight CO₂ pipeline network expansions, boosting natural gas treatment efficiency. Companies including ExxonMobil, Chevron Phillips, and Kinder Morgan deploy solvent-based CCUS and digital systems. These gas treatment companies align with gas treatment market trends, emphasizing sustainability and innovation. Combined with federal support, this positions the U.S. at the forefront of gas treatment market analysis, market size, and long-term gas treatment market growth potential.
Gas Treatment Market Dynamics
Drivers:
-
Increasing Regulatory Pressure on Methane Emission Controls Accelerates the Gas Treatment Market Growth
The gas treatment market is growing on the back of tighter emission regulations by government bodies. Under the E.P.A.’s 2024 rule, natural gas processing plants will be required to cut methane emissions by 1.2 million metric tons by 2035. This regulation is compelling gas treatment companies to use high-end gas treatment chemicals and exhaust gas treatment systems. These changes are in line with gas treatment market trends, help enforce regulation, and ensure overall gas treatment market size, market share growth, long-term market ladder, and the industrial and energy sectors.
-
Rising Demand for Low-Carbon and Renewable Natural Gas Fuels Drives Gas Treatment Chemicals Adoption
Rising global renewable energy consumption is expected to drive demand for next-generation gas treatment systems. Investments by the U.S. Department of Energy are helping to advance renewable natural gas projects that demand high-efficiency gas treatment chemicals. Natural gas and exhaust gas treatment processes and technology need adjustment to changing environmental standards. There is a growing gas treatment market share for gas treaters who are investing in low-emission and sustainable solutions. This trend complements the gas treatment market trends, and helps the gas treatment market size and gas treatment market long-term growth.
Restraints:
-
Variability in Gas Composition Challenges the Uniform Application of Gas Treatment Chemicals
The gas treatment market is challenged by inconsistencies in natural gas composition across different locations. According to the U.S. Department of Energy, impurities including carbon dioxide and hydrogen sulfide vary widely, complicating the application of standard gas treatment chemicals. This variation affects both natural gas treatment and exhaust gas treatment processes. Gas treatment companies must develop adaptable solutions to reduce operational costs. These challenges influence gas treatment market analysis, slow gas treatment market growth, and prevent consistent expansion of the gas treatment market share.
Gas Treatment Market Segmentation Analysis
By Type
Amines dominate the gas treatment market in 2024 with a 62.4% share, driven by widespread use in acid gas removal across oil and gas operations worldwide. Within this category, primary amines such as monoethanolamine lead subsegment growth due to proven performance, high selectivity for H₂S and CO₂, and regulatory acceptance. Secondary and tertiary amines supplement applications requiring lower corrosion rates and thermal stability. According to EPA reports, amine-based solvents achieve over 95% removal efficiency, supporting natural gas treatment compliance. Gas treatment companies, including BASF and Huntsman, are expanding proprietary amine portfolios, reinforcing market share and treatment market size.
Non‑amines segment is fastest growing with an estimated CAGR of 5.78%. Triazine compounds lead subsegment adoption, owing to superior H₂S scavenging capabilities and low degradation rates. According to NETL, triazine scavengers reduce sulfur impurities by over 90%, meeting stringent emission regulations. Gas treatments companies such as Baker Hughes and Ecolab are scaling triazine‑based products for natural gas treatment and exhaust gas treatment. This dynamic shift reflects gas treatment market trends toward sustainable non‑amines, notably driving global sector‑wide market share growth.
By Application
Acid gas removal dominates the gas treatment market in 2024 with a 67.3% share, H₂S and CO₂ capture across oil and gas operations. Amine–based acid removal, methyl diethanolamine formulations, leads subsegment demand due to high selectivity and cost efficiency. According to EPA data, amine solvents maintain over 95% removal rates in large–scale natural gas treatment facilities and emissions standards. Gas treatment companies including Shell Catalysts & Technologies and Fluor Corporation are advancing acid gas removal solutions, reinforcing gas treatment market share.
The dehydration segment is the fastest growing with an estimated CAGR of 5.8% over 2025-2032. Molecular sieve dehydration leads to subsegment adoption due to superior moisture removal and high throughput capacity. According to DOE statistics, molecular sieve systems achieve over 99% water removal efficiency in natural gas treatment units, ensuring pipeline–quality gas. Gas treatment companies, such as UOP and Honeywell are scaling advanced dehydration units, reflecting gas treatment market trends toward process optimization. This dynamic growth enhances the gas treatment market share.
By End-user
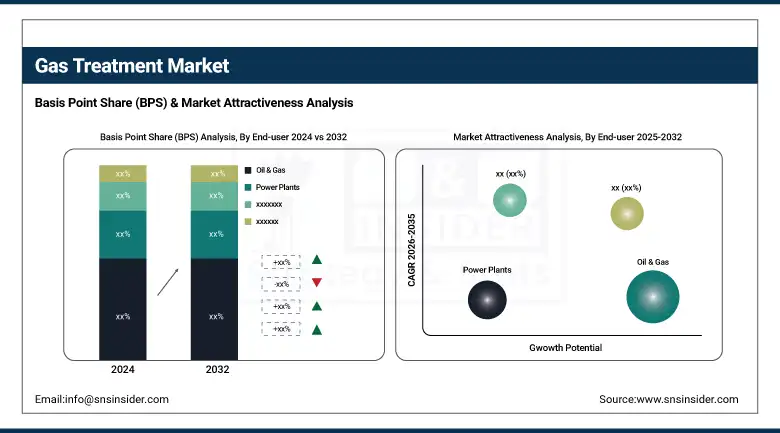
Oil & Gas dominates the gas treatment market in 2024 with a 51.6% share, driven by extensive upstream sour gas processing requirements. Upstream operations, shale gas fields, lead subsegment demand for amine–based solvents. According to the U.S. Energy Information Administration, shale production sites use amine scrubbers, achieving over 90% H₂S removal, and pipeline compliance. Gas treatment companies, including ExxonMobil and Baker Hughes, supply tailored amine solutions for these applications, reinforcing gas treatment market share.
The power plants segment is the fastest growing with an estimated CAGR of 6.17%, driven by shifts toward combined cycle gas turbines. Combined cycle plants, emphasizing efficient exhaust gas treatment, lead to subsegment demand for catalyst–based systems that remove NOₓ and SO₂. The Department of Energy reports advanced selective catalytic reduction units cut NOₓ emissions by over 80% in gas–fired power facilities. Gas treatment companies including Ecolab and Honeywell UOP are deploying treatment packages, reflecting gas treatment market trends toward resilient, low-emission infrastructure.
Gas Treatment Market Regional Insights
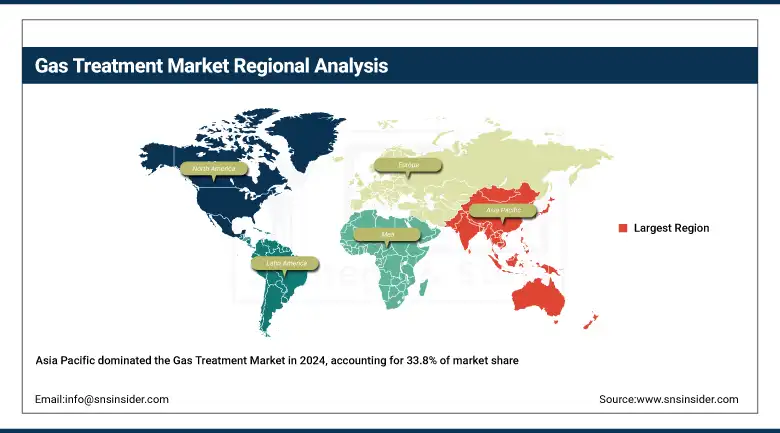
Asia Pacific dominated and held a 33.8% gas treatment market share in 2024, driven by infrastructure expansion and regulatory mandates. China’s 14th five-year plan prioritizes natural gas treatment through amine and dehydration unit installations. Southeast Asian nations enforce strict exhaust gas treatment norms in LNG terminals. Gas treatment companies including Sinopec, Petronas, and Adani Gas are adopting modular gas treatment chemicals and digital solutions. These efforts align with gas treatment market trends, such as environmental compliance and system scalability. This synergy of policy, investment, and innovation continues to solidify the Asia Pacific gas treatment market size and gas treatment market growth leadership globally.
Get Customized Report as per Your Business Requirement - Enquiry Now
North America captured a 30.7% gas treatment market share in 2024 and is the fastest-growing region, with the highest CAGR of 5.94%. Growth is fueled by shale gas projects and environmental regulation. The U.S. EPA supports amine-based CO₂ removal, achieving over 95% efficiency in Permian Basin units. Canada’s clean fuel standards drive LNG upgrades and exhaust gas treatment systems. Gas treatment companies including Chevron Phillips and Suncor leverage modular systems and digital platforms. These gas treatment market trends and regulatory drivers support ongoing gas treatment market growth and solidify North America’s expanding gas treatment market size and technological leadership.
Gas Treatment Market Key Players
The major gas treatment market competitors include BASF SE, Huntsman Corporation, Dow Inc., Clariant AG, Ecolab Inc. (Nalco division), Baker Hughes Company, INEOS Group, Arkema S.A., Solvay S.A., and Chevron Phillips Chemical Company.
Recent Developments in the Gas Treatment Market
-
In April 2025, Axens completed the expansion of its Saudi plant to locally produce hydrogenation tail gas treatment catalysts, improving sulfur recovery efficiency and aligning with Middle East emissions regulations.
-
In January 2025, TotalEnergies began constructing a gas treatment unit in Iraq to capture 50 million cubic feet/day of flared gas, aiming to power 200,000 homes and reduce emissions.
| Report Attributes | Details |
|---|---|
| Market Size in 2024 | USD 4.87 billion |
| Market Size by 2032 | USD 7.53 billion |
| CAGR | CAGR of 5.60% From 2025 to 2032 |
| Base Year | 2024 |
| Forecast Period | 2025-2032 |
| Historical Data | 2021-2023 |
| Report Scope & Coverage | Market Size, Segments Analysis, Competitive Landscape, Regional Analysis, DROC & SWOT Analysis, Forecast Outlook |
| Key Segments | •By Type (Amines [Primary Amines, Secondary Amines, Tertiary Amines], Non-amines [Triazine, Glycols, Others]) •By Application (Acid Gas Removal, Dehydration) •By End-user (Oil & Gas, Power Plants, Refineries, Paper and Pulp, Food and Beverages, Others) |
| Regional Analysis/Coverage | North America (US, Canada, Mexico), Europe (Germany, France, UK, Italy, Spain, Poland, Turkey, Rest of Europe), Asia Pacific (China, India, Japan, South Korea, Singapore, Australia, Rest of Asia Pacific), Middle East & Africa (UAE, Saudi Arabia, Qatar, South Africa, Rest of Middle East & Africa), Latin America (Brazil, Argentina, Rest of Latin America) |
| Company Profiles | BASF SE, Huntsman Corporation, Dow Inc., Clariant AG, Ecolab Inc. (Nalco division), Baker Hughes Company, INEOS Group, Arkema S.A., Solvay S.A., and Chevron Phillips Chemical Company |
Frequently Asked Questions
Asia Pacific leads the Gas Treatment Market share in 2024 at 33.8%, owing to rapid infrastructure expansion and stringent environmental policies.
Digital integration, low-emission gas treatment chemicals, and modular CCUS systems are key Gas Treatment Market trends driving global adoption and innovation.
The United States holds over 70% of North America’s Gas Treatment Market share, driven by large-scale carbon capture projects and regulatory backing.
Non–amines are the fastest-growing segment in the Gas Treatment Market due to high-performance triazine scavengers and sustainable treatment solutions.
The Gas Treatment Market size was valued at USD 4.87 billion in 2024, driven by rising demand for natural gas treatment and stricter emissions regulations.
Get in Touch
