image

Liquefied Natural Gas Market Report Scope & Overview:

The Liquefied Natural Gas Market size was valued at USD 109.56 billion in 2022 and is expected to grow to USD 205.81 billion by 2030 and grow at a CAGR of 8.2 % over the forecast period of 2023-2030.

Natural gas is chilled to a temperature of -1620°C to create liquefied natural gas, which is an odourless and colourless liquid. Gas volume is reduced by 600 times during the liquefaction process, making storage and transportation easier. When liquefied natural gas arrives at its destination, a procedure known as regasification is used to turn it back into gas delivered by pipelines and boats to final users. Due to, liquefied natural gas is a growing fuel. Compared to petrol, diesel, and other fuels, it burns the cleanest.

Liquefied Natural Gas Market Revenue Analysis

Home heating, electric power generation, the production of chemicals and fertilisers, as well as the refuelling of trucks, cruise ships, cargo ships, and other vehicles are all uses for liquefied natural gas. Long-term gas storage reserves were made possible by the development of large-scale cryogenic storage. These liquefied gas reserves are the primary way for networks to accommodate peak local demand. Natural gas is typically transported and stored using LNG from a source to a destination. The use of LNG as a fuel for transportation is probably going to become widespread. It is now being assessed for applications in over-the-road haulage, off-road travel, maritime travel, and train travel.

MARKET DYNAMICS

KEY DRIVERS:  

  • Rising demand for clean energy source

  • Liquefaction capacity is increased

  • Developing sustainable energy sources

It burns cleaner than petrol and diesel, liquefied natural gas is a newly popular fuel. Over the forecast period, key factors including rising global natural gas liquefaction capacity, government initiatives to strengthen gas pipeline infrastructure, and rising demand for a clean energy source from a number of end-use industries are anticipated to fuel the growth of the global liquefied natural gas market.

RESTRAIN:

  • Highly fluctuating

  • High cost

  • Remote areas with inadequate pipeline infrastructure

OPPORTUNITY: 

  • Commercializing Natural Gas

  • Developing new innovations

CHALLENGES:

  • Dealing with country-specific laws and regulations

  • Due to its greater dependence on oil prices, the liquefied natural gas market is particularly volatile.

Due to its greater reliance on oil prices, the market for liquefied natural gas is particularly volatile. In emerging economies, the spot price of liquefied natural gas is typically determined by an oil connection. The absence of global regulations governing LNG uses is also limiting industry expansion. Each nation has its own regulations governing the use of LNG. Key companies in this industry find it challenging to deal with these country-specific laws and regulations. This is preventing investment from entering the market, which is limiting market expansion.

IMPACT ANALYSIS

IMPACT OF RUSSIAN UKRAINE WAR

The Russia-Ukraine conflict is resetting the energy industry, with natural gas becoming a global and linked market that is impacted by dynamics and events that go well beyond its conventional physical limitations, something akin to what oil was for decades. A diverted LNG cargo in the US, a drying river in China, or tensions over Taiwan may all influence the price of gas in Europe, which was formerly practically isolated and heavily reliant on pipeline flow dynamics between Russia and Norway. This has further expedited the globalisation of the petrol market, with experts and market participants increasingly referring to it as the "new oil," notably referencing its geopolitical character because petrol is traded quite widely.

KEY MARKET SEGMENTS

By Application

  • Transportation Fuel

  • Power Generation

  • Others

REGIONAL ANALYSIS

 The Asia Pacific region's revenue share was the highest growth in 2021. Japan had the highest country-level demand and is anticipated to expand significantly throughout the projection period. Gas in the energy mix only makes up 4% to 5% of the primary energy used in the nation, leaving room for improvement. more gas-based power plants are being used, which has expanded their market potential.

In North America, Mexico had the biggest demand, followed by the United States, and is anticipated to expand at the fastest rate, with a market share of 71.01% throughout the projection period. Shale gas deposits are present in the United States, and the government's increased emphasis on incorporating renewable energy sources into the country's energy mix is what is causing the strong demand for LNG. Shale gas deposits exist in Canada in Alberta, British Columbia, Manitoba, and Saskatchewan.

REGIONAL COVERAGE:

North America

  • US

  • Canada

  • Mexico

Europe

  • Eastern Europe

    • Poland

    • Romania

    • Hungary

    • Turkey

    • Rest of Eastern Europe

  • Western Europe

    • Germany

    • France

    • UK

    • Italy

    • Spain

    • Netherlands

    • Switzerland

    • Austria

    • Rest of Western Europe

Asia Pacific

  • China

  • India

  • Japan

  • South Korea

  • Vietnam

  • Singapore

  • Australia

  • Rest of Asia Pacific

Middle East & Africa

  • Middle East

    • UAE

    • Egypt

    • Saudi Arabia

    • Qatar

    • Rest of Middle East

  • Africa

    • Nigeria

    • South Africa

    • Rest of Africa

Latin America

  • Brazil

  • Argentina

  • Colombia

  • Rest of Latin America

RECENT DEVELOPMENT

  • In an effort to establish itself as a Centre for less expensive and cleaner fuel in the area, Ghana is planning to launch the first liquefied natural gas-to-power plant in sub-Saharan Africa in January 2021.

  • A second unit of the USD 10 billion liquefied natural gas project on the Gulf Coast of Louisiana, operated by a Sempra Energy subsidiary based in San Diego, was successfully launched in December 2019. This unit will shortly export natural gas to markets across the world.   

  • In May 2022, Venture Global LNG inked two long-term contracts to provide ExxonMobil LNG Asia Pacific (EMLAP), a registered business name of ExxonMobil Asia Pacific and a subsidiary of ExxonMobil, a U.S. company, with liquefied natural gas (LNG). Venture Global will provide ExxonMobil LNG Asia Pacific with two million tonnes of LNG annually (Mtpa) under these new sales and purchase agreements (SPAs). The Plaquemines LNG project and the CP2 LNG facility will both provide 1 Mtpa to the ExxonMobil subsidiary.

KEY PLAYERS 

British Petroleum (BP) p.l.c., Chevron Corporation, China Petroleum & Chemical Corporation, Eni SpA, Equinor ASA, Exxon Mobil Corporation, Gazprom Energy, PetroChina Company Limited, Royal Dutch Shell PLC, Total S.A. and other players are listed in a final report.

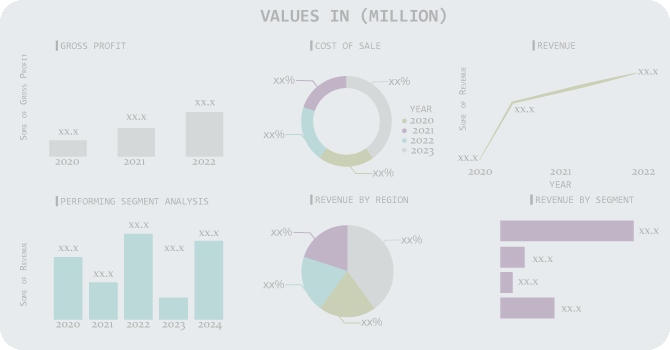
Chevron Corporation-Company Financial Analysis

Company Landscape Analysis

Liquefied Natural Gas Market Report Scope:
Report Attributes Details
Market Size in 2022  US$ 109.56 Bn
Market Size by 2030  US$ 205.81 Bn
CAGR   CAGR of 8.2 % From 2023 to 2030
Base Year 2022
Forecast Period  2023-2030
Historical Data  2020-2021
Report Scope & Coverage Market Size, Segments Analysis, Competitive  Landscape, Regional Analysis, DROC & SWOT Analysis, Forecast Outlook
Key Segments • By Application (Transportation Fuel, Power Generation, Others
Regional Analysis/Coverage North America (US, Canada, Mexico), Europe (Eastern Europe [Poland, Romania, Hungary, Turkey, Rest of Eastern Europe] Western Europe] Germany, France, UK, Italy, Spain, Netherlands, Switzerland, Austria, Rest of Western Europe]). Asia Pacific (China, India, Japan, South Korea, Vietnam, Singapore, Australia, Rest of Asia Pacific), Middle East & Africa (Middle East [UAE, Egypt, Saudi Arabia, Qatar, Rest of Middle East], Africa [Nigeria, South Africa, Rest of Africa], Latin America (Brazil, Argentina, Colombia Rest of Latin America)
Company Profiles British Petroleum (BP) p.l.c., Chevron Corporation, China Petroleum & Chemical Corporation, Eni SpA, Equinor ASA, Exxon Mobil Corporation, Gazprom Energy, PetroChina Company Limited, Royal Dutch Shell PLC, Total S.A.
Key Drivers • Rising demand for clean energy source
• Liquefaction capacity is increased
• Developing sustainable energy sources
Market Restraints • Highly fluctuating
• High cost
• Remote areas with inadequate pipeline infrastructure


Frequently Asked Questions

Ans: Liquefied Natural Gas Market is anticipated to expand by 8.2% from 2023 to 2030.

Ans:  USD 205.81 billion is expected to grow by 2030.

Ans: Liquefied Natural Gas Market size was valued at USD 109.56 billion in 2022

Ans: North America is dominating the market.

Ans: Commercializing Natural Gas

Developing new innovations

TABLE OF CONTENT

1. Introduction
1.1 Market Definition
1.2 Scope
1.3 Research Assumptions

2. Research Methodology

3. Market Dynamics
3.1 Drivers
3.2 Restraints
3.3 Opportunities
3.4 Challenges

4. Impact Analysis
4.1 Impact of the Ukraine- Russia war
4.2 Impact of ongoing Recession
4.2.1 Introduction
4.2.2 Impact on major economies
4.2.2.1 US
4.2.2.2 Canada
4.2.2.3 Germany
4.2.2.4 France
4.2.2.5 United Kingdom
4.2.2.6 China
4.2.2.7 Japan
4.2.2.8 South Korea
4.2.2.9 Rest of the World

5. Value Chain Analysis

6. Porter’s 5 forces model

7. PEST Analysis

8. Liquefied Natural Gas Market Segmentation, By Application
8.1 Transportation Fuel
8.2 Power Generation
8.3 Others

9. Regional Analysis
9.1 Introduction
9.2 North America
9.2.1 North America Liquefied Natural Gas Market by Country
9.2.2 North America Liquefied Natural Gas Market by Application
9.2.3 USA
9.2.3.1 USA Liquefied Natural Gas Market by Application
9.2.4 Canada
9.2.4.1 Canada Liquefied Natural Gas Market by Application
9.2.5 Mexico
9.2.5.1 Mexico Liquefied Natural Gas Market by Application
9.3 Europe
9.3.1 Eastern Europe
9.3.1.1 Eastern Europe Liquefied Natural Gas Market by Country
9.3.1.2 Eastern Europe Liquefied Natural Gas Market by Application
9.3.1.3 Poland
9.3.1.4.1 Poland Liquefied Natural Gas Market by Application
9.3.1.4 Romania
9.3.1.4.1 Romania Liquefied Natural Gas Market by Application
9.3.1.5 Hungary
9.3.1.5.1 Hungary Liquefied Natural Gas Market by Application
9.3.1.6 Turkey
9.3.1.6.1 Turkey Liquefied Natural Gas Market by Application
9.3.1.7 Rest of Eastern Europe
9.3.1.7.1 Rest of Eastern Europe Liquefied Natural Gas Market by Application
9.3.2 Western Europe
9.3.2.1 Western Europe Liquefied Natural Gas Market by Country
9.3.2.2 Western Europe Liquefied Natural Gas Market by Application
9.3.2.3 Germany
9.3.2.3.1 Germany Liquefied Natural Gas Market by Application
9.3.2.4 France
9.3.2.4.1 France Liquefied Natural Gas Market by Application
9.3.2.5 UK
9.3.2.5.1 UK Liquefied Natural Gas Market by Application
9.3.2.6 Italy
9.3.2.6.1 Italy Liquefied Natural Gas Market by Application
9.3.2.7 Spain
9.3.2.7.1 Spain Liquefied Natural Gas Market by Application
9.3.2.8 Netherlands
9.3.2.8.1 Netherlands Liquefied Natural Gas Market by Application
9.3.2.9 Switzerland
9.3.2.9.1 Switzerland Liquefied Natural Gas Market by Application
9.3.2.10 Austria
9.3.2.10.1 Austria Liquefied Natural Gas Market by Application
9.3.2.11 Rest of Western Europe
9.3.2.11.1 Rest of Western Europe Liquefied Natural Gas Market by Application
9.4 Asia-Pacific
9.4.1 Asia Pacific Liquefied Natural Gas Market by Country
9.4.2 Asia Pacific Liquefied Natural Gas Market by Application
9.4.3 China
9.4.3.1 China Liquefied Natural Gas Market by Application
9.4.4 India
9.4.4.1 India Liquefied Natural Gas Market by Application
9.4.5 Japan
9.4.5.1 Japan Liquefied Natural Gas Market by Application
9.4.6 South Korea
9.4.6.1 South Korea Liquefied Natural Gas Market by Application
9.4.7 Vietnam
9.4.7.1 Vietnam Liquefied Natural Gas Market by Application
9.4.8 Singapore
9.4.8.1 Singapore Liquefied Natural Gas Market by Application
9.4.9 Australia
9.4.9.1 Australia Liquefied Natural Gas Market by Application
9.4.10 Rest of Asia-Pacific
9.4.10.1 Rest of Asia-Pacific Liquefied Natural Gas Market by Application
9.5 Middle East & Africa
9.5.1 Middle East
9.5.1.1 Middle East Liquefied Natural Gas Market by Country
9.5.1.2 Middle East Liquefied Natural Gas Market by Application
9.5.1.3 UAE
9.5.1.3.1 UAE Liquefied Natural Gas Market by Application
9.5.1.4 Egypt
9.5.1.4.1 Egypt Liquefied Natural Gas Market by Application
9.5.1.5 Saudi Arabia
9.5.1.5.1 Saudi Arabia Liquefied Natural Gas Market by Application
9.5.1.6 Qatar
9.5.1.6.1 Qatar Liquefied Natural Gas Market by Application
9.5.1.7 Rest of Middle East
9.5.1.7.1 Rest of Middle East Liquefied Natural Gas Market by Application
9.5.2 Africa
9.5.2.1 Africa Liquefied Natural Gas Market by Country
9.5.2.2 Africa Liquefied Natural Gas Market by Application
9.5.2.3 Nigeria
9.5.2.3.1 Nigeria Liquefied Natural Gas Market by Application
9.5.2.4 South Africa
9.5.2.4.1 South Africa Liquefied Natural Gas Market by Application
9.5.2.5 Rest of Africa
9.5.2.5.1 Rest of Africa Liquefied Natural Gas Market by Application
9.6 Latin America
9.6.1 Latin America Liquefied Natural Gas Market by Country
9.6.2 Latin America Liquefied Natural Gas Market by Application
9.6.3 Brazil
9.6.3.1 Brazil Liquefied Natural Gas Market by Application
9.6.4 Argentina
9.6.4.1 Argentina Liquefied Natural Gas Market by Application
9.6.5 Colombia
9.6.5.1 Colombia Liquefied Natural Gas Market by Application
9.6.6 Rest of Latin America
9.6.6.1 Rest of Latin America Liquefied Natural Gas Market by Application

10 Company Profile
10.1 British Petroleum (BP) p.l.c.
10.1.1 Company Overview
10.1.2 Financials
10.1.3 Product/Services Offered
10.1.4 SWOT Analysis
10.1.5 The SNS View
10.2 Chevron Corporation
10.2.1 Company Overview
10.2.2 Financials
10.2.3 Product/Services Offered
10.2.4 SWOT Analysis
10.2.5 The SNS View
10.3 China Petroleum & Chemical Corporation
10.3.1 Company Overview
10.3.2 Financials
10.3.3 Product/Services Offered
10.3.4 SWOT Analysis
10.3.5 The SNS View
10.4 Eni SpA
10.4 Company Overview
10.4.2 Financials
10.4.3 Product/Services Offered
10.4.4 SWOT Analysis
10.4.5 The SNS View
10.5 Equinor ASA
10.5.1 Company Overview
10.5.2 Financials
10.5.3 Product/Services Offered
10.5.4 SWOT Analysis
10.5.5 The SNS View
10.6 Exxon Mobil Corporation
10.6.1 Company Overview
10.6.2 Financials
10.6.3 Product/Services Offered
10.6.4 SWOT Analysis
10.6.5 The SNS View
10.7 Gazprom Energy
10.7.1 Company Overview
10.7.2 Financials
10.7.3 Product/Services Offered
10.7.4 SWOT Analysis
10.7.5 The SNS View
10.8 PetroChina Company Limited
10.8.1 Company Overview
10.8.2 Financials
10.8.3 Product/Services Offered
10.8.4 SWOT Analysis
10.8.5 The SNS View
10.9 Royal Dutch Shell PLC
10.9.1 Company Overview
10.9.2 Financials
10.9.3 Product/Services Offered
10.9.4 SWOT Analysis
10.9.5 The SNS View
10.10 Total S.A
10.10.1 Company Overview
10.10.2 Financials
10.10.3 Product/Services Offered
10.10.4 SWOT Analysis
10.10.5 The SNS View

11. Competitive Landscape
11.1 Competitive Bench marking
11.2 Market Share Analysis
11.3 Recent Developments
11.3.1 Industry News
11.3.2 Company News
11.3.3 Mergers & Acquisitions

12. USE Cases and Best Practices

13. Conclusion

An accurate research report requires proper strategizing as well as implementation. There are multiple factors involved in the completion of good and accurate research report and selecting the best methodology to compete the research is the toughest part. Since the research reports we provide play a crucial role in any company’s decision-making process, therefore we at SNS Insider always believe that we should choose the best method which gives us results closer to reality. This allows us to reach at a stage wherein we can provide our clients best and accurate investment to output ratio.

Each report that we prepare takes a timeframe of 350-400 business hours for production. Starting from the selection of titles through a couple of in-depth brain storming session to the final QC process before uploading our titles on our website we dedicate around 350 working hours. The titles are selected based on their current market cap and the foreseen CAGR and growth.


The 5 steps process:

Step 1: Secondary Research:

Secondary Research or Desk Research is as the name suggests is a research process wherein, we collect data through the readily available information. In this process we use various paid and unpaid databases which our team has access to and gather data through the same. This includes examining of listed companies’ annual reports, Journals, SEC filling etc. Apart from this our team has access to various associations across the globe across different industries. Lastly, we have exchange relationships with various university as well as individual libraries.

Secondary Research

Step 2: Primary Research

When we talk about primary research, it is a type of study in which the researchers collect relevant data samples directly, rather than relying on previously collected data.  This type of research is focused on gaining content specific facts that can be sued to solve specific problems. Since the collected data is fresh and first hand therefore it makes the study more accurate and genuine.

We at SNS Insider have divided Primary Research into 2 parts.

Part 1 wherein we interview the KOLs of major players as well as the upcoming ones across various geographic regions. This allows us to have their view over the market scenario and acts as an important tool to come closer to the accurate market numbers. As many as 45 paid and unpaid primary interviews are taken from both the demand and supply side of the industry to make sure we land at an accurate judgement and analysis of the market.

This step involves the triangulation of data wherein our team analyses the interview transcripts, online survey responses and observation of on filed participants. The below mentioned chart should give a better understanding of the part 1 of the primary interview.

Primary Research

Part 2: In this part of primary research the data collected via secondary research and the part 1 of the primary research is validated with the interviews from individual consultants and subject matter experts.

Consultants are those set of people who have at least 12 years of experience and expertise within the industry whereas Subject Matter Experts are those with at least 15 years of experience behind their back within the same space. The data with the help of two main processes i.e., FGDs (Focused Group Discussions) and IDs (Individual Discussions). This gives us a 3rd party nonbiased primary view of the market scenario making it a more dependable one while collation of the data pointers.

Step 3: Data Bank Validation

Once all the information is collected via primary and secondary sources, we run that information for data validation. At our intelligence centre our research heads track a lot of information related to the market which includes the quarterly reports, the daily stock prices, and other relevant information. Our data bank server gets updated every fortnight and that is how the information which we collected using our primary and secondary information is revalidated in real time.

Data Bank Validation

Step 4: QA/QC Process

After all the data collection and validation our team does a final level of quality check and quality assurance to get rid of any unwanted or undesired mistakes. This might include but not limited to getting rid of the any typos, duplication of numbers or missing of any important information. The people involved in this process include technical content writers, research heads and graphics people. Once this process is completed the title gets uploader on our platform for our clients to read it.

Step 5: Final QC/QA Process:

This is the last process and comes when the client has ordered the study. In this process a final QA/QC is done before the study is emailed to the client. Since we believe in giving our clients a good experience of our research studies, therefore, to make sure that we do not lack at our end in any way humanly possible we do a final round of quality check and then dispatch the study to the client.

Start a Conversation

Hi! Click one of our member below to chat on Phone