Report Scope & Overview:
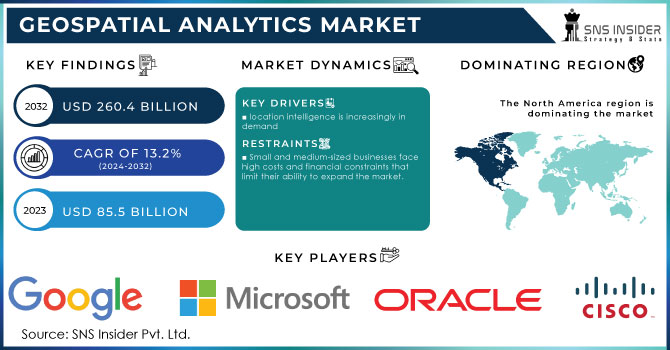
The Geospatial Analytics Market size was valued at USD 71.89 billion in 2022 and is expected to grow to USD 186.43 billion by 2030 and grow at a CAGR of 12.65 % over the forecast period of 2023-2030.
The Geospatial analytics market refers to the industry that deals with the analysis and interpretation of geospatial data to gain insights and make informed decisions. Geospatial analytics involves collecting, managing, and analyzing data with geographic components, such as location, coordinates, and boundaries. It encompasses various techniques, tools, and technologies to extract valuable information from spatial data.
Geospatial analytics enables organizations to understand patterns, relationships, and trends in geospatial data, which can be used for a wide range of applications across different industries. It involves the integration of geographic information systems (GIS), remote sensing, satellite imagery, Global Positioning System (GPS), and other data sources to derive meaningful insights.
To get more information on Geospatial Analytics Market - Request Free Sample Report
Market Dynamics
Drivers
location intelligence is increasingly in demand
Geospatial analytics are being developed in large part due to the rising demand for location intelligence. Organizations from a variety of industries are aware of the enormous benefits that spatial insights can have on their daily operations and decision-making. Location intelligence combines corporate data with geospatial data to provide a greater comprehension of spatial linkages, patterns, and trends. The knowledge that location is crucial for understanding customer behavior, market trends, and resource optimization is what drives this demand in numerous areas of business. Technological developments like cloud computing, big data analytics, and artificial intelligence have sped up demand by making it possible to process and analyze massive amounts of geographical data effectively.
Restrains
Small and medium-sized businesses face high costs and financial constraints that limit their ability to expand the market.
The public's concern regarding privacy has grown as GIS and related geospatial technologies have been used more often. In most scientific disciplines, as well as in organizations like governments and businesses, geospatial data creation and analysis are commonplace. However, because location data is inherently confidential, geospatial research and its societal applications face specific challenges. The collection of data, sharing of locations, use of location-based services, and storage of data are all governed by laws. Companies that gather location information from users are required to abide by several data privacy laws, including the Sensitive Personal Data or Information Act (SPDI) and the General Data Protection Regulation (GDPR). Due to the limited availability of user location data within organizations, the adoption of these analytics tools may be constrained.
Opportunities
Geospatial analytics enables businesses to analyze location data for a variety of key insights.
Challenges
Implementing geospatial analytics systems faces major obstacles due to cost and infrastructure requirements.
The impact of a recession
During a recession, businesses and organizations often cut back on spending and investment. This can result in reduced budgets for geospatial analytics projects and solutions. As a result, the market may experience a decline in demand for geospatial analytics services and software. Recessions typically lead to a slowdown in construction and infrastructure projects. Since geospatial analytics plays a crucial role in planning, monitoring, and managing such projects, the market may experience a decrease in demand for these services during a recession. On the other hand, recessions often drive businesses to focus on cost optimization and efficiency improvement. Geospatial analytics can help organizations optimize their operations, streamline processes, and make data-driven decisions. This may create opportunities for geospatial analytics providers to offer solutions that help businesses cut costs and enhance operational efficiency. During a recession, governments often introduce stimulus packages and infrastructure projects to boost the economy. These initiatives can drive demand for geospatial analytics in areas such as urban planning, transportation, and environmental monitoring. Governments may invest in geospatial analytics to make informed decisions and allocate resources effectively.
Impact of Russia Ukraine War
During a conflict, there is a heightened need for real-time monitoring of the affected areas. Geospatial analytics technologies, such as satellite imagery, remote sensing, and geospatial intelligence, play a crucial role in providing up-to-date information on the changing dynamics of the war zone. This has led to an increased demand for geospatial analytics solutions from governments, defense organizations, and intelligence agencies involved in the conflict. Geospatial analytics can provide a comprehensive understanding of the situation on the ground, including troop movements, infrastructure damage, and territorial changes. This helps military and defense organizations in decision-making processes, tactical planning, and resource allocation. The Russia-Ukraine war has emphasized the importance of situational awareness, driving the adoption of geospatial analytics tools and services.
The conflict has resulted in a humanitarian crisis, with significant population displacement and infrastructure damage. Geospatial analytics can assist in coordinating relief efforts, identifying areas requiring immediate assistance, and assessing the impact of the conflict on the affected population. Humanitarian organizations and relief agencies have increasingly turned to geospatial analytics to optimize their response and recovery strategies. The war has involved territorial disputes and border conflicts. Geospatial analytics technologies enable the monitoring and surveillance of border areas, helping to detect any encroachments, changes in borders, or illegal activities. Governments and border control agencies have recognized the value of geospatial analytics in safeguarding their territorial integrity and have invested in these technologies to enhance their border monitoring capabilities. The Russia-Ukraine war has wider geopolitical implications beyond the immediate conflict zone. It has drawn the attention of global powers, including the United States and European Union, which are closely monitoring the situation. Geospatial analytics plays a role in understanding the geopolitical dynamics, tracking military activities, and assessing the impact on neighboring countries. This has led to increased demand for geospatial analytics from intelligence agencies, diplomatic organizations, and international bodies involved in conflict resolution and monitoring.
Key Market Segmentation
By Component
Solution
Services
By Enterprise Size
Large Enterprises
Small & Medium-Sized Enterprises (Smes)
By Deployment
Cloud
On-Premises
By Application
Disaster Management and Risk Reduction
Public Safety and Medicine Delivery
Surveying
Climate Change Adaptation
Others
By End-User
Defense and Internal Security
Retail & Logistics
Government
Banking, Financial Services and Insurance (BFSI)
Energy & Utilities
Agriculture
Infrastructure & Urban Development
Healthcare & Life Sciences
Others
Need any customization research on Geospatial Analytics Market - Enquiry Now
Regional Analysis
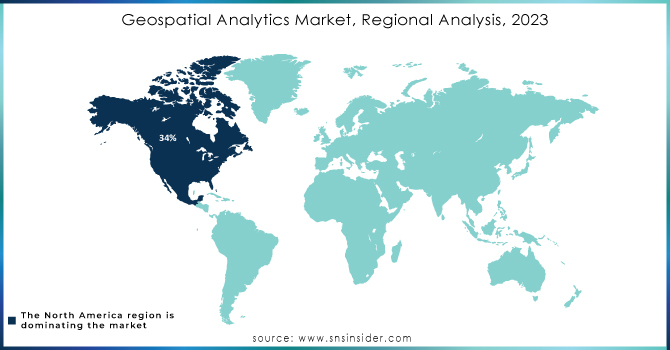
North America will control the worldwide market. In North American industrial applications like construction, agriculture, mining, transportation, and the military and defiance, geospatial technology is frequently used. The United States National Mining Association, for example, combined GIS and location-based solutions to plan and collect geophysical, geological, and topographic data and information on natural resources. In the coming years, it is anticipated that the growth of mobile GIS technologies, which will have a positive impact on the North American market, will increase demand for location-based services and real-time information. We anticipate seeing considerable expansion in Europe. The growth of mobile GIS technology will help the market in this area since there is expected to be a rise in demand for location-based services and real-time data.
The largest CAGR is projected for the Asia Pacific market. Due to the region's expanding economies, notably those of India, China, and Indonesia, more people are now residing in cities. The demand for smart infrastructure, well-planned urban landscapes, and smart cities has surged as a result of this expansion. China, South Korea, and India are setting the pace for the construction of 5G and IoT infrastructure. The market in APAC will expand at the greatest CAGR during the forecast period as a result of these factors.
REGIONAL COVERAGE:
North America
USA
Canada
Mexico
Europe
Germany
UK
France
Italy
Spain
The Netherlands
Rest of Europe
Asia-Pacific
Japan
South Korea
China
India
Australia
Rest of Asia-Pacific
The Middle East & Africa
Israel
UAE
South Africa
Rest of the Middle East & Africa
Latin America
Brazil
Argentina
Rest of Latin America
Key Players:
The major players are Google LLC, Microsoft Corporation, CARTO, Alteryx, Bentley Systems Incorporated, Descartes Labs, Inc., Tomtom, Esri, Pitney Bowes, Fugro, General Electric Co., MDA Corporation, and others in final report.
Recent Developments
May 2021: Esri, a pioneer in geospatial analytics and location intelligence, revealed technological upgrades to ArcGIS Insights, their location analytics platform. ArcGIS Insights has received updates that enable integration with a variety of cloud-native databases, including Snowflake, Amazon Redshift, Google BigQuery, Microsoft Azure SQL, and others.
Report Attributes | Details |
Market Size in 2022 | US$ 71.89 Bn |
Market Size by 2030 | US$ 186.43 Bn |
CAGR | CAGR of 12.65 % From 2023 to 2030 |
Base Year | 2022 |
Forecast Period | 2023-2030 |
Historical Data | 2020-2021 |
Report Scope & Coverage | Market Size, Segments Analysis, Competitive Landscape, Regional Analysis, DROC & SWOT Analysis, Forecast Outlook |
Key Segments | • By Component (Solution, Services) • By Enterprise Size (Large Enterprises, Small & Medium-Sized Enterprises) • By Deployment (Cloud, On-Premises) • By Application (Disaster Management and Risk Reduction, Public Safety and Medicine Delivery, Surveying, Climate Change Adaptation, Others) • By End-User (Defense and Internal, Security, Retail & Logistics, Government, Banking, Financial Services and Insurance (BFSI), Energy & Utilities, Agriculture, Infrastructure & Urban Development, Healthcare & Life Sciences, Others) |
Regional Analysis/Coverage | North America (USA, Canada, Mexico), Europe (Germany, UK, France, Italy, Spain, Netherlands, Rest of Europe), Asia-Pacific (Japan, South Korea, China, India, Australia, Rest of Asia-Pacific), The Middle East & Africa (Israel, UAE, South Africa, Rest of Middle East & Africa), Latin America (Brazil, Argentina, Rest of Latin America) |
Company Profiles | Google LLC, Microsoft Corporation, CARTO, Alteryx, Bentley Systems Incorporated, Descartes Labs, Inc., Tomtom, Esri, Pitney Bowes, Fugro, General Electric Co., MDA Corporation |
Key Drivers | • location intelligence is increasingly in demand |
Market Opportunities | • Geospatial analytics enables businesses to analyze location data for a variety of key insights. |
Ans: The Geospatial Analytics Market is to grow at a CAGR of 12.65% Over the Forecast Period 2023-2030.
Ans: The Geospatial Analytics market is expected to grow to USD 186.43 billion by the forecast period of 2030.
Ans: • Implementing geospatial analytics systems faces major obstacles due to cost and infrastructure requirements.
Ans: North America is said to be the highest-growing region.
Ans: • location intelligence is increasingly in demand
Table of Contents
1. Introduction
1.1 Market Definition
1.2 Scope
1.3 Research Assumptions
2. Research Methodology
3. Market Dynamics
3.1 Drivers
3.2 Restraints
3.3 Opportunities
3.4 Challenges
4. Impact Analysis
4.1 COVID-19 Impact Analysis
4.3 Impact of Ongoing Recession
4.3.1 Introduction
4.3.2 Impact on major economies
4.3.2.1 US
4.3.2.2 Canada
4.3.2.3 Germany
4.3.2.4 France
4.3.2.5 United Kingdom
4.3.2.6 China
4.3.2.7 japan
4.3.2.8 South Korea
4.3.2.9 Rest of the World
5. Value Chain Analysis
6. Porter’s 5 forces model
7. PEST Analysis
8. Geospatial Analytics Market Segmentation, By Component
8.1 Solution
8.2 Services
9. Geospatial Analytics Market Segmentation, By Enterprise Size
9.1 Large Enterprises
9.2 Small & Medium-Sized Enterprises
10. Geospatial Analytics Market Segmentation, By Deployment
10.1 Cloud
10.2 On-Premises
11. Geospatial Analytics Market Segmentation, By Application
11.1 Disaster Management and Risk Reduction
11.2 Public Safety and Medicine Delivery
11.3 Surveying
11.4 Climate Change Adaptation
11.5 Others
12. Geospatial Analytics Market Segmentation, By End Users
12.1 Defense and Internal Security
12.2 Retail & Logistics
12.3 Government
12.4 Banking, Financial Services and Insurance (BFSI)
12.5 Energy & Utilities
12.6 Agriculture
12.7 Infrastructure & Urban Development
12.8 Healthcare & Life Sciences
12.9 Others
13. Regional Analysis
13.1 Introduction
13.2 North America
13.2.1 North America Geospatial Analytics Market By Country
13.2.2North America Geospatial Analytics Market By Component
13.2.3 North America Geospatial Analytics Market By Enterprise Size
13.2.4 North America Geospatial Analytics Market By Deployment
13.2.5 North America Geospatial Analytics Market By Application
13.2.6 North America Geospatial Analytics Market By End Users
13.2.7 USA
13.2.7.1 USA Geospatial Analytics Market By Component
13.2.7.2 USA Geospatial Analytics Market By Enterprise Size
13.2.7.3 USA Geospatial Analytics Market By Deployment
13.2.7.4 USA Geospatial Analytics Market By Application
13.2.7.5 USA Geospatial Analytics Market By End Users
13.2.8 Canada
13.2.8.1 Canada Geospatial Analytics Market By Component
13.2.8.2 Canada Geospatial Analytics Market By Enterprise Size
13.2.8.3 Canada Geospatial Analytics Market By Deployment
13.2.8.4 Canada Geospatial Analytics Market By Application
13.2.8.5 Canada Geospatial Analytics Market By End Users
13.2.9 Mexico
13.2.9.1 Mexico Geospatial Analytics Market By Component
13.2.9.2 Mexico Geospatial Analytics Market By Enterprise Size
13.2.9.3 Mexico Geospatial Analytics Market By Deployment
13.2.9.4 Mexico Geospatial Analytics Market By Application
13.2.9.5 Mexico Geospatial Analytics Market By End Users
13.3 Europe
13.3.1 Europe Geospatial Analytics Market By country
13.3.2 Europe Geospatial Analytics Market By Component
13.3.3 Europe Geospatial Analytics Market By Enterprise Size
13.3.4 Europe Geospatial Analytics Market By Deployment
13.3.5 Europe Geospatial Analytics Market By Application
13.3.6 Europe Geospatial Analytics Market By End Users
13.3.7 Germany
13.3.7.1 Germany Geospatial Analytics Market By Component
13.3.7.2 Germany Geospatial Analytics Market By Enterprise Size
13.3.7.3 Germany Geospatial Analytics Market By Deployment
13.3.7.4 Germany Geospatial Analytics Market By Application
13.3.7.5 Germany Geospatial Analytics Market By End Users
13.3.8 UK
13.3.8.1 UK Geospatial Analytics Market By Component
13.3.8.2 UK Geospatial Analytics Market By Enterprise Size
13.3.8.3 UK Geospatial Analytics Market By Deployment
13.3.8.4 UK Geospatial Analytics Market By Application
13.3.8.5 UK Geospatial Analytics Market By End Users
13.3.9 France
13.3.9.1 France Geospatial Analytics Market By Component
13.3.9.2 France Geospatial Analytics Market By Enterprise Size
13.3.9.3 France Geospatial Analytics Market By Deployment
13.3.9.4 France Geospatial Analytics Market By Application
13.3.9.5 France Geospatial Analytics Market By End Users
13.3.10 Italy
13.3.10.1 Italy Geospatial Analytics Market By Component
13.3.10.2 Italy Geospatial Analytics Market By Enterprise Size
13.3.10.3 Italy Geospatial Analytics Market By Deployment
13.3.10.4 Italy Geospatial Analytics Market By Application
13.3.10.5 Italy Geospatial Analytics Market By End Users
13.3.11 Spain
13.3.11.1 Spain Geospatial Analytics Market By Component
13.3.11.2 Spain Geospatial Analytics Market By Enterprise Size
13.3.11.3 Spain Geospatial Analytics Market By Deployment
13.3.11.4 Spain Geospatial Analytics Market By Application
13.3.11.5 Spain Geospatial Analytics Market By End Users
13.3.12 The Netherlands
13.3.12.1 Netherlands Geospatial Analytics Market By Component
13.3.12.2 Netherlands Geospatial Analytics Market By Enterprise Size
13.3.12.3 Netherlands Geospatial Analytics Market By Deployment
13.3.12.4 Netherlands Geospatial Analytics Market By Application
13.3.12.5 Netherlands Geospatial Analytics Market By End Users
13.3.13 Rest of Europe
13.3.13.1 Rest of Europe Geospatial Analytics Market By Component
13.3.13.2 Rest of Europe Geospatial Analytics Market By Enterprise Size
13.3.13.3 Rest of Europe Geospatial Analytics Market By Deployment
13.3.13.4 Rest of Europe Geospatial Analytics Market By Application
13.3.13.5 Rest of Europe Geospatial Analytics Market By End Users
13.4 Asia-Pacific
13.4.1 Asia Pacific Geospatial Analytics Market By country
13.4.2 Asia Pacific Geospatial Analytics Market By Component
13.4.3 Asia Pacific Geospatial Analytics Market By Enterprise Size
13.4.4Asia Pacific Geospatial Analytics Market By Deployment
13.4.5Asia Pacific Geospatial Analytics Market By Application
13.4.6 Asia Pacific Geospatial Analytics Market By End Users
13.4.7 Japan
13.4.7.1 Japan Geospatial Analytics Market By Component
13.4.7.2 Japan Geospatial Analytics Market By Enterprise Size
13.4.7.3 Japan Geospatial Analytics Market By Deployment
13.4.7.4 Japan Geospatial Analytics Market By Application
13.4.7. 5Japan Geospatial Analytics Market By End Users
13.4.8South Korea
13.4.8.1 South Korea Geospatial Analytics Market By Component
13.4.8.2 South Korea Geospatial Analytics Market By Enterprise Size
13.4.8.3 South Korea Geospatial Analytics Market By Deployment
13.4.8.4 South Korea Geospatial Analytics Market By Application
13.4.8.5 South Korea Geospatial Analytics Market By End Users
13.4.9 China
13.4.9.1 China Geospatial Analytics Market By Component
13.4.9.2 China Geospatial Analytics Market By Enterprise Size
13.4.9.3 China Geospatial Analytics Market By Deployment
13.4.9.4 China Geospatial Analytics Market By Application
13.4.9.5 China Geospatial Analytics Market By End Users
13.4.10 India
13.4.10.1 India Geospatial Analytics Market By Component
13.4.10.2 India Geospatial Analytics Market By Enterprise Size
13.4.10.3 India Geospatial Analytics Market By Deployment
13.4.10.4 India Geospatial Analytics Market By Application
13.4.10.5 India Geospatial Analytics Market By End Users
13.4.11 Australia
13.4.11.1 Australia Geospatial Analytics Market By Component
13.4.11.2 Australia Geospatial Analytics Market By Enterprise Size
13.4.11.3 Australia Geospatial Analytics Market By Deployment
13.4.11.4 Australia Geospatial Analytics Market By Application
13.4.11.5 Australia Geospatial Analytics Market By End Users
13.4.12 Rest of Asia-Pacific
13.4.12.1 APAC Geospatial Analytics Market By Component
13.4.12.2 APAC Geospatial Analytics Market By Enterprise Size
13.4.12.3 APAC Geospatial Analytics Market By Deployment
13.4.12.4 APAC Geospatial Analytics Market By Application
13.4.12.5 APAC Geospatial Analytics Market By End Users
13.5 The Middle East & Africa
13.5.1 The Middle East & Africa Geospatial Analytics Market By country
13.5.2 The Middle East & Africa Geospatial Analytics Market By Component
13.5.3 The Middle East & Africa Geospatial Analytics Market By Enterprise Size
13.5.4The Middle East & Africa Geospatial Analytics Market By Deployment
13.5.5 The Middle East & Africa Geospatial Analytics Market By Application
13.5.6The Middle East & Africa Geospatial Analytics Market By End Users
13.5.7 Israel
13.5.7.1 Israel Geospatial Analytics Market By Component
13.5.7.2 Israel Geospatial Analytics Market By Enterprise Size
13.5.7.3 Israel Geospatial Analytics Market By Deployment
13.5.7.4 Israel Geospatial Analytics Market By Application
13.5.7.5 Israel Geospatial Analytics Market By End Users
13.5.8 UAE
13.5.8.1 UAE Geospatial Analytics Market By Component
13.5.8.2 UAE Geospatial Analytics Market By Enterprise Size
13.5.8.3 UAE Geospatial Analytics Market By Deployment
13.5.8.4 UAE Geospatial Analytics Market By Application
13.5.8.5 UAE Geospatial Analytics Market By End Users
13.5.9South Africa
13.5.9.1 South Africa Geospatial Analytics Market By Component
13.5.9.2 South Africa Geospatial Analytics Market By Enterprise Size
13.5.9.3 South Africa Geospatial Analytics Market By Deployment
13.5.9.4 South Africa Geospatial Analytics Market By Application
13.5.9.5 South Africa Geospatial Analytics Market By End Users
13.5.10 Rest of Middle East & Africa
13.5.10.1 Rest of Middle East & Asia Geospatial Analytics Market By Component
13.5.10.2 Rest of Middle East & Asia Geospatial Analytics Market By Enterprise Size
13.5.10.3 Rest of Middle East & Asia Geospatial Analytics Market By Deployment
13.5.10.4 Rest of Middle East & Asia Geospatial Analytics Market By Application
13.5.10.5 Rest of Middle East & Asia Geospatial Analytics Market By End Users
13.6 Latin America
13.6.1 Latin America Geospatial Analytics Market By Country
13.6.2 Latin America Geospatial Analytics Market By Component
13.6.3 Latin America Geospatial Analytics Market By Enterprise Size
13.6.4 Latin America Geospatial Analytics Market By Deployment
13.6.5Latin America Geospatial Analytics Market By Application
13.6.6 Latin America Geospatial Analytics Market By End Users
13.6.7 Brazil
13.6.7.1 Brazil Geospatial Analytics Market By Component
13.6.7.2 Brazil Africa Geospatial Analytics Market By Enterprise Size
13.6.7.3Brazil Geospatial Analytics Market By Deployment
13.6.7.4 Brazil Geospatial Analytics Market By Application
13.6.7.5 Brazil Geospatial Analytics Market By End Users
13.6.8 Argentina
13.6.8.1 Argentina Geospatial Analytics Market By Component
13.6.8.2 Argentina Geospatial Analytics Market By Enterprise Size
13.6.8.3 Argentina Geospatial Analytics Market By Deployment
13.6.8.4 Argentina Geospatial Analytics Market By Application
13.6.8.5 Argentina Geospatial Analytics Market By End Users
13.6.9 Rest of Latin America
13.6.9.1 Rest of Latin America Geospatial Analytics Market By Component
13.6.9.2 Rest of Latin America Geospatial Analytics Market By Enterprise Size
13.6.9.3 Rest of Latin America Geospatial Analytics Market By Deployment
13.6.9.4 Rest of Latin America Geospatial Analytics Market By Application
13.6.9.5 Rest of Latin America Geospatial Analytics Market By End Users
14. Company Profile
14.1 Google LLC.
14.1.1 Market Overview
14.1.2 Financials
14.1.3 Product/Services/Offerings
14.1.4 SWOT Analysis
14.1.5 The SNS View
14.2 Microsoft Corporation.
14.2.1 Market Overview
14.2.2 Financials
14.2.3 Product/Services/Offerings
14.2.4 SWOT Analysis
14.2.5 The SNS View
14.3 CARTO.
14.3.1 Market Overview
14.3.2 Financials
14.3.3 Product/Services/Offerings
14.3.4 SWOT Analysis
14.3.5 The SNS View
14.4 Alteryx.
14.4.1 Market Overview
14.4.2 Financials
14.4.3 Product/Services/Offerings
14.4.4 SWOT Analysis
14.4.5 The SNS View
14.5 Bentley Systems Incorporated.
14.5.1 Market Overview
14.5.2 Financials
14.5.3 Product/Services/Offerings
14.5.4 SWOT Analysis
14.5.5 The SNS View
14.6 Descartes Labs, Inc.
14.6.1 Market Overview
14.6.2 Financials
14.6.3 Product/Services/Offerings
14.6.4 SWOT Analysis
14.6.5 The SNS View
14.7 Tomtom.
14.7.1 Market Overview
14.7.2 Financials
14.7.3 Product/Services/Offerings
14.7.4 SWOT Analysis
14.7.5 The SNS View
14.8 Esri.
14.8.1 Market Overview
14.8.2 Financials
14.8.3 Product/Services/Offerings
14.8.4 SWOT Analysis
14.8.5 The SNS View
14.9 Pitney Bowes.
14.9.1 Market Overview
14.9.2 Financials
14.9.3 Product/Services/Offerings
14.9.4 SWOT Analysis
14.9.5 The SNS View
14.10 General Electric Co.
14.10.1 Market Overview
14.10.2 Financials
14.10.3 Product/Services/Offerings
14.10.4 SWOT Analysis
14.10.5 The SNS View
15. Competitive Landscape
15.1 Competitive Benchmarking
15.2 Market Share Analysis
15.3 Recent Developments
16. USE Cases and Best Practices
17. Conclusion
An accurate research report requires proper strategizing as well as implementation. There are multiple factors involved in the completion of good and accurate research report and selecting the best methodology to compete the research is the toughest part. Since the research reports we provide play a crucial role in any company’s decision-making process, therefore we at SNS Insider always believe that we should choose the best method which gives us results closer to reality. This allows us to reach at a stage wherein we can provide our clients best and accurate investment to output ratio.
Each report that we prepare takes a timeframe of 350-400 business hours for production. Starting from the selection of titles through a couple of in-depth brain storming session to the final QC process before uploading our titles on our website we dedicate around 350 working hours. The titles are selected based on their current market cap and the foreseen CAGR and growth.
The 5 steps process:
Step 1: Secondary Research:
Secondary Research or Desk Research is as the name suggests is a research process wherein, we collect data through the readily available information. In this process we use various paid and unpaid databases which our team has access to and gather data through the same. This includes examining of listed companies’ annual reports, Journals, SEC filling etc. Apart from this our team has access to various associations across the globe across different industries. Lastly, we have exchange relationships with various university as well as individual libraries.
Step 2: Primary Research
When we talk about primary research, it is a type of study in which the researchers collect relevant data samples directly, rather than relying on previously collected data. This type of research is focused on gaining content specific facts that can be sued to solve specific problems. Since the collected data is fresh and first hand therefore it makes the study more accurate and genuine.
We at SNS Insider have divided Primary Research into 2 parts.
Part 1 wherein we interview the KOLs of major players as well as the upcoming ones across various geographic regions. This allows us to have their view over the market scenario and acts as an important tool to come closer to the accurate market numbers. As many as 45 paid and unpaid primary interviews are taken from both the demand and supply side of the industry to make sure we land at an accurate judgement and analysis of the market.
This step involves the triangulation of data wherein our team analyses the interview transcripts, online survey responses and observation of on filed participants. The below mentioned chart should give a better understanding of the part 1 of the primary interview.
Part 2: In this part of primary research the data collected via secondary research and the part 1 of the primary research is validated with the interviews from individual consultants and subject matter experts.
Consultants are those set of people who have at least 12 years of experience and expertise within the industry whereas Subject Matter Experts are those with at least 15 years of experience behind their back within the same space. The data with the help of two main processes i.e., FGDs (Focused Group Discussions) and IDs (Individual Discussions). This gives us a 3rd party nonbiased primary view of the market scenario making it a more dependable one while collation of the data pointers.
Step 3: Data Bank Validation
Once all the information is collected via primary and secondary sources, we run that information for data validation. At our intelligence centre our research heads track a lot of information related to the market which includes the quarterly reports, the daily stock prices, and other relevant information. Our data bank server gets updated every fortnight and that is how the information which we collected using our primary and secondary information is revalidated in real time.
Step 4: QA/QC Process
After all the data collection and validation our team does a final level of quality check and quality assurance to get rid of any unwanted or undesired mistakes. This might include but not limited to getting rid of the any typos, duplication of numbers or missing of any important information. The people involved in this process include technical content writers, research heads and graphics people. Once this process is completed the title gets uploader on our platform for our clients to read it.
Step 5: Final QC/QA Process:
This is the last process and comes when the client has ordered the study. In this process a final QA/QC is done before the study is emailed to the client. Since we believe in giving our clients a good experience of our research studies, therefore, to make sure that we do not lack at our end in any way humanly possible we do a final round of quality check and then dispatch the study to the client.
The Wearable Payments market size was valued at USD 48.08 Bn in 2022 and is expected to reach USD 143.05 Bn by 2030, and grow at a CAGR of 14.6% over the forecast period 2023-2030.
The Carbon Accounting Software Market Size was estimated at USD 12.5 billion in 2022, and it is anticipated to reach USD 65.06 billion by 2030, growing at a CAGR of 22.9% over the forecast period of 2023–2030.
The Digital Health Market size was valued at USD 220.17 Bn in 2022 and is expected to reach at USD 1633 Bn by 2030, and grow at a CAGR of 28.47% over the forecast period 2023-2030.
Bluetooth 5.0 Market was worth USD 4.3 billion in 2022 and is predicted to be worth USD 9.78 billion by 2030, growing at a CAGR of 10.83 % between 2023 and 2030.
The Education ERP Market size was USD 14.7 billion in 2022 and is expected to Reach USD 44.6 billion by 2030 and grow at a CAGR of 14.9 % over the forecast period of 2023-2030
The Artificial Intelligence (AI) In Retail Market size was valued at USD 5.07 Bn in 2022 and is expected to reach USD 44.48 Bn by 2030, and grow at a CAGR of 31.17% over the forecast period 2023-2030.
Hi! Click one of our member below to chat on Phone