In-Building Wireless Market Key Insights:
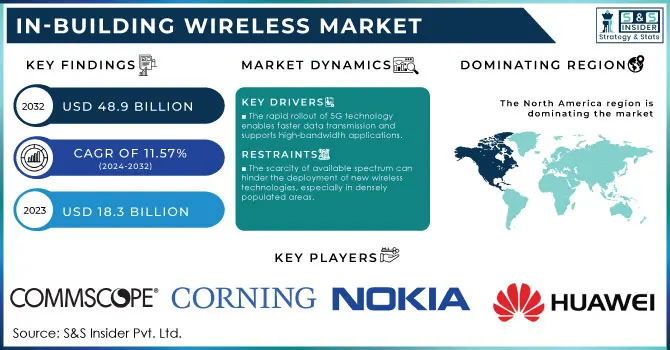
The In-building Wireless Market size was valued at USD 18.3 billion in 2023 and is expected to reach USD 48.9 Billion by 2032, growing at a CAGR of 11.57% over the forecast period of 2024-2032. The in-building wireless market is experiencing significant growth as organizations strive to improve mobile connectivity within their facilities. As reliance on mobile devices and smart technologies increases, the demand for a strong wireless infrastructure has become critical. A major factor driving this growth is the swift adoption of advanced technologies like 5G, which enables faster data transmission and supports high-bandwidth applications such as augmented reality (AR) and virtual reality (VR). Additionally, the need for reliable communication systems is growing across various sectors, including healthcare, hospitality, and retail. For instance, hospitals are implementing in-building wireless solutions to facilitate essential medical applications, allowing healthcare professionals to access patient data remotely, thereby improving response times and overall patient care. A notable example is the recent installation of a comprehensive in-building wireless network at a major hospital in New York City, which led to a 35% increase in data access speeds for medical personnel.
To Get More Information on In-building Wireless Market - Request Sample Report
Furthermore, the rise of remote work and the increasing number of connected devices in office environments are encouraging businesses to invest in in-building wireless solutions to ensure uninterrupted connectivity for their employees. Government initiatives aimed at enhancing digital infrastructure are also significantly contributing to market growth. For example, the U.S. Federal Communications Commission (FCC) has been promoting the expansion of broadband services, which includes efforts to improve wireless connectivity within buildings.
As organizations continue to prioritize digital transformation, the in-building wireless market is positioned for substantial growth, driven by technological advancements, increasing connectivity demands, and supportive government policies.
Market Dynamics
Drivers
-
The rapid rollout of 5G technology enables faster data transmission and supports high-bandwidth applications.
-
The increase in remote work arrangements drives the need for seamless wireless connectivity in office spaces.
-
The proliferation of smart technologies and IoT devices within buildings increases the demand for advanced wireless infrastructure.
The increasing adoption of smart technologies and IoT (Internet of Things) devices in buildings is driving a significant demand for advanced wireless infrastructure, particularly in the in-building wireless market. As these technologies become essential components of modern building designs, they depend on seamless connectivity to perform optimally. This category of devices includes smart lighting, climate control systems, security cameras, and various automated solutions that require reliable communication. The growing prevalence of IoT devices across sectors such as healthcare, retail, and hospitality highlights the necessity for a robust in-building wireless network capable of accommodating numerous connected devices.
For example, in healthcare, IoT-enabled medical devices facilitate real-time patient monitoring, which is crucial for enhancing patient outcomes. These devices produce large volumes of data that must be transmitted quickly and securely, emphasizing the need for a strong wireless infrastructure. In the retail sector, smart technologies like inventory management systems and customer analytics tools depend on real-time data access to optimize operations and improve customer experiences. Insufficient wireless connectivity can greatly hinder the effectiveness of these smart solutions.
Additionally, as buildings become smarter, the density of devices increases, resulting in heightened demands for bandwidth and lower latency. Advanced wireless technologies, including 5G and Wi-Fi 6, are specifically designed to manage this increased demand, providing the necessary speed and reliability. This shift towards smart technologies not only necessitates upgrades to current wireless systems but also promotes investments in new infrastructure that can support the expanding ecosystem of IoT devices.
Moreover, as organizations prioritize digital transformation, they increasingly recognize the critical role of a dependable wireless infrastructure in integrating smart technologies. This realization further drives growth in the in-building wireless market as stakeholders seek to future-proof their facilities and enhance operational efficiency. Ultimately, the convergence of smart technologies and IoT devices in buildings underscores the urgent need for developing sophisticated in-building wireless networks that can adapt to evolving connectivity requirements.
Restraints
-
The scarcity of available spectrum can hinder the deployment of new wireless technologies, especially in densely populated areas.
-
Rapid advancements in technology can lead to concerns about investing in systems that may quickly become outdated.
-
Integrating new wireless technologies with existing systems and infrastructure can pose technical challenges and require extensive planning.
Integrating new wireless technologies with existing systems and infrastructure presents significant technical challenges within the in-building wireless market. As organizations increasingly adopt advanced solutions like 5G and Wi-Fi 6, ensuring compatibility with older technologies and legacy infrastructures becomes crucial. This integration is necessary, as businesses often rely on a combination of new and existing equipment—such as routers, switches, and access points—that must function together to deliver seamless connectivity.
A primary challenge is achieving compatibility, as older systems may not support the latest wireless standards, resulting in connectivity problems or performance bottlenecks. For instance, if a facility's legacy network cannot handle the increased data rates provided by 5G, users might face slower speeds, diminished reliability, and overall dissatisfaction. Additionally, the integration of diverse technologies often requires specialized knowledge and expertise that may not be readily available within the organization. This skill gap may lead to the need for hiring external consultants or contractors, which can escalate costs and prolong project timelines.
The complexity of the physical environment further complicates the integration process. Differences in building design, materials, and layouts can affect wireless signal propagation and coverage. Therefore, conducting thorough site surveys and planning is essential to determine the best locations for access points and other equipment, ensuring adequate coverage while minimizing interference.
Furthermore, comprehensive planning must include evaluating the current network infrastructure, assessing bandwidth requirements, and anticipating future scalability needs. Organizations need to devise a thoughtful strategy for gradually introducing new technologies without disrupting ongoing operations. This process necessitates collaboration among various stakeholders, including IT teams, facility managers, and external vendors, to ensure a coordinated approach for successful integration.
In summary, while integrating new wireless technologies can enhance connectivity and improve operational efficiency, it requires careful consideration of existing systems, thorough planning, and specialized expertise to effectively manage the complexities involved.
Segment Analysis
By Offering
In 2023, the infrastructure segment led the market, accounting for over 63.7% of total revenue. In-building wireless infrastructure effectively overcomes challenges posed by building materials like steel, concrete, and low-emissivity glass, which can block or weaken cellular signals. By utilizing specialized equipment, this infrastructure enhances and distributes cellular signals, ensuring occupants remain connected to their mobile devices no matter where they are in the building. In addition to improving coverage, in-building wireless infrastructure supports various wireless communication technologies, including 4G LTE, 5G, Wi-Fi, and public safety communications.
The services segment is projected to experience significant growth during the forecast period. The rising complexity of modern in-building wireless systems has increased the demand for professional services such as design, installation, and ongoing maintenance to ensure optimal performance. Moreover, the swift deployment of 5G networks and the integration of advanced technologies like IoT and AI have amplified the need for specialized expertise and support. As a result, many enterprises are opting to outsource their in-building wireless needs to service providers, benefiting from their technical expertise and realizing cost efficiencies.
By Application
In 2023, the commercial campuses segment held the largest share of the market, driven by strong demand for advanced wireless infrastructure across expansive facilities such as office parks, business centers, and industrial campuses. These locations require comprehensive in-building wireless systems to support high user volumes, numerous devices, and diverse applications. The need for seamless connectivity over large areas, coupled with the adoption of smart building technologies and high-speed internet, is spurring significant investment in solutions like DAS and small cells.
The transportation and logistics segment is expected to grow at the highest CAGR over the forecast period. This growth is attributed to the rising demand for advanced in-building wireless solutions to meet the evolving needs of the transportation and logistics industries. As supply chains grow more complex and digitalized, reliable, high-speed connectivity within warehouses, distribution centers, and transportation hubs becomes increasingly critical. Furthermore, the expansion of smart transportation initiatives, such as connected vehicles and automated facilities, further drives the need for robust, seamless wireless networks. As these sectors continue to innovate and expand, demand for sophisticated in-building wireless infrastructure is anticipated to fuel considerable growth in this segment.
By Building Size
In 2023, the large buildings segment dominated the market and represented a significant revenue share in 2023, propelled by strong demand for advanced wireless infrastructure across large-scale facilities like commercial complexes, shopping malls, and high-rise offices. These spaces require robust, comprehensive in-building wireless systems to provide reliable connectivity across multiple floors and zones. Due to the size and complexity of these structures, sophisticated solutions like DAS and small cells are essential for efficiently managing high user volumes and data traffic. Additionally, the need for seamless connectivity to support IoT devices, smart building systems, and high-speed internet has driven significant investment in wireless infrastructure for large buildings.
The small and medium-sized buildings segment is expected to grow rapidly in the coming years. This growth reflects the rising demand for efficient, cost-effective in-building wireless solutions suited to various commercial and residential spaces. As connectivity needs expand and technology progresses, smaller buildings are increasingly investing in reliable wireless infrastructure to support an expanding array of smart devices, IoT applications, and high-speed internet requirements. The increase in remote work and the growing prevalence of connected technologies in everyday life further fuels this trend.
Regional Analysis
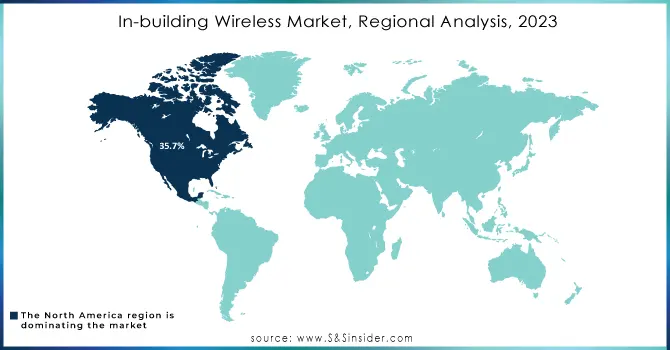
In 2023, North America dominated the in-building wireless market, representing over 35.7% of revenue share. With the U.S. and Canada leading, the region’s well-established infrastructure fuels strong demand for in-building wireless solutions. Robust economies support significant investment in advanced technologies, solidifying North America’s leadership. Growing reliance on reliable indoor connectivity, driven by rising smart device use and data-heavy applications, highlights the importance of dependable wireless coverage. Additionally, the swift rollout of 5G networks has further boosted demand for enhanced infrastructure to accommodate higher frequencies and data rates.
Meanwhile, the Asia Pacific region is projected to record the highest CAGR during the forecast period. This growth is spurred by accelerating urbanization, rising infrastructure investments, and extensive 5G network expansion. The region’s dynamic tech sector and digital transformation initiatives are intensifying the need for seamless indoor connectivity. As economies across Asia Pacific advance, demand for sophisticated in-building wireless infrastructure is expected to increase significantly.
Do You Need any Customization Research on In-building Wireless Market - Inquire Now
Key Players
The major key players are
-
CommScope – OneCell Small Cell Solution
-
Corning Incorporated – Corning Optical Network Evolution (ONE) DAS
-
Nokia – Nokia AirScale Indoor Radio
-
Ericsson – Ericsson Radio Dot System
-
Huawei – Huawei LampSite
-
ZTE Corporation – ZTE QCell Indoor Solution
-
Samsung Electronics – Samsung LinkCell
-
AT&T – AT&T Distributed Antenna System (DAS)
-
Verizon – Verizon In-Building 5G Solutions
-
Comba Telecom Systems – Comba DAS (Distributed Antenna System)
-
SOLiD – SOLiD ALLIANCE DAS
-
DASAN Zhone Solutions – DASAN DAS Solutions
-
Boingo Wireless – Boingo Neutral Host DAS
-
JMA Wireless – TEKO DAS
-
TE Connectivity – FlexWave Spectrum DAS
-
Airspan Networks – Airspan AirVelocity
-
Advanced RF Technologies (ADRF) – ADXV DAS
-
Casa Systems – Axyom Indoor Small Cells
-
Betacom – Betacom Private 5G Networks
-
Intracom Telecom – WiBAS Indoor Solutions
Recent Developments
-
In February 2024, Corning joined forces with Dell Technologies and Intel to launch a new Radio Access Network (RAN) Compute Platform aimed at expediting the rollout of 5G networks within high-density buildings. This platform is intended to offer a flexible and cost-effective solution for ensuring reliable network access and improving user experiences in locations such as airports, office buildings, hotels, and hospitals.
-
In February 2024, CommScope revealed its integration of Open RAN technology indoors, enhancing Open RAN support on its ERA DAS and ONECELL small cells. This development is expected to facilitate the creation of open, sustainable, and converged 5G indoor networks.
| Report Attributes | Details |
|---|---|
| Market Size in 2023 | USD 18.3 Billion |
| Market Size by 2032 | USD 48.9 Billion |
| CAGR | CAGR of 11.57% From 2024 to 2032 |
| Base Year | 2023 |
| Forecast Period | 2024-2032 |
| Historical Data | 2020-2022 |
| Report Scope & Coverage | Market Size, Segments Analysis, Competitive Landscape, Regional Analysis, DROC & SWOT Analysis, Forecast Outlook |
| Key Segments | • By Offering (Infrastructure, Services) • By Business model (Service Providers, Enterprises, Neutral Host Operators) • By Building Size (Large Buildings, Small & Medium Size Buildings) • By Application (Commercial Campuses, Government, Transportation & Logistics, Hospitality, Industrial & Manufacturing, Education, Healthcare, Entertainment & Sports Venues, Others) |
| Regional Analysis/Coverage | North America (US, Canada, Mexico), Europe (Eastern Europe [Poland, Romania, Hungary, Turkey, Rest of Eastern Europe] Western Europe] Germany, France, UK, Italy, Spain, Netherlands, Switzerland, Austria, Rest of Western Europe]), Asia Pacific (China, India, Japan, South Korea, Vietnam, Singapore, Australia, Rest of Asia Pacific), Middle East & Africa (Middle East [UAE, Egypt, Saudi Arabia, Qatar, Rest of Middle East], Africa [Nigeria, South Africa, Rest of Africa], Latin America (Brazil, Argentina, Colombia, Rest of Latin America) |
| Company Profiles | CommScope, Corning Incorporated, Nokia, Ericsson, Huawei , ZTE Corporation,Samsung Electronics, AT&T, Verizon, Comba Telecom Systems, SOLiD, DASAN Zhone Solutions, Boingo Wireless, JMA Wireless |
| Key Drivers | •The rapid rollout of 5G technology enables faster data transmission and supports high-bandwidth applications. • The increase in remote work arrangements drives the need for seamless wireless connectivity in office spaces. |
| RESTRAINTS | • The scarcity of available spectrum can hinder the deployment of new wireless technologies, especially in densely populated areas. • Rapid advancements in technology can lead to concerns about investing in systems that may quickly become outdated. |
Frequently Asked Questions
Ans- Challenges in In-building Wireless Market are
- Rapid advancements in technology can lead to concerns about investing in systems that may quickly become outdated.
- Integrating new wireless technologies with existing systems and infrastructure can pose technical challenges and require extensive planning.
Ans- one main growth factor for the In-building Wireless Market is
- The rapid rollout of 5G technology enables faster data transmission and supports high-bandwidth applications.
Ans- The North America dominated the market and represented significant revenue share in 2023.
Ans- the CAGR of In-building Wireless Market during the forecast period is of 37.51% from 2024-2032.
Ans- Web Real-Time Communication Market was valued at USD 7.3 billion in 2023 and is expected to reach USD 128.2 Billion by 2032, growing at a CAGR of 37.51% from 2024-2032.
Get in Touch
