image

Graphic Film Market Report Scope & Overview:
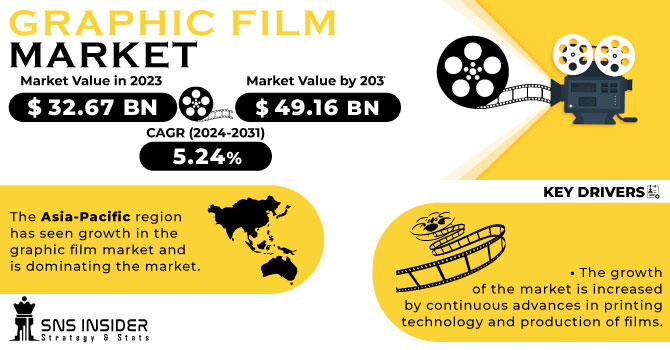
The Graphic Film Market size was USD 31.05 billion in 2022 and is expected to Reach USD 46.58 billion by 2030 and grow at a CAGR of 5.20 % over the forecast period of 2023-2030.

The global graphic film market is a dynamic and growing industry, playing a pivotal role in industries ranging from advertising and automotive to retail and architecture. Graphic film, prized for its adaptability and visual impact, serves as a versatile medium for a wide range of applications, including eye-catching signage, eye-catching vehicle wraps, advertising displays charismatic and transformative interior decoration. The growth trajectory of this market is driven by a combination of factors, underpinned by the growing demand for compelling branding and communication solutions in various industries. As businesses are engaged in the constant battle for consumer attention, graphic film provides an artistic and resonant channel to convey messages, establish brand identity, and nurture lasting impression.

Graphic Film Market Revenue Analysis

Get More Information on Graphic Film Market - Request Sample Report

The technology sector is fundamental in the growth of this market, with advances in printing and film production techniques essential to its story. Digital printing has revolutionized the personalization of graphic films, allowing intricate designs and vivid colors to flourish on these films. At the same time, innovations in adhesive technology have redefined application dynamics, making membranes easier to install and extending service life.

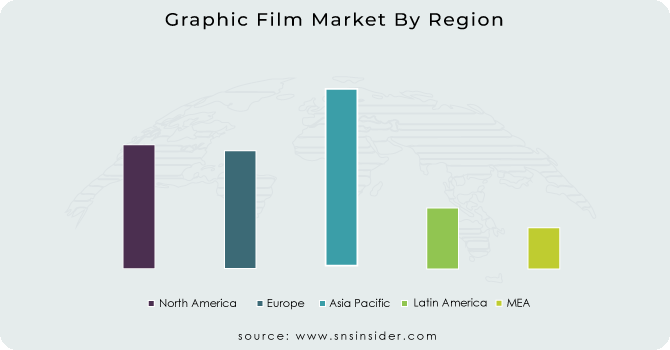
By region, the market landscape has distinct characteristics. The Asia-Pacific region is emerging as a dominant market. The  growth is driven by rapid urbanization, rising consumer spending and the explosive growth of the advertising industry.

North America reflects a second largest but growing graphic film market. Characterized by efficient production capacity and vibrant advertising sectors, countries such as the United States and Canada are emblematic of this phenomenon. Their vibrant economies and vibrant creative industries foster market synergies across industries.

Across the Atlantic, Europe presents a landscape rich in tradition and innovation. Countries like Germany, known for their automotive prowess, use graphic film to amplify the vehicle's aesthetic and marketing appeal. The UK, distinguished by its creative sectors, drives the growing market, integrating graphic films into media and architectural projects. Scandinavia's enthusiasm for sustainability is evident in their interest in eco-friendly graphic film alternatives that align with the region's environmental awareness.

Despite its appeal and potential, the graphic film market is grappling with many challenges. Changing environmental regulations are driving the trend towards sustainable alternatives, catalyzing innovation in compostable and recyclable graphic films. In addition, market participants must skillfully navigate the dynamic consumer preferences and changing technology landscape to maintain their competitive edge. 

MARKET DYNAMICS

KEY DRIVERS:  

  • The growth of the market is increased by continuous advances in printing technology and production of films.

Digital printing allows for complex designs, high-resolution graphics, and customizability, catering to diverse customer preferences and requirements. In addition, advances in adhesive technology have improved ease of installation and durability, expanding the range of surface applications. 

  • Growth in automotive industry.

Graphic films are used in car wraps, graphics and labels which is highly beneficial for the automobile industry.

RESTRAIN:

  • The development and implementation of new technologies costs is higher which can hinder the market

Small businesses can find it difficult to invest in research and development, which limits their ability to keep up with industry trends. 

OPPORTUNITY: 

  • The rise of e-commerce has led to an increased demand for graphic films

Graphic films can play an important role in creating attractive and memorable packaging designs that enhance the customer's unboxing experience. 

  • The growing category of environmentally conscious consumers and businesses can be targeted by the creation of biodegradable or recyclable graphic films.

CHALLENGES:

  • For manufacturers, it is still a challenge to balance costs with quality and innovation

Maintaining competitive pricing while investing in research, development, and sustainable practices can strain profit margins

IMPACT OF RUSSIAN UKRAINE WAR

Russia and Ukraine are major producers of graphic films, and the war has disrupted exports from both countries. This led to a shortage of graphic films in the global market, driving up prices. The war created a need for graphic films for use in packaging and other applications. This increases demand for graphic films and puts upward pressure on prices. The war also has created uncertainty in the graphic films market, making it difficult for businesses to plan for the future. This has led to some businesses delaying or cancelling orders for graphic films, which is further disrupting the market and driving up prices. The price of PET film, a type of graphic film used in packaging, has increased by 30% ar. Since the beginning of the war prices have risen by 20% for BOPP, a further type of graphics film that is included in packaging. In 2023, war in Ukraine is estimated to have a 2.5% impact on the worldwide graphic film market.

IMPACT OF ONGOING RECESSION

The ongoing economic downturn is expected to have a negative impact on the graphic film market. The economic downturn is expected to lead to lower demand for graphic films as businesses and consumers cut back on spending. In addition, the economic downturn is expected to increase the price of graphic film due to increased raw material and energy costs.  In 2023, due to the recession, global demand for graphic film is expected to fall by 2.5%. Businesses and consumers are cutting spending, leading to lower demand for graphic films. This is especially true for non-essential applications, such as advertising and packaging. Due to the increased cost of materials and energy, graphics film prices are projected to rise by 5% in 2023. Raw material and energy costs are rising, leading to higher prices for graphic film. This makes it more expensive to use graphic film for companies, which could lead to a further drop in demand. 

KEY MARKET SEGMENTS

By Polymer

  • PP

  • PVC

  • PE

By Film Type

  • Transparent

  • Opaque

  • Translucent

  • Reflective

By Printing Technology

  • Digital

  • Rotogravure

By End Use

  • Promotional & Advertisement

  • Industrial

  • Automotive

Graphic Film Market Segmentation Analysis

Get Customized Report as per Your Business Requirement - Request For Customized Report

REGIONAL ANALYSIS

The Asia-Pacific region has seen growth in the graphic film market and is dominating the market. This growth can be attributed to a number of factors, including rapid urbanization, growing consumer spending, and a growing advertising industry. Countries like China, Japan, Korea and India have become the main players in this market.

The North American graphic film market is mature and established. It is driven by factors such as advanced manufacturing capabilities, a strong advertising and media industry, and a developed retail sector.

Europe also has a growing graphic film market, with varying demand across different countries. The European market is driven by factors such as a strong manufacturing base, robust retail industry, and a focus on sustainability.

REGIONAL COVERAGE:

North America

  • US

  • Canada

  • Mexico

Europe

  • Eastern Europe

    • Poland

    • Romania

    • Hungary

    • Turkey

    • Rest of Eastern Europe

  • Western Europe

    • Germany

    • France

    • UK

    • Italy

    • Spain

    • Netherlands

    • Switzerland

    • Austria

    • Rest of Western Europe

Asia Pacific

  • China

  • India

  • Japan

  • South Korea

  • Vietnam

  • Singapore

  • Australia

  • Rest of Asia Pacific

Middle East & Africa

  • Middle East

    • UAE

    • Egypt

    • Saudi Arabia

    • Qatar

    • Rest of Middle East

  • Africa

    • Nigeria

    • South Africa

    • Rest of Africa

Latin America

  • Brazil

  • Argentina

  • Colombia

  • Rest of Latin America   

Key Players

Some major key players in the Graphic Film market are 3M Company, KPMF Limited, Constantia Flexibles, Arlon Graphics LLC, Aura Graphics Limited, Drytac Corporation, The Griff Network, Charter NEX, Avery Dennison Corporation, Innovia Films and other players.

Constantia Flexibles-Company Financial Analysis

Company Landscape Analysis

RECENT DEVELOPMENT

  • A new communication campaign is announced by Innovia Films, the world leader in polypropylene film production, that highlights its commitment to producing sustainable and recycled material for use on consumer packaging, labels and graphics films.

  • In Europe, ProAmpac is introducing a new PE recyclable film packaging.

Graphic Film Market Report Scope:
Report Attributes Details
Market Size in 2022  US$ 31.05 Bn
Market Size by 2030  US$ 46.58 Bn
CAGR   CAGR of 5.20 % From 2023 to 2030
Base Year 2022
Forecast Period  2023-2030
Historical Data  2019-2021
Report Scope & Coverage Market Size, Segments Analysis, Competitive  Landscape, Regional Analysis, DROC & SWOT Analysis, Forecast Outlook
Key Segments • By Polymer (PP, PVC, PE)
• By Film Type (Transparent, Opaque, Translucent, Reflective)
• By Printing Technology (Digital, Rotogravure)
• By End Use (Promotional & Advertisement, Industrial, Automotive)
Regional Analysis/Coverage North America (US, Canada, Mexico), Europe (Eastern Europe [Poland, Romania, Hungary, Turkey, Rest of Eastern Europe] Western Europe] Germany, France, UK, Italy, Spain, Netherlands, Switzerland, Austria, Rest of Western Europe]), Asia Pacific (China, India, Japan, South Korea, Vietnam, Singapore, Australia, Rest of Asia Pacific), Middle East & Africa (Middle East [UAE, Egypt, Saudi Arabia, Qatar, Rest of Middle East], Africa [Nigeria, South Africa, Rest of Africa], Latin America (Brazil, Argentina, Colombia Rest of Latin America)
Company Profiles 3M Company, KPMF Limited, Constantia Flexibles, Arlon Graphics LLC, Aura Graphics Limited, Drytac Corporation, The Griff Network, Charter NEX, Avery Dennison Corporation, Innovia Films 
Key Drivers • The growth of the market is increased by continuous advances in printing technology and production of films.
• Growth in automotive industry.
Market Challenges • For manufacturers, it is still a challenge to balance costs with quality and innovation


Frequently Asked Questions

Ans. The Compound Annual Growth rate for Graphic Film Market over the forecast period is 5.20 %.

Ans. USD 46.58 Billion is the projected Graphic Film Market Film Type of market by 2030.

Ans. The major key players are 3M Company, Constantia Flexibles, Avery Dennison Corporation, Innovia Films.

Ans. Asia Pacific is the dominating and the fastest growing region of the Graphic Film Market.

Ans. The growth of the market is increased by continuous advances in printing technology and production of films.

TABLE OF CONTENT

1. Introduction
1.1 Market Definition
1.2 Scope
1.3 Research Assumptions

2. Research Methodology

3. Market Dynamics
3.1 Drivers
3.2 Restraints
3.3 Opportunities
3.4 Challenges

4. Impact Analysis
4.1 Impact of the Russia-Ukraine War
4.2 Impact of Ongoing Recession
4.2.1 Introduction
4.2.2 Impact on major economies
4.2.2.1 US
4.2.2.2 Canada
4.2.2.3 Germany
4.2.2.4 France
4.2.2.5 United Kingdom
4.2.2.6 China
4.2.2.7 Japan
4.2.2.8 South Korea
4.2.2.9 Rest of the World
4.3 Supply Demand Gap Analysis

5. Value Chain Analysis

6. Porter’s 5 forces model

7. PEST Analysis

8. Graphic Film Market Segmentation, by Polymer
8.1 PP
8.2 PVC
8.3 PE

9. Graphic Film Market Segmentation, by Film Type
9.1 Transparent
9.2 Opaque
9.3 Translucent
9.4 Reflective

10. Graphic Film Market Segmentation, by Printing Technology
10.1 Digital
10.2 Rotogravure

11. Graphic Film Market Segmentation, by End Use
11.1 Promotional & Advertisement
11.2 Industrial
11.3 Automotive

12. Regional Analysis
12.1 Introduction
12.2 North America
12.2.1 North America Graphic Film Market by Country
12.2.2North America Graphic Film Market by Polymer
12.2.3 North America Graphic Film Market by Film Type
12.2.4 North America Graphic Film Market by Printing Technology
12.2.5 North America Graphic Film Market by End Use
12.2.6 USA
12.2.6.1 USA Graphic Film Market by Polymer
12.2.6.2 USA Graphic Film Market by Film Type
12.2.6.3 USA Graphic Film Market by Printing Technology
12.2.6.4 USA Graphic Film Market by End Use
12.2.7 Canada
12.2.7.1 Canada Graphic Film Market by Polymer
12.2.7.2 Canada Graphic Film Market by Film Type
12.2.7.3 Canada Graphic Film Market by Printing Technology
12.2.7.4 Canada Graphic Film Market by End Use
12.2.8 Mexico
12.2.8.1 Mexico Graphic Film Market by Raw Printing Technology
12.2.8.2 Mexico Graphic Film Market by Film Type
12.2.8.3 Mexico Graphic Film Market by Printing Technology
12.2.8.4 Mexico Graphic Film Market by End Use
12.3 Europe
12.3.1 Eastern Europe
12.3.1.1 Eastern Europe Graphic Film Market by Country
12.3.1.2 Eastern Europe Graphic Film Market by Polymer
12.3.1.3 Eastern Europe Graphic Film Market by Film Type
12.3.1.4 Eastern Europe Graphic Film Market by Printing Technology
12.3.1.5 Eastern Europe Graphic Film Market by End Use
12.3.1.6 Poland
12.3.1.6.1 Poland Graphic Film Market by Polymer
12.3.1.6.2 Poland Graphic Film Market by Film Type
12.3.1.6.3 Poland Graphic Film Market by Printing Technology
12.3.1.6.4 Poland Graphic Film Market by End Use
12.3.1.7 Romania
12.3.1.7.1 Romania Graphic Film Market by Polymer
12.3.1.7.2 Romania Graphic Film Market by Film Type
12.3.1.7.3 Romania Graphic Film Market by Printing Technology
12.3.1.7.4 Romania Graphic Film Market by End Use
12.3.1.8 Hungary
12.3.1.8.1 Hungary Graphic Film Market by Polymer
12.3.1.8.2 Hungary Graphic Film Market by Film Type
12.3.1.8.3 Hungary Graphic Film Market by Printing Technology
12.3.1.8.4 Hungary Graphic Film Market by End Use
12.3.1.9 Turkey
12.3.1.9.1 Turkey Graphic Film Market by Polymer
12.3.1.9.2 Turkey Graphic Film Market by Film Type
12.3.1.9.3 Turkey Graphic Film Market by Printing Technology
12.3.1.9.4 Turkey Graphic Film Market by End Use
12.3.1.10 Rest of Eastern Europe
12.3.1.10.1 Rest of Eastern Europe Graphic Film Market by Polymer
12.3.1.10.2 Rest of Eastern Europe Graphic Film Market by Film Type
12.3.1.10.3 Rest of Eastern Europe Graphic Film Market by Printing Technology
12.3.1.10.4 Rest of Eastern Europe Graphic Film Market by End Use
12.3.2 Western Europe
12.3.2.1 Western Europe Graphic Film Market by Country
12.3.2.2 Western Europe Graphic Film Market by Polymer
12.3.2.3 Western Europe Graphic Film Market by Film Type
12.3.2.4 Western Europe Graphic Film Market by Printing Technology
12.3.2.5 Western Europe Graphic Film Market by End Use
12.3.2.6 Germany
12.3.2.6.1 Germany Graphic Film Market by Polymer
12.3.2.6.2 Germany Graphic Film Market by Film Type
12.3.2.6.3 Germany Graphic Film Market by Printing Technology
12.3.2.6.4 Germany Graphic Film Market by End Use
12.3.2.7 France
12.3.2.7.1 France Graphic Film Market by Polymer
12.3.2.7.2 France Graphic Film Market by Film Type
12.3.2.7.3 France Graphic Film Market by Printing Technology
12.3.2.7.4 France Graphic Film Market by End Use
12.3.2.8 UK
12.3.2.8.1 UK Graphic Film Market by Polymer
12.3.2.8.2 UK Graphic Film Market by Film Type
12.3.2.8.3 UK Graphic Film Market by Printing Technology
12.3.2.8.4 UK Graphic Film Market by End Use
12.3.2.9 Italy
12.3.2.9.1 Italy Graphic Film Market by Polymer
12.3.2.9.2 Italy Graphic Film Market by Film Type
12.3.2.9.3 Italy Graphic Film Market by Printing Technology
12.3.2.9.4 Italy Graphic Film Market by End Use
12.3.2.10 Spain
12.3.2.10.1 Spain Graphic Film Market by Polymer
12.3.2.10.2 Spain Graphic Film Market by Film Type
12.3.2.10.3 Spain Graphic Film Market by Printing Technology
12.3.2.10.4 Spain Graphic Film Market by End Use
12.3.2.11 Netherlands
12.3.2.11.1 Netherlands Graphic Film Market by Polymer
12.3.2.11.2 Netherlands Graphic Film Market by Film Type
12.3.2.11.3 Netherlands Graphic Film Market by Printing Technology
12.3.2.11.4 Netherlands Graphic Film Market by End Use
12.3.2.12 Switzerland
12.3.2.12.1 Switzerland Graphic Film Market by Polymer
12.3.2.12.2 Switzerland Graphic Film Market by Film Type
12.3.2.12.3 Switzerland Graphic Film Market by Printing Technology
12.3.2.12.4 Switzerland Graphic Film Market by End Use
12.3.2.13 Austria
12.3.2.13.1 Austria Graphic Film Market by Polymer
12.3.2.13.2 Austria Graphic Film Market by Film Type
12.3.2.13.3 Austria Graphic Film Market by Printing Technology
12.3.2.13.4 Austria Graphic Film Market by End Use
12.3.2.14 Rest of Western Europe
12.3.2.14.1 Rest of Western Europe Graphic Film Market by Polymer
12.3.2.14.2 Rest of Western Europe Graphic Film Market by Film Type
12.3.2.14.3 Rest of Western Europe Graphic Film Market by Printing Technology
12.3.2.14.4 Rest of Western Europe Graphic Film Market by End Use
12.4 Asia-Pacific
12.4.1 Asia Pacific Graphic Film Market by Country
12.4.2 Asia Pacific Graphic Film Market by Polymer
12.4.3 Asia Pacific Graphic Film Market by Film Type
12.4.4 Asia Pacific Graphic Film Market by Printing Technology
12.4.5 Asia Pacific Graphic Film Market by End Use
12.4.6 China
12.4.6.1 China Graphic Film Market by Polymer
12.4.6.2 China Graphic Film Market by Film Type
12.4.6.3 China Graphic Film Market by Printing Technology
12.4.6.4 China Graphic Film Market by End Use
12.4.7 India
12.4.7.1 India Graphic Film Market by Polymer
12.4.7.2 India Graphic Film Market by Film Type
12.4.7.3 India Graphic Film Market by Printing Technology
12.4.7.4 India Graphic Film Market by End Use
12.4.8 Japan
12.4.8.1 Japan Graphic Film Market by Polymer
12.4.8.2 Japan Graphic Film Market by Film Type
12.4.8.3 Japan Graphic Film Market by Printing Technology
12.4.8.4 Japan Graphic Film Market by End Use
12.4.9 South Korea
12.4.9.1 South Korea Graphic Film Market by Polymer
12.4.9.2 South Korea Graphic Film Market by Film Type
12.4.9.3 South Korea Graphic Film Market by Printing Technology
12.4.9.4 South Korea Graphic Film Market by End Use
12.4.10 Vietnam
12.4.10.1 Vietnam Graphic Film Market by Polymer
12.4.10.2 Vietnam Graphic Film Market by Film Type
12.4.10.3 Vietnam Graphic Film Market by Printing Technology
12.4.10.4 Vietnam Graphic Film Market by End Use
12.4.11 Singapore
12.4.11.1 Singapore Graphic Film Market by Polymer
12.4.11.2 Singapore Graphic Film Market by Film Type
12.4.11.3 Singapore Graphic Film Market by Printing Technology
12.4.11.4 Singapore Graphic Film Market by End Use
12.4.12 Australia
12.4.12.1 Australia Graphic Film Market by Polymer
12.4.12.2 Australia Graphic Film Market by Film Type
12.4.12.3 Australia Graphic Film Market by Printing Technology
12.4.12.4 Australia Graphic Film Market by End Use
12.4.13 Rest of Asia-Pacific
12.4.13.1 Rest of Asia-Pacific Graphic Film Market by Polymer
12.4.13.2 Rest of Asia-Pacific APAC Graphic Film Market by Film Type
12.4.13.3 Rest of Asia-Pacific Graphic Film Market by Printing Technology
12.4.13.4 Rest of Asia-Pacific Graphic Film Market by End Use
12.5 Middle East & Africa
12.5.1 Middle East
12.5.1.1 Middle East Graphic Film Market by country
12.5.1.2 Middle East Graphic Film Market by Polymer
12.5.1.3 Middle East Graphic Film Market by Film Type
12.5.1.4 Middle East Graphic Film Market by Printing Technology
12.5.1.5 Middle East Graphic Film Market by End Use
12.5.1.6 UAE
12.5.1.6.1 UAE Graphic Film Market by Polymer
12.5.1.6.2 UAE Graphic Film Market by Film Type
12.5.1.6.3 UAE Graphic Film Market by Printing Technology
12.5.1.6.4 UAE Graphic Film Market by End Use
12.5.1.7 Egypt
12.5.1.7.1 Egypt Graphic Film Market by Polymer
12.5.1.7.2 Egypt Graphic Film Market by Film Type
12.5.1.7.3 Egypt Graphic Film Market by Printing Technology
12.5.1.7.4 Egypt Graphic Film Market by End Use
12.5.1.8 Saudi Arabia
12.5.1.8.1 Saudi Arabia Graphic Film Market by Polymer
12.5.1.8.2 Saudi Arabia Graphic Film Market by Film Type
12.5.1.8.3 Saudi Arabia Graphic Film Market by Printing Technology
12.5.1.8.4 Saudi Arabia Graphic Film Market by End Use
12.5.1.9 Qatar
12.5.1.9.1 Qatar Graphic Film Market by Polymer
12.5.1.9.2 Qatar Graphic Film Market by Film Type
12.5.1.9.3 Qatar Graphic Film Market by Printing Technology
12.5.1.9.4 Qatar Graphic Film Market by End Use
12.5.1.10 Rest of Middle East
12.5.1.10.1 Rest of Middle East Graphic Film Market by Polymer
12.5.1.10.2 Rest of Middle East Graphic Film Market by Film Type
12.5.1.10.3 Rest of Middle East Graphic Film Market by Printing Technology
12.5.1.10.4 Rest of Middle East Graphic Film Market by End Use
12.5.2. Africa
12.5.2.1 Africa Graphic Film Market by country
12.5.2.2 Africa Graphic Film Market by Polymer
12.5.2.3 Africa Graphic Film Market by Film Type
12.5.2.4 Africa Graphic Film Market by Printing Technology
12.5.2.5 Africa Graphic Film Market by End Use
12.5.2.6 Nigeria
12.5.2.6.1 Nigeria Graphic Film Market by Polymer
12.5.2.6.2 Nigeria Graphic Film Market by Film Type
12.5.2.6.3 Nigeria Graphic Film Market by Printing Technology
12.5.2.6.4 Nigeria Graphic Film Market by End Use
12.5.2.7 South Africa
12.5.2.7.1 South Africa Graphic Film Market by Polymer
12.5.2.7.2 South Africa Graphic Film Market by Film Type
12.5.2.7.3 South Africa Graphic Film Market by Printing Technology
12.5.2.7.4 South Africa Graphic Film Market by End Use
12.5.2.8 Rest of Africa
12.5.2.8.1 Rest of Africa Graphic Film Market by Polymer
12.5.2.8.2 Rest of Africa Graphic Film Market by Film Type
12.5.2.8.3 Rest of Africa Graphic Film Market by Printing Technology
12.5.2.8.4 Rest of Africa Graphic Film Market by End Use
12.6. Latin America
12.6.1 Latin America Graphic Film Market by country
12.6.2 Latin America Graphic Film Market by Polymer
12.6.3 Latin America Graphic Film Market by Film Type
12.6.4 Latin America Graphic Film Market by Printing Technology
12.6.5 Latin America Graphic Film Market by End Use
12.6.6 Brazil
12.6.6.1 Brazil Graphic Film Market by Polymer
12.6.6.2 Brazil Graphic Film Market by Film Type
12.6.6.3 Brazil Graphic Film Market by Printing Technology
12.6.6.4 Brazil Graphic Film Market by End Use
12.6.7 Argentina
12.6.7.1 Argentina Graphic Film Market by Polymer
12.6.7.2 Argentina Graphic Film Market by Film Type
12.6.7.3 Argentina Graphic Film Market by Printing Technology
12.6.7.4 Argentina Graphic Film Market by End Use
12.6.8 Colombia
12.6.8.1 Colombia Graphic Film Market by Polymer
12.6.8.2 Colombia Graphic Film Market by Film Type
12.6.8.3 Colombia Graphic Film Market by Printing Technology
12.6.8.4 Colombia Graphic Film Market by End Use
12.6.9 Rest of Latin America
12.6.9.1 Rest of Latin America Graphic Film Market by Polymer
12.6.9.2 Rest of Latin America Graphic Film Market by Film Type
12.6.9.3 Rest of Latin America Graphic Film Market by Printing Technology
12.6.9.4 Rest of Latin America Graphic Film Market by End Use

13 Company Profile
13.1 3M Company
13.1.1 Company Overview
13.1.2 Financials
13.1.3 Product/ Services Offered
13.1.4 SWOT Analysis
13.1.5 The SNS View
13.2 KPMF Limited
13.2.1 Company Overview
13.2.2 Financials
13.2.3 Product/ Services Offered
13.2.4 SWOT Analysis
13.2.5 The SNS View
13.3 Constantia Flexibles
13.3.1 Company Overview
13.3.2 Financials
13.3.3 Product/ Services Offered
13.3.4 SWOT Analysis
13.3.5 The SNS View
13.4 Arlon Graphics LLC
13.4 Company Overview
13.4.2 Financials
13.4.3 Product/ Services Offered
13.4.4 SWOT Analysis
13.4.5 The SNS View
13.5 Aura Graphics Limited
13.5.1 Company Overview
13.5.2 Financials
13.5.3 Product/ Services Offered
13.5.4 SWOT Analysis
13.5.5 The SNS View
13.6 Drytac Corporation
13.6.1 Company Overview
13.6.2 Financials
13.6.3 Product/ Services Offered
13.6.4 SWOT Analysis
13.6.5 The SNS View
13.7 The Griff Network
13.7.1 Company Overview
13.7.2 Financials
13.7.3 Product/ Services Offered
13.7.4 SWOT Analysis
13.7.5 The SNS View
13.8 Charter NEX
13.8.1 Company Overview
13.8.2 Financials
13.8.3 Product/ Services Offered
13.8.4 SWOT Analysis
13.8.5 The SNS View
13.9 Avery Dennison Corporation
13.9.1 Company Overview
13.9.2 Financials
13.9.3 Product/Services Offered
13.9.4 SWOT Analysis
13.9.5 The SNS View
13.10 Innovia Films
13.10.1 Company Overview
13.10.2 Financials
13.10.3 Product/Services Offered
13.10.4 SWOT Analysis
13.10.5 The SNS View

14. Competitive Landscape
14.1 Competitive Bench marking
14.2 Market Share Analysis
14.3 Recent Developments
14.3.1 Industry News
14.3.2 Company News
14.3.3 Mergers & Acquisitions

15. USE Cases and Best Practices

16. Conclusion

An accurate research report requires proper strategizing as well as implementation. There are multiple factors involved in the completion of good and accurate research report and selecting the best methodology to compete the research is the toughest part. Since the research reports we provide play a crucial role in any company’s decision-making process, therefore we at SNS Insider always believe that we should choose the best method which gives us results closer to reality. This allows us to reach at a stage wherein we can provide our clients best and accurate investment to output ratio.

Each report that we prepare takes a timeframe of 350-400 business hours for production. Starting from the selection of titles through a couple of in-depth brain storming session to the final QC process before uploading our titles on our website we dedicate around 350 working hours. The titles are selected based on their current market cap and the foreseen CAGR and growth.


The 5 steps process:

Step 1: Secondary Research:

Secondary Research or Desk Research is as the name suggests is a research process wherein, we collect data through the readily available information. In this process we use various paid and unpaid databases which our team has access to and gather data through the same. This includes examining of listed companies’ annual reports, Journals, SEC filling etc. Apart from this our team has access to various associations across the globe across different industries. Lastly, we have exchange relationships with various university as well as individual libraries.

Secondary Research

Step 2: Primary Research

When we talk about primary research, it is a type of study in which the researchers collect relevant data samples directly, rather than relying on previously collected data.  This type of research is focused on gaining content specific facts that can be sued to solve specific problems. Since the collected data is fresh and first hand therefore it makes the study more accurate and genuine.

We at SNS Insider have divided Primary Research into 2 parts.

Part 1 wherein we interview the KOLs of major players as well as the upcoming ones across various geographic regions. This allows us to have their view over the market scenario and acts as an important tool to come closer to the accurate market numbers. As many as 45 paid and unpaid primary interviews are taken from both the demand and supply side of the industry to make sure we land at an accurate judgement and analysis of the market.

This step involves the triangulation of data wherein our team analyses the interview transcripts, online survey responses and observation of on filed participants. The below mentioned chart should give a better understanding of the part 1 of the primary interview.

Primary Research

Part 2: In this part of primary research the data collected via secondary research and the part 1 of the primary research is validated with the interviews from individual consultants and subject matter experts.

Consultants are those set of people who have at least 12 years of experience and expertise within the industry whereas Subject Matter Experts are those with at least 15 years of experience behind their back within the same space. The data with the help of two main processes i.e., FGDs (Focused Group Discussions) and IDs (Individual Discussions). This gives us a 3rd party nonbiased primary view of the market scenario making it a more dependable one while collation of the data pointers.

Step 3: Data Bank Validation

Once all the information is collected via primary and secondary sources, we run that information for data validation. At our intelligence centre our research heads track a lot of information related to the market which includes the quarterly reports, the daily stock prices, and other relevant information. Our data bank server gets updated every fortnight and that is how the information which we collected using our primary and secondary information is revalidated in real time.

Data Bank Validation

Step 4: QA/QC Process

After all the data collection and validation our team does a final level of quality check and quality assurance to get rid of any unwanted or undesired mistakes. This might include but not limited to getting rid of the any typos, duplication of numbers or missing of any important information. The people involved in this process include technical content writers, research heads and graphics people. Once this process is completed the title gets uploader on our platform for our clients to read it.

Step 5: Final QC/QA Process:

This is the last process and comes when the client has ordered the study. In this process a final QA/QC is done before the study is emailed to the client. Since we believe in giving our clients a good experience of our research studies, therefore, to make sure that we do not lack at our end in any way humanly possible we do a final round of quality check and then dispatch the study to the client.

Start a Conversation

Hi! Click one of our member below to chat on Phone