image

Green Electronics Manufacturing Market Size, Share, and By Material Type (Recycled Plastics, Bio-based Polymers, Lead-free Solders, Halogen-free Laminates and Low-VOC Adhesives), Technology (Energy-Efficient Manufacturing, Additive Manufacturing (3D printing), Printed Electronics, Eco-friendly PCB Manufacturing and Waste Heat Recovery Systems), Application (Energy-Efficient Consumer Devices, Solar-Powered Systems, E-Waste Minimization Solutions, Smart Energy Management, and Low Power IoT Devices), Certification/Compliance (RoHS (Restriction of Hazardous Substances), WEEE (Waste Electrical and Electronic Equipment), ENERGY STAR Rated, EPEAT Certified Products and ISO 14001 Compliant Manufacturers) and Region | Global Forecast 2025-2032

Date: July 2025 Report Code: SNS/SEMI/7853 Page 300

Green Electronics Manufacturing Market Report Scope & Overview:

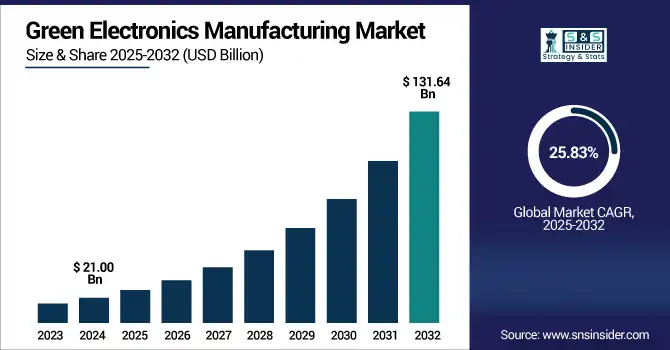
The Green Electronics Manufacturing Market size was valued at USD 21.00 billion in 2024 and is expected to reach USD 131.64 billion by 2032, growing at a CAGR of 25.83% over the forecast period of 2025-2032.

Green Electronics Manufacturing Market Trends are driven by rising adoption of eco-friendly materials, energy-efficient technologies, and circular economy practices. Manufacturers increasingly focus on recyclable designs and compliance with global environmental standards.

The growth of Green Electronics Manufacturing Market in production is further propelled by rising government incentives to ensure sustainability during production, advanced green semiconductor technologies and faster developments in AI and automation to integrate energy optimized manufacturing lines. Moreover, the rise in corporate ESG commitments, demand for low-carbon supply chains, and the shift towards modular and repairable electronic products are driving manufacturers to adopt greener processes to meet both regulatory and consumer expectations.

In 2024, the U.S. Department of Energy allocated USD 70 million through the Advanced Manufacturing Office to support energy-efficient and sustainable electronics production projects.

The U.S Green Electronics Manufacturing Market size was valued at USD 4.09 billion in 2024 and is expected to reach USD 25.06 billion by 2032, growing at a CAGR of 25.46% over the forecast period of 2025-2032. U.S. Green Electronics Manufacturing Market growth is accelerated by robust federal incentives, CG-inspired corporate investments, soaring consumer demand for sustainable technology, and developments in efficient and recyclable electronic production processes.

Market Dynamics:

Drivers:

  • Regulations Consumer Awareness and Green Innovations Accelerate Global Adoption of Sustainable Electronics Manufacturing Practices

Increase in regulatory pressure to reduce environmental impact, including RoHS, WEEE, and ENERGY STAR mandates, primarily drives the global Green Electronics Manufacturing Market. Increased consumer awareness towards e-waste and demand for sustainable and energy-efficient products are encouraging manufacturers to follow eco-friendly practices. Moreover, technological breakthrough of green materials based on recycled plastics or lead-free solders or bio-based polymers with energy-optimized manufacturing systems will further hasten through market penetration at high pace with multiple applications in consumer electronics along with automotive and industrial sectors.

Samsung integrated recycled ocean-bound plastics into over 50% of its smartphone components in 2024, aiming to expand this initiative across all product lines by 2026.

Restraints:

  • Fragmented Standards and Limited Access Hinder Global Progress in Green Electronics Manufacturing Adoption

Lack of global harmonization of standards and certification schemes is one of the key restraints in the Green Electronics Manufacturing Market as it leads to inconsistency in terms of the compliance of Global climatic regulations. Manufacturers are thus unable to cut across fragmented land and maximize sustainability practices through their global supply chain strips. While lack of green materials and technologies accessibility in developing nations inhibits the large scale practice of environmental friendly process.

Opportunities:

  • Emerging Markets and Smart Technologies Fuel the Next Wave of Growth in Green Electronics Manufacturing

High growth potential in emerging economies across Asia Pacific and Latin America will drive demand for the product owing to the rapid industrialization, environmental policy reform initiatives and market adoption of the product. In addition, the shift towards modular and easily repairable product design, the integration of AI for efficiency and reducing emissions, and the increasing demand for solar powered and low-power IoT devices, are all significant growth markets.

Brazil introduced new e-waste management regulations under its National Solid Waste Policy in 2024, mandating manufacturers to increase product take-back and recycling mechanisms.

Challenges:

  • Overcoming Design Challenges and Awareness Gaps to Advance the Future of Green Electronics Globally

The major challenge is the technical complexity of designing green electronics that can perform well and are also durable while being less harmful for the environment. However, these goals are still hard to reach recyclability and modularity are achieved at the sacrifice of functionality. In addition, certain markets have low consumer awareness of the benefits of green electronics, which limits demand, and logistical issues in product take-back and recycling systems prevent the creation of a circular economy.

Segmentation Analysis:

By Material Type

Lead-free solders accounted for the largest share of 35.1% of the Green Electronics Manufacturing Market in 2024. The extensive adoption of these elements can be mainly seen in their high dependence on rigorous global environmental regulations such as RoHS, where the hazardous materials in electronic components are restricted such as lead. Lead-free solders, the new standard for consumer and industrial electronics, provide better health and environmental profile while maintaining electrical performance and reliability.

Bio-based polymers are expected to see the highest CAGR between 2025 and 2032. They are increasingly being adopted due to a growing demand for biodegradable, low-toxicity substitutes to petroleum-based plastics. Biosourced plastics are becoming more prominent in consumer electronics with increasing innovation in bio-resins and sustainable packaging that holds promise for meaningful steps to fully recyclable product designs.
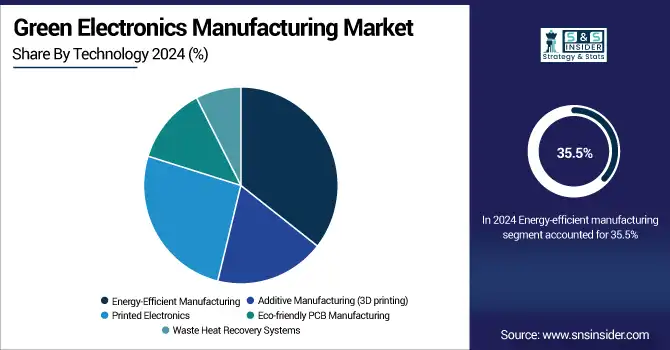
By Technology

The energy-efficient manufacturing segment led the green electronics manufacturing market in 2024, accounting for 35.5% of the market share. This dominance owes to the increasing adoption of smart factory systems, AI-based energy optimization, and demand for low carbon footprints for electronics manufacturing. Manufacturers are implementing energy-efficient machinery and cleanroom conformances to address the environmental regulations while minimizing operational energy usage across consumer electronics, industrial and automotive sectors.

Additive manufacturing (3D printing) is expected to have the highest CAGR between 2025 and 2032. Its potential to reduce material waste, number of production steps, and develop lightweight and customizable components has fueled this growth. With green design taking precedence, 3D printing has become the ideal sustainable prototyping and small-batch electronic product manufacturing solution for eco-friendly electronics.

By Application

Energy-efficient consumer devices dominating the segment with 36.7% in 2024. As the demand for sustainable home devices, smartphones, laptops and wearables increases, manufacturers are forced by these social developments to design products with energy conservation built in. Government-backed labeling programs, such as ENERGY STAR, and the increasing consumer awareness have increased brand competition in making devices that consume less power while providing the same level of performance and functionality.

The low power IoT devices are predicted to grow at the highest CAGR during the period between 2025–2032. The rise is powered by rising adoption in smart homes, agragriculture, healthcare, and industrial monitoring. They are designed to run with ultra-low power, usually using energy harvesting or solar power, and may meet sustainability goals for the next generation of connected ecosystems.

By Certification/Compliance

RoHS (Restriction of Hazardous Substances) was the leading segment in the Green Electronics Manufacturing Market in 2024, accounting for 33.5% share. This is the reason behind its supremacy, following widespread RoHS-compliant laws and penalties in Europe, North America and various regions in Asia. The regulation introduced is having become one of the major standards for phasing out substances such as lead, cadmium and mercury from electronic products so manufacturers are redesigned components and materials to achieve compliance.

EPEAT certified products are anticipated to experience the highest growth rate from 2025 to 2032. EPEAT focuses on the environmental performance of a product over its whole lifecycle, such as energy efficacy, recyclability and use of environmentally sound materials. This certification has witnessed rapid growth globally, driven by the increasing adoption of ESG frameworks by enterprises and the growing preference of institutional buyers for certified green products.

Regional Analysis:

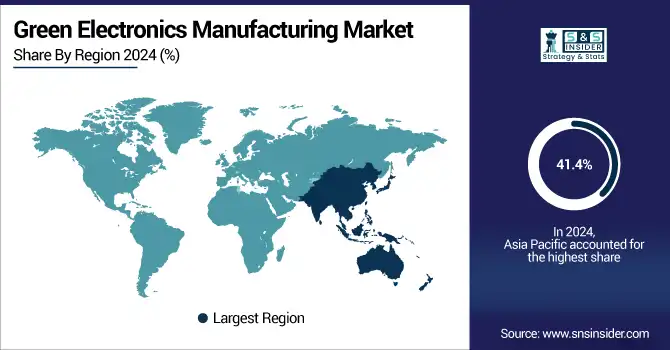
Asia Pacific held 41.4% of the global Green Electronics Manufacturing Market share in 2024, and it is anticipated to register the highest CAGR from 2025 to 2032, Electronics manufacturing ecosystems, a favorable environmental regulation, and investment in green technologies across China, Japan, South Korea, and India this is driving the growth. Supportive mass-producing facilities, governmental drive for sustainable solutions, and an increasing pool of eco-conscious consumers create a ripe growing environment for the region. Also, global green standards are also being set along these lines by manufacturers by increasingly adopting different energy efficient and low emission manufacturing processes.

The economics for China remained unrivaled in Asia Pacific with its large-scale production of electronics and green policies adhering to stringent standards with swift investments in sustainable technologies.

North America is attributed the major stakeholder in the Green Electronics Manufacturing Market owning to strong regulatory mechanisms, high consumer cognizance, and extensive corporate investment in sustainability. Green manufacturing is being increasingly adopted due to pressure from large technology companies that are now aggressively going after carbon neutral and ESG efforts. Policy support for green electronics development has been backed by large government initiatives, such as the Inflation Reduction Act, and a patch work of state-level e-waste recycling laws across the United States. Furthermore, there was also growth for ENERGY STAR qualified equipment, modular product architecture, and low-power IoT technology in the area. The United States and Canada ranked highest in green technology production and innovation in the region.

Europe is at the forefront for advocating the manufacture of sustainable electronics due to the detailed regulations, including RoHS, WEEE and Ecodesign Directive. The area is focused on circular economy principles — including eco-design/ recyclability/ longevity of use. More and more manufacturers are utilizing green materials, energy efficient production methods, modular designs, and other sustainable manufacturing practices. Innovation around green technologies is driven by government funding and compliance standards. Germany, France, and the Netherlands are leading the pack in harmonising complementary action on the industry and policy-level to cut the overall electronics footprint.

The green electronics manufacturing market in Brazil and the Middle East & Africa are among the emerging markets as concerns related to the environment and global warming push the nations to cross the green electronics production path with the support of regulatory reforms and international partnerships. Nations such as Brazil, UAE, United Arab Emirates, and South Africa are implementing sustainable infrastructure and encouraging electronics production with eco-friendly practices.

Key Players:

The Paper-Thin Displays (PTDs) companies are Apple, Samsung, Panasonic, Sony, HP, Dell, Lenovo, LG, Intel, Acer, ASUS, Microsoft, Toshiba, Fujitsu, Sharp, Nokia, Cisco, Xiaomi, Siemens, Epson and others.

Recent Developments:

  • In July 2025, Apple inked a USD 500 million multi-year deal with MP Materials to build a U.S. rare‑earth magnet production and recycling facility combining Texas manufacturing with new California recycling lines ensuring 100% recycled magnets in its devices and strengthening domestic clean-supply chains.

  • In May 2024, Samsung moblie Galaxy S25 won the 2025 ReMA Design for Recycling® Award, using recycled cobalt in batteries and integrating at least one recycled material in every external component and packaging.

Green Electronics Manufacturing Market Report Scope:

Report Attributes Details
Market Size in 2024 USD 21.00 Billion
Market Size by 2032 USD 131.64 Billon
CAGR CAGR of 25.83% From 2025 to 2032
Base Year 2024
Forecast Period 2025-2032
Historical Data 2021-2023
Report Scope & Coverage Market Size, Segments Analysis, Competitive  Landscape, Regional Analysis, DROC & SWOT Analysis, Forecast Outlook
Key Segments • By Material Type (Recycled Plastics, Bio-based Polymers, Lead-free Solders, Halogen-free Laminates and Low-VOC Adhesives)
• By Technology (Energy-Efficient Manufacturing, Additive Manufacturing (3D printing), Printed Electronics, Eco-friendly PCB Manufacturing and Waste Heat Recovery Systems)
• By Application (Energy-Efficient Consumer Devices, Solar-Powered Systems, E-Waste Minimization Solutions, Smart Energy Management, and Low Power IoT Devices)
• By Certification/Compliance (RoHS (Restriction of Hazardous Substances), WEEE (Waste Electrical and Electronic Equipment), ENERGY STAR Rated, EPEAT Certified Products and ISO 14001 Compliant Manufacturers)
Regional Analysis/Coverage North America (US, Canada), Europe (Germany, UK, France, Italy, Spain, Russia, Poland, Rest of Europe), Asia Pacific (China, India, Japan, South Korea, Australia, ASEAN Countries, Rest of Asia Pacific), Middle East & Africa (UAE, Saudi Arabia, Qatar, South Africa, Rest of Middle East & Africa), Latin America (Brazil, Argentina, Mexico, Colombia, Rest of Latin America).
Company Profiles Apple, Samsung, Panasonic, Sony, HP, Dell, Lenovo, LG, Intel, Acer, ASUS, Microsoft, Toshiba, Fujitsu, Sharp, Nokia, Cisco, Xiaomi, Siemens, and Epson.

Frequently Asked Questions

Ans: The Green Electronics Manufacturing Market is expected to grow at a CAGR of 25.83% from 2025-2032.

Ans: The Green Electronics Manufacturing Market size was USD 21.00 Billion in 2024 and is expected to reach USD 131.64 Billion by 2032.

Ans: The major growth factor of the Green Electronics Manufacturing Market is the rising demand for sustainable, energy-efficient devices driven by strict environmental regulations and growing consumer awareness.

Ans: The Energy-Efficient Consumer Devices segment dominated the Green Electronics Manufacturing Market in 2024.

Ans: Asia Pacific dominated the Green Electronics Manufacturing Market in 2024.

Table Of Contents

1. Introduction

1.1 Market Definition & Scope

 1.2 Research Assumptions & Abbreviations

 1.3 Research Methodology

2. Executive Summary

2.1 Market Snapshot

 2.2 Market Absolute $ Opportunity Assessment & Y-o-Y Analysis, 2021–2032

 2.3 Market Size & Forecast, By Segmentation, 2021–2032

  2.3.1 Market Size By Material Type

  2.3.2 Market Size By Technology

 2.4 Market Share & Bps Analysis By Region, 2024

 2.5 Industry Growth Scenarios – Conservative, Likely & Optimistic

 2.6 Industry CxO’s Perspective

3. Market Overview

3.1 Market Dynamics

  3.1.1 Drivers

  3.1.2 Restraints

  3.1.3 Opportunities

  3.1.4 Key Market Trends

 3.2 Industry PESTLE Analysis

 3.3 Key Industry Forces (Porter’s) Impacting Market Growth

 3.4 Industry Supply Chain Analysis

  3.4.1 Raw Material Suppliers

  3.4.2 Manufacturers

  3.4.3 Distributors/Suppliers

  3.4.4 Customers/End-Users

 3.5 Industry Life Cycle Assessment

 3.6 Parent Market Overview

 3.7 Market Risk Assessment

4. Statistical Insights & Trends Reporting

4.1 Sustainable Production Metrics

4.1.1 Percentage of electronics manufacturers adopting green manufacturing practices

4.1.2 Reduction in greenhouse gas emissions per unit of product manufactured

4.1.3 Renewable energy usage share in electronics manufacturing facilities (%)

4.1.4 Water consumption per unit of output (liters/device) in green vs. traditional plants

4.1.5 Average waste diversion rate (recycled vs. landfilled materials) by facility type

4.2 Material Usage & Lifecycle Efficiency

4.2.1 Recycled material content percentage in green electronic components

4.2.2 Toxic substance phase-out rate (e.g., lead, mercury, PVC) by product category

4.2.3 Product lifespan extension (in years) through eco-design initiatives

4.2.4 Material recovery efficiency (%) in electronics take-back programs

4.2.5 Reusability rate of PCBs and semiconductors in green electronics

4.3 Energy Consumption & Efficiency Analysis

4.3.1 Average energy consumption per unit of electronic product (kWh/unit)

4.3.2 Energy efficiency improvement (%) in green electronics vs. standard models

4.3.3 Power usage effectiveness (PUE) in sustainable electronics assembly plants

4.3.4 Energy intensity trends by manufacturing process (etching, soldering, testing, etc.)

4.3.5 CO₂ emissions avoided per unit through energy-efficient designs (grams/unit)

4.4 Green Certification & Compliance Statistics

4.4.1 Percentage of products certified under ENERGY STAR, EPEAT, or RoHS

4.4.2 Annual number of new certifications obtained by top manufacturers

4.4.3 Compliance rate with international environmental standards (e.g., ISO 14001)

4.4.4 Average audit scores for environmental sustainability practices

4.4.5 Global share of factories with LEED or equivalent green building certifications

4.5 Cost & Investment Metrics

4.5.1 Average cost premium (%) of green manufacturing vs. conventional

4.5.2 ROI timelines for sustainability investments in electronics factories (in months/years)

4.5.3 R&D spending on sustainable electronics innovation as % of revenue

4.5.4 Government subsidies and tax incentives claimed per region

4.5.5 Average cost savings realized from energy-efficient equipment upgrades

5. Green Electronics Manufacturing Market Segmental Analysis & Forecast, By Material Type, 2021 – 2032, Value (USD Billion)

5.1 Introduction

 5.2 Recycled Plastics

  5.2.1 Key Trends

  5.2.2 Market Size & Forecast, 2021 – 2032

 5.3 Bio-based Polymers

  5.3.1 Key Trends

  5.3.2 Market Size & Forecast, 2021 – 2032

 5.4 Lead-free Solders

  5.4.1 Key Trends

  5.4.2 Market Size & Forecast, 2021 – 2032

 5.5 Halogen-free Laminates

  5.5.1 Key Trends

  5.5.2 Market Size & Forecast, 2021 – 2032

 5.6 Low-VOC Adhesives

  5.6.1 Key Trends

  5.6.2 Market Size & Forecast, 2021 – 2032

6. Green Electronics Manufacturing Market Segmental Analysis & Forecast, By Technology, 2021 – 2032, Value (USD Billion)

    6.1 Introduction

 6.2 Energy-Efficient Manufacturing

  6.2.1 Key Trends

  6.2.2 Market Size & Forecast, 2021 – 2032

 6.3 Additive Manufacturing (3D printing)

  6.3.1 Key Trends

  6.3.2 Market Size & Forecast, 2021 – 2032

 6.4 Printed Electronics

  6.4.1 Key Trends

  6.4.2 Market Size & Forecast, 2021 – 2032

 6.5 Eco-friendly PCB Manufacturing

  6.5.1 Key Trends

  6.5.2 Market Size & Forecast, 2021 – 2032

     6.6 Waste Heat Recovery Systems

  6.6.1 Key Trends

  6.6.2 Market Size & Forecast, 2021 – 2032

7. Green Electronics Manufacturing Market Segmental Analysis & Forecast, By Application, 2021 – 2032, Value (USD Billion)

    7.1 Introduction

 7.2 Energy-Efficient Consumer Devices

  7.2.1 Key Trends

  7.2.2 Market Size & Forecast, 2021 – 2032

 7.3 Solar-Powered Systems

  7.3.1 Key Trends

  7.3.2 Market Size & Forecast, 2021 – 2032

 7.4 E-Waste Minimization Solutions

  7.4.1 Key Trends

  7.4.2 Market Size & Forecast, 2021 – 2032

    7.5 Smart Energy Management

  7.5.1 Key Trends

  7.5.2 Market Size & Forecast, 2021 – 2032

    7.6 Low Power IoT Devices

  7.6.1 Key Trends

  7.6.2 Market Size & Forecast, 2021 – 2032

8. Green Electronics Manufacturing Market Segmental Analysis & Forecast, By Certification/Compliance, 2021 – 2032, Value (USD Billion)

    8.1 Introduction

 8.2 RoHS (Restriction of Hazardous Substances)

  8.2.1 Key Trends

  8.2.2 Market Size & Forecast, 2021 – 2032

 8.3 WEEE (Waste Electrical and Electronic Equipment)

  8.3.1 Key Trends

  8.3.2 Market Size & Forecast, 2021 – 2032

 8.4 ENERGY STAR Rated

  8.4.1 Key Trends

  8.4.2 Market Size & Forecast, 2021 – 2032

 8.5 EPEAT Certified Products

  8.5.1 Key Trends

  8.5.2 Market Size & Forecast, 2021 – 2032

 8.6 ISO 14001 Compliant Manufacturers

  8.6.1 Key Trends

  8.6.2 Market Size & Forecast, 2021 – 2032

9. Green Electronics Manufacturing Market Segmental Analysis & Forecast By Region, 2021 – 2025, Value (USD Billion)

9.1 Introduction

9.2 North America

 9.2.1 Key Trends

 9.2.2 Green Electronics Manufacturing Market Size & Forecast, By Material Type, 2021 – 2032

 9.2.3 Green Electronics Manufacturing Market Size & Forecast, By Technology, 2021 – 2032

 9.2.4 Green Electronics Manufacturing Market Size & Forecast, By Application, 2021 – 2032

 9.2.5 Green Electronics Manufacturing Market Size & Forecast, By Certification/Compliance, 2021 – 2032

 9.2.6 Green Electronics Manufacturing Market Size & Forecast, By Country, 2021 – 2032

  9.2.6.1 USA

   9.2.6.1.1 Green Electronics Manufacturing Market Size & Forecast, By Material Type, 2021 – 2032

   9.2.6.1.2 Green Electronics Manufacturing Market Size & Forecast, By Technology, 2021 – 2032

   9.2.6.1.3 Green Electronics Manufacturing Market Size & Forecast, By Application, 2021 – 2032

   9.2.6.1.4 Green Electronics Manufacturing Market Size & Forecast, By Certification/Compliance, 2021 – 2032

  9.2.6.2 Canada

   9.2.6.2.1 Green Electronics Manufacturing Market Size & Forecast, By Material Type, 2021 – 2032

   9.2.6.2.2 Green Electronics Manufacturing Market Size & Forecast, By Technology, 2021 – 2032

   9.2.6.2.3 Green Electronics Manufacturing Market Size & Forecast, By Application, 2021 – 2032

   9.2.6.2.4 Green Electronics Manufacturing Market Size & Forecast, By Certification/Compliance, 2021 – 2032

9.3 Europe

 9.3.1 Key Trends

 9.3.2 Green Electronics Manufacturing Market Size & Forecast, By Material Type, 2021 – 2032

 9.3.3 Green Electronics Manufacturing Market Size & Forecast, By Technology, 2021 – 2032

 9.3.4 Green Electronics Manufacturing Market Size & Forecast, By Application, 2021 – 2032

 9.3.5 Green Electronics Manufacturing Market Size & Forecast, By Certification/Compliance, 2021 – 2032

 9.3.6 Green Electronics Manufacturing Market Size & Forecast, By Country, 2021 – 2032

  9.3.6.1 Germany

   9.3.6.1.1 Green Electronics Manufacturing Market Size & Forecast, By Material Type, 2021 – 2032

   9.3.6.1.2 Green Electronics Manufacturing Market Size & Forecast, By Technology, 2021 – 2032

   9.3.6.1.3 Green Electronics Manufacturing Market Size & Forecast, By Application, 2021 – 2032

   9.3.6.1.4 Green Electronics Manufacturing Market Size & Forecast, By Certification/Compliance, 2021 – 2032

  9.3.6.2 UK

   9.3.6.2.1 Green Electronics Manufacturing Market Size & Forecast, By Material Type, 2021 – 2032

   9.3.6.2.2 Green Electronics Manufacturing Market Size & Forecast, By Technology, 2021 – 2032

   9.3.6.2.3 Green Electronics Manufacturing Market Size & Forecast, By Application, 2021 – 2032

   9.3.6.2.4 Green Electronics Manufacturing Market Size & Forecast, By Certification/Compliance, 2021 – 2032

  9.3.6.3 France

   9.3.6.3.1 Green Electronics Manufacturing Market Size & Forecast, By Material Type, 2021 – 2032

   9.3.6.3.2 Green Electronics Manufacturing Market Size & Forecast, By Technology, 2021 – 2032

   9.3.6.3.3 Green Electronics Manufacturing Market Size & Forecast, By Application, 2021 – 2032

   9.3.6.3.4 Green Electronics Manufacturing Market Size & Forecast, By Certification/Compliance, 2021 – 2032

  9.3.6.4 Italy

   9.3.6.4.1 Green Electronics Manufacturing Market Size & Forecast, By Material Type, 2021 – 2032

   9.3.6.4.2 Green Electronics Manufacturing Market Size & Forecast, By Technology, 2021 – 2032

   9.3.6.4.3 Green Electronics Manufacturing Market Size & Forecast, By Application, 2021 – 2032

   9.3.6.4.4 Green Electronics Manufacturing Market Size & Forecast, By Certification/Compliance, 2021 – 2032

  9.3.6.5 Spain

   9.3.6.5.1 Green Electronics Manufacturing Market Size & Forecast, By Material Type, 2021 – 2032

   9.3.6.5.2 Green Electronics Manufacturing Market Size & Forecast, By Technology, 2021 – 2032

   9.3.6.5.3 Green Electronics Manufacturing Market Size & Forecast, By Application, 2021 – 2032

   9.3.6.5.4 Green Electronics Manufacturing Market Size & Forecast, By Certification/Compliance, 2021 – 2032

  9.3.6.6 Russia

   9.3.6.6.1 Green Electronics Manufacturing Market Size & Forecast, By Material Type, 2021 – 2032

   9.3.6.6.2 Green Electronics Manufacturing Market Size & Forecast, By Technology, 2021 – 2032

   9.3.6.6.3 Green Electronics Manufacturing Market Size & Forecast, By Application, 2021 – 2032

   9.3.6.6.4 Green Electronics Manufacturing Market Size & Forecast, By Certification/Compliance, 2021 – 2032

  9.3.6.7 Poland

   9.3.6.7.1 Green Electronics Manufacturing Market Size & Forecast, By Material Type, 2021 – 2032

   9.3.6.7.2 Green Electronics Manufacturing Market Size & Forecast, By Technology, 2021 – 2032

   9.3.6.7.3 Green Electronics Manufacturing Market Size & Forecast, By Application, 2021 – 2032

   9.3.6.7.4 Green Electronics Manufacturing Market Size & Forecast, By Certification/Compliance, 2021 – 2032

  9.3.6.8 Rest of Europe

   9.3.6.8.1 Green Electronics Manufacturing Market Size & Forecast, By Material Type, 2021 – 2032

   9.3.6.8.2 Green Electronics Manufacturing Market Size & Forecast, By Technology, 2021 – 2032

   9.3.6.8.3 Green Electronics Manufacturing Market Size & Forecast, By Application, 2021 – 2032

   9.3.6.8.4 Green Electronics Manufacturing Market Size & Forecast, By Certification/Compliance, 2021 – 2032   

9.4 Asia-Pacific

 9.4.1 Key Trends

 9.4.2 Green Electronics Manufacturing Market Size & Forecast, By Material Type, 2021 – 2032

 9.4.3 Green Electronics Manufacturing Market Size & Forecast, By Technology, 2021 – 2032

 9.4.4 Green Electronics Manufacturing Market Size & Forecast, By Application, 2021 – 2032

 9.4.5 Green Electronics Manufacturing Market Size & Forecast, By Certification/Compliance, 2021 – 2032

 9.4.6 Green Electronics Manufacturing Market Size & Forecast, By Country, 2021 – 2032

  9.4.6.1 China

   9.4.6.1.1 Green Electronics Manufacturing Market Size & Forecast, By Material Type, 2021 – 2032

   9.4.6.1.2 Green Electronics Manufacturing Market Size & Forecast, By Technology, 2021 – 2032

   9.4.6.1.3 Green Electronics Manufacturing Market Size & Forecast, By Application, 2021 – 2032

   9.4.6.1.4 Green Electronics Manufacturing Market Size & Forecast, By Certification/Compliance, 2021 – 2032

  9.4.6.2 India

   9.4.6.2.1 Green Electronics Manufacturing Market Size & Forecast, By Material Type, 2021 – 2032

   9.4.6.2.2 Green Electronics Manufacturing Market Size & Forecast, By Technology, 2021 – 2032

   9.4.6.2.3 Green Electronics Manufacturing Market Size & Forecast, By Application, 2021 – 2032

   9.4.6.2.4 Green Electronics Manufacturing Market Size & Forecast, By Certification/Compliance, 2021 – 2032

  9.4.6.3 Japan

   9.4.6.3.1 Green Electronics Manufacturing Market Size & Forecast, By Material Type, 2021 – 2032

   9.4.6.3.2 Green Electronics Manufacturing Market Size & Forecast, By Technology, 2021 – 2032

   9.4.6.3.3 Green Electronics Manufacturing Market Size & Forecast, By Application, 2021 – 2032

   9.4.6.3.4 Green Electronics Manufacturing Market Size & Forecast, By Certification/Compliance, 2021 – 2032

  9.4.6.4 South Korea

   9.4.6.4.1 Green Electronics Manufacturing Market Size & Forecast, By Material Type, 2021 – 2032

   9.4.6.4.2 Green Electronics Manufacturing Market Size & Forecast, By Technology, 2021 – 2032

   9.4.6.4.3 Green Electronics Manufacturing Market Size & Forecast, By Application, 2021 – 2032

   9.4.6.4.4 Green Electronics Manufacturing Market Size & Forecast, By Certification/Compliance, 2021 – 2032

  9.4.6.5 Australia

   9.4.6.5.1 Green Electronics Manufacturing Market Size & Forecast, By Material Type, 2021 – 2032

   9.4.6.5.2 Green Electronics Manufacturing Market Size & Forecast, By Technology, 2021 – 2032

   9.4.6.5.3 Green Electronics Manufacturing Market Size & Forecast, By Application, 2021 – 2032

   9.4.6.5.4 Green Electronics Manufacturing Market Size & Forecast, By Certification/Compliance, 2021 – 2032

  9.4.6.6 ASEAN Countries

   9.4.6.6.1 Green Electronics Manufacturing Market Size & Forecast, By Material Type, 2021 – 2032

   9.4.6.6.2 Green Electronics Manufacturing Market Size & Forecast, By Technology, 2021 – 2032

   9.4.6.6.3 Green Electronics Manufacturing Market Size & Forecast, By Application, 2021 – 2032

   9.4.6.6.4 Green Electronics Manufacturing Market Size & Forecast, By Certification/Compliance, 2021 – 2032

  9.4.6.7 Rest of Asia-Pacific

   9.4.6.7.1 Green Electronics Manufacturing Market Size & Forecast, By Material Type, 2021 – 2032

   9.4.6.7.2 Green Electronics Manufacturing Market Size & Forecast, By Technology, 2021 – 2032

   9.4.6.7.3 Green Electronics Manufacturing Market Size & Forecast, By Application, 2021 – 2032

   9.4.6.7.4 Green Electronics Manufacturing Market Size & Forecast, By Certification/Compliance, 2021 – 2032

9.5 Latin America

 9.5.1 Key Trends

 9.5.2 Green Electronics Manufacturing Market Size & Forecast, By Material Type, 2021 – 2032

 9.5.3 Green Electronics Manufacturing Market Size & Forecast, By Technology, 2021 – 2032

 9.5.4 Green Electronics Manufacturing Market Size & Forecast, By Application, 2021 – 2032

 9.5.5 Green Electronics Manufacturing Market Size & Forecast, By Certification/Compliance, 2021 – 2032

 9.5.6 Green Electronics Manufacturing Market Size & Forecast, By Country, 2021 – 2032

  9.5.6.1 Brazil

   9.5.6.1.1 Green Electronics Manufacturing Market Size & Forecast, By Material Type, 2021 – 2032

   9.5.6.1.2 Green Electronics Manufacturing Market Size & Forecast, By Technology, 2021 – 2032

   9.5.6.1.3 Green Electronics Manufacturing Market Size & Forecast, By Application, 2021 – 2032

   9.5.6.1.4 Green Electronics Manufacturing Market Size & Forecast, By Certification/Compliance, 2021 – 2032

  9.5.6.2 Argentina

   9.5.6.2.1 Green Electronics Manufacturing Market Size & Forecast, By Material Type, 2021 – 2032

   9.5.6.2.2 Green Electronics Manufacturing Market Size & Forecast, By Technology, 2021 – 2032

   9.5.6.2.3 Green Electronics Manufacturing Market Size & Forecast, By Application, 2021 – 2032

   9.5.6.2.4 Green Electronics Manufacturing Market Size & Forecast, By Certification/Compliance, 2021 – 2032

  9.5.6.3 Mexico

   9.5.6.3.1 Green Electronics Manufacturing Market Size & Forecast, By Material Type, 2021 – 2032

   9.5.6.3.2 Green Electronics Manufacturing Market Size & Forecast, By Technology, 2021 – 2032

   9.5.6.3.3 Green Electronics Manufacturing Market Size & Forecast, By Application, 2021 – 2032

   9.5.6.3.4 Green Electronics Manufacturing Market Size & Forecast, By Certification/Compliance, 2021 – 2032

  9.5.6.4 Colombia

   9.5.6.4.1 Green Electronics Manufacturing Market Size & Forecast, By Material Type, 2021 – 2032

   9.5.6.4.2 Green Electronics Manufacturing Market Size & Forecast, By Technology, 2021 – 2032

   9.5.6.4.3 Green Electronics Manufacturing Market Size & Forecast, By Application, 2021 – 2032

   9.5.6.4.4 Green Electronics Manufacturing Market Size & Forecast, By Certification/Compliance, 2021 – 2032

  9.5.6.5 Rest of Latin America

   9.5.6.5.1 Green Electronics Manufacturing Market Size & Forecast, By Material Type, 2021 – 2032

   9.5.6.5.2 Green Electronics Manufacturing Market Size & Forecast, By Technology, 2021 – 2032

   9.5.6.5.3 Green Electronics Manufacturing Market Size & Forecast, By Application, 2021 – 2032

   9.5.6.5.4 Green Electronics Manufacturing Market Size & Forecast, By Certification/Compliance, 2021 – 2032

9.6 Middle East & Africa

 9.6.1 Key Trends

 9.6.2 Green Electronics Manufacturing Market Size & Forecast, By Material Type, 2021 – 2032

 9.6.3 Green Electronics Manufacturing Market Size & Forecast, By Technology, 2021 – 2032

 9.6.4 Green Electronics Manufacturing Market Size & Forecast, By Application, 2021 – 2032

 9.6.5 Green Electronics Manufacturing Market Size & Forecast, By Certification/Compliance, 2021 – 2032

 9.6.6 Green Electronics Manufacturing Market Size & Forecast, By Country, 2021 – 2032

  9.6.6.1 UAE

   9.6.6.1.1 Green Electronics Manufacturing Market Size & Forecast, By Material Type, 2021 – 2032

   9.6.6.1.2 Green Electronics Manufacturing Market Size & Forecast, By Technology, 2021 – 2032

   9.6.6.1.3 Green Electronics Manufacturing Market Size & Forecast, By Application, 2021 – 2032

   9.6.6.1.4 Green Electronics Manufacturing Market Size & Forecast, By Certification/Compliance, 2021 – 2032

  9.6.6.2 Saudi Arabia

   9.6.6.2.1 Green Electronics Manufacturing Market Size & Forecast, By Material Type, 2021 – 2032

   9.6.6.2.2 Green Electronics Manufacturing Market Size & Forecast, By Technology, 2021 – 2032

   9.6.6.2.3 Green Electronics Manufacturing Market Size & Forecast, By Application, 2021 – 2032

   9.6.6.2.4 Green Electronics Manufacturing Market Size & Forecast, By Certification/Compliance, 2021 – 2032

  9.6.6.3 Qatar

   9.6.6.3.1 Green Electronics Manufacturing Market Size & Forecast, By Material Type, 2021 – 2032

   9.6.6.3.2 Green Electronics Manufacturing Market Size & Forecast, By Technology, 2021 – 2032

   9.6.6.3.3 Green Electronics Manufacturing Market Size & Forecast, By Application, 2021 – 2032

   9.6.6.3.4 Green Electronics Manufacturing Market Size & Forecast, By Certification/Compliance, 2021 – 2032

  9.6.6.4 Egypt

   9.6.6.4.1 Green Electronics Manufacturing Market Size & Forecast, By Material Type, 2021 – 2032

   9.6.6.4.2 Green Electronics Manufacturing Market Size & Forecast, By Technology, 2021 – 2032

   9.6.6.4.3 Green Electronics Manufacturing Market Size & Forecast, By Application, 2021 – 2032

   9.6.6.4.4 Green Electronics Manufacturing Market Size & Forecast, By Certification/Compliance, 2021 – 2032

  9.6.6.5 South Africa

   9.6.6.5.1 Green Electronics Manufacturing Market Size & Forecast, By Material Type, 2021 – 2032

   9.6.6.5.2 Green Electronics Manufacturing Market Size & Forecast, By Technology, 2021 – 2032

   9.6.6.5.3 Green Electronics Manufacturing Market Size & Forecast, By Application, 2021 – 2032

   9.6.6.5.4 Green Electronics Manufacturing Market Size & Forecast, By Certification/Compliance, 2021 – 2032

  9.6.6.6 Rest of Middle East & Africa

   9.6.6.6.1 Green Electronics Manufacturing Market Size & Forecast, By Material Type, 2021 – 2032

   9.6.6.6.2 Green Electronics Manufacturing Market Size & Forecast, By Technology, 2021 – 2032

   9.6.6.6.3 Green Electronics Manufacturing Market Size & Forecast, By Application, 2021 – 2032

   9.6.6.6.4 Green Electronics Manufacturing Market Size & Forecast, By Certification/Compliance, 2021 – 2032

10. Competitive Landscape

 10.1 Key Players' Positioning

 10.2 Competitive Developments

  10.2.1 Key Strategies Adopted (%), By Key Players, 2024

  10.2.2 Year-Wise Strategies & Development, 2021 – 2025

  10.2.3 Number Of Strategies Adopted By Key Players, 2024

 10.3 Market Share Analysis, 2024

 10.4 Product/Service & Application Benchmarking

  10.4.1 Product/Service Specifications & Features By Key Players

  10.4.2 Product/Service Heatmap By Key Players

  10.4.3 Application Heatmap By Key Players

 10.5 Industry Start-Up & Innovation Landscape

 10.6 Key Company Profiles

10.6 Key Company Profiles

 10.6.1 Apple Inc.

  10.6.1.1 Company Overview & Snapshot

  10.6.1.2 Product/Service Portfolio

  10.6.1.3 Key Company Financials

  10.6.1.4 SWOT Analysis

 10.6.2 Samsung Electronics Co., Ltd.

  10.6.2.1 Company Overview & Snapshot

  10.6.2.2 Product/Service Portfolio

  10.6.2.3 Key Company Financials

  10.6.2.4 SWOT Analysis

 10.6.3 Panasonic Holdings Corporation.

  10.6.3.1 Company Overview & Snapshot

  10.6.3.2 Product/Service Portfolio

  10.6.3.3 Key Company Financials

  10.6.3.4 SWOT Analysis

 10.6.4 Sony Group Corporation.

  10.6.4.1 Company Overview & Snapshot

  10.6.4.2 Product/Service Portfolio

  10.6.4.3 Key Company Financials

  10.6.4.4 SWOT Analysis

 10.6.5 HP Inc.

  10.6.5.1 Company Overview & Snapshot

  10.6.5.2 Product/Service Portfolio

  10.6.5.3 Key Company Financials

  10.6.5.4 SWOT Analysis

 10.6.6 Dell Technologies Inc.

  10.6.6.1 Company Overview & Snapshot

  10.6.6.2 Product/Service Portfolio

  10.6.6.3 Key Company Financials

  10.6.6.4 SWOT Analysis

 10.6.7 Lenovo Group Limited.

  10.6.7.1 Company Overview & Snapshot

  10.6.7.2 Product/Service Portfolio

  10.6.7.3 Key Company Financials

  10.6.7.4 SWOT Analysis

 10.6.8 LG Electronics Inc.

  10.6.8.1 Company Overview & Snapshot

  10.6.8.2 Product/Service Portfolio

  10.6.8.3 Key Company Financials

  10.6.8.4 SWOT Analysis

 10.6.9 Intel Corporation

  10.6.9.1 Company Overview & Snapshot

  10.6.9.2 Product/Service Portfolio

  10.6.9.3 Key Company Financials

  10.6.9.4 SWOT Analysis

 10.6.10 Acer Inc.

  10.6.10.1 Company Overview & Snapshot

  10.6.10.2 Product/Service Portfolio

  10.6.10.3 Key Company Financials

  10.6.10.4 SWOT Analysis

 10.6.11 ASUSTeK Computer Inc

  10.6.11.1 Company Overview & Snapshot

  10.6.11.2 Product/Service Portfolio

  10.6.11.3 Key Company Financials

  10.6.11.4 SWOT Analysis

 10.6.12 Microsoft Corporation

  10.6.12.1 Company Overview & Snapshot

  10.6.12.2 Product/Service Portfolio

  10.6.12.3 Key Company Financials

  10.6.12.4 SWOT Analysis

 10.6.13 Toshiba Corporation

  10.6.13.1 Company Overview & Snapshot

  10.6.13.2 Product/Service Portfolio

  10.6.13.3 Key Company Financials

  10.6.13.4 SWOT Analysis

 10.6.14 Fujitsu Limited

  10.6.14.1 Company Overview & Snapshot

  10.6.14.2 Product/Service Portfolio

  10.6.14.3 Key Company Financials

  10.6.14.4 SWOT Analysis

 10.6.15 Sharp Corporation

  10.6.15.1 Company Overview & Snapshot

  10.6.15.2 Product/Service Portfolio

  10.6.15.3 Key Company Financials

  10.6.15.4 SWOT Analysis

 10.6.16 Nokia Corporation

  10.6.16.1 Company Overview & Snapshot

  10.6.16.2 Product/Service Portfolio

  10.6.16.3 Key Company Financials

  10.6.16.4 SWOT Analysis

 10.6.17 Cisco Systems, Inc.

  10.6.17.1 Company Overview & Snapshot

  10.6.17.2 Product/Service Portfolio

  10.6.17.3 Key Company Financials

  10.6.17.4 SWOT Analysis

 10.6.18 Xiaomi Corporation.

  10.6.18.1 Company Overview & Snapshot

  10.6.18.2 Product/Service Portfolio

  10.6.18.3 Key Company Financials

  10.6.18.4 SWOT Analysis

 10.6.19 Siemens AG

  10.6.19.1 Company Overview & Snapshot

  10.6.19.2 Product/Service Portfolio

  10.6.19.3 Key Company Financials

  10.6.19.4 SWOT Analysis

 10.6.20 Epson Corporation.

  10.6.20.1 Company Overview & Snapshot

  10.6.20.2 Product/Service Portfolio

  10.6.20.3 Key Company Financials

  10.6.20.4 SWOT Analysis

11. Analyst Recommendations

 11.1 SNS Insider Opportunity Map

 11.2 Industry Low-Hanging Fruit Assessment

 11.3 Market Entry & Growth Strategy

 11.4 Analyst Viewpoint & Suggestions On Market Growth

12. Assumptions

13. Disclaimer

14. Appendix

 14.1 List Of Tables

 14.2 List Of Figures

An accurate research report requires proper strategizing as well as implementation. There are multiple factors involved in the completion of good and accurate research report and selecting the best methodology to compete the research is the toughest part. Since the research reports we provide play a crucial role in any company’s decision-making process, therefore we at SNS Insider always believe that we should choose the best method which gives us results closer to reality. This allows us to reach at a stage wherein we can provide our clients best and accurate investment to output ratio.

Each report that we prepare takes a timeframe of 350-400 business hours for production. Starting from the selection of titles through a couple of in-depth brain storming session to the final QC process before uploading our titles on our website we dedicate around 350 working hours. The titles are selected based on their current market cap and the foreseen CAGR and growth.


The 5 steps process:

Step 1: Secondary Research:

Secondary Research or Desk Research is as the name suggests is a research process wherein, we collect data through the readily available information. In this process we use various paid and unpaid databases which our team has access to and gather data through the same. This includes examining of listed companies’ annual reports, Journals, SEC filling etc. Apart from this our team has access to various associations across the globe across different industries. Lastly, we have exchange relationships with various university as well as individual libraries.

Secondary Research

Step 2: Primary Research

When we talk about primary research, it is a type of study in which the researchers collect relevant data samples directly, rather than relying on previously collected data.  This type of research is focused on gaining content specific facts that can be sued to solve specific problems. Since the collected data is fresh and first hand therefore it makes the study more accurate and genuine.

We at SNS Insider have divided Primary Research into 2 parts.

Part 1 wherein we interview the KOLs of major players as well as the upcoming ones across various geographic regions. This allows us to have their view over the market scenario and acts as an important tool to come closer to the accurate market numbers. As many as 45 paid and unpaid primary interviews are taken from both the demand and supply side of the industry to make sure we land at an accurate judgement and analysis of the market.

This step involves the triangulation of data wherein our team analyses the interview transcripts, online survey responses and observation of on filed participants. The below mentioned chart should give a better understanding of the part 1 of the primary interview.

Primary Research

Part 2: In this part of primary research the data collected via secondary research and the part 1 of the primary research is validated with the interviews from individual consultants and subject matter experts.

Consultants are those set of people who have at least 12 years of experience and expertise within the industry whereas Subject Matter Experts are those with at least 15 years of experience behind their back within the same space. The data with the help of two main processes i.e., FGDs (Focused Group Discussions) and IDs (Individual Discussions). This gives us a 3rd party nonbiased primary view of the market scenario making it a more dependable one while collation of the data pointers.

Step 3: Data Bank Validation

Once all the information is collected via primary and secondary sources, we run that information for data validation. At our intelligence centre our research heads track a lot of information related to the market which includes the quarterly reports, the daily stock prices, and other relevant information. Our data bank server gets updated every fortnight and that is how the information which we collected using our primary and secondary information is revalidated in real time.

Data Bank Validation

Step 4: QA/QC Process

After all the data collection and validation our team does a final level of quality check and quality assurance to get rid of any unwanted or undesired mistakes. This might include but not limited to getting rid of the any typos, duplication of numbers or missing of any important information. The people involved in this process include technical content writers, research heads and graphics people. Once this process is completed the title gets uploader on our platform for our clients to read it.

Step 5: Final QC/QA Process:

This is the last process and comes when the client has ordered the study. In this process a final QA/QC is done before the study is emailed to the client. Since we believe in giving our clients a good experience of our research studies, therefore, to make sure that we do not lack at our end in any way humanly possible we do a final round of quality check and then dispatch the study to the client.

Key Segments: 

By Material Type

  • Recycled Plastics

  • Bio-based Polymers

  • Lead-free Solders

  • Halogen-free Laminates

  • Low-VOC Adhesives

By Technology

  • Energy-Efficient Manufacturing

  • Additive Manufacturing (3D printing)

  • Printed Electronics

  • Eco-friendly PCB Manufacturing

  • Waste Heat Recovery Systems

By Application

  • Energy-Efficient Consumer Devices

  • Solar-Powered Systems

  • E-Waste Minimization Solutions

  • Smart Energy Management

  • Low Power IoT Devices

By Certification/Compliance

  • RoHS (Restriction of Hazardous Substances)

  • WEEE (Waste Electrical and Electronic Equipment)

  • ENERGY STAR Rated

  • EPEAT Certified Products

  • ISO 14001 Compliant Manufacturers

Request for Segment Customization as per your Business Requirement: Segment Customization Request

Regional Coverage: 

North America

  • US

  • Canada

  • Mexico

Europe

  • Germany

  • France

  • UK

  • Italy

  • Spain

  • Poland

  • Turkey

  • Rest of Europe

Asia Pacific

  • China

  • India

  • Japan

  • South Korea

  • Singapore

  • Australia

  • Taiwan

  • Rest of Asia Pacific

Middle East & Africa

  • UAE

  • Saudi Arabia

  • Qatar

  • South Africa

  • Rest of Middle East & Africa

Latin America

  • Brazil

  • Argentina

  • Rest of Latin America

Request for Country Level Research Report: Country Level Customization Request

Available Customization 

With the given market data, SNS Insider offers customization as per the company’s specific needs. The following customization options are available for the report: 

  • Detailed Volume Analysis 

  • Criss-Cross segment analysis (e.g. Product X Application) 

  • Competitive Product Benchmarking 

  • Geographic Analysis 

  • Additional countries in any of the regions 

  • Customized Data Representation 

  • Detailed analysis and profiling of additional market players

Explore Key Insights.


  • Analyzes market trends, forecasts, and regional dynamics
  • Covers core offerings, innovations, and industry use cases
  • Profiles major players, value chains, and strategic developments
  • Highlights innovation trends, regulatory impacts, and growth opportunities
Request an Analyst Call