Sports Technology Market Report Scope & Overview:
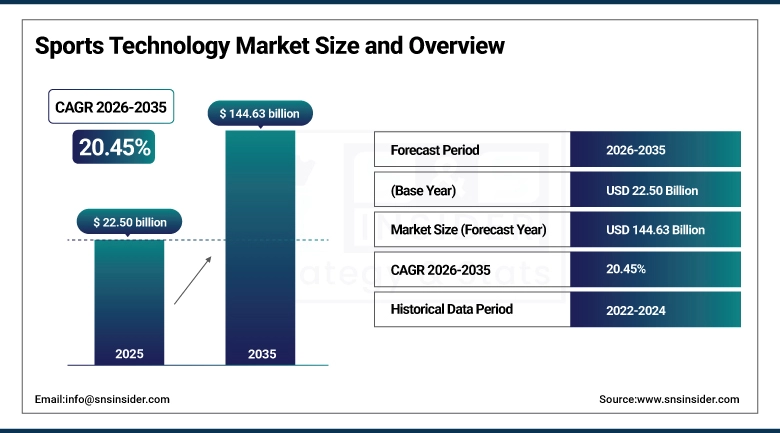
The Sports Technology Market size was valued at USD 22.50 Billion in 2025 and is projected to reach USD 144.63 Billion by 2035, growing at a CAGR of 20.45% during 2026–2035.
One of the main factors that will positively affect the growth of the Sports Technology Market in the coming years is the increasing adoption of various emerging technologies, such as artificial intelligence, data analytics, and IoT, in measuring and understanding various parameters of sports for decision-making purposes. The increasing adoption of fitness devices and wearables among athletes optimizes training and reduces injuries. In addition, the increasing investment in fan engagement technologies, such as AR/VR, live streaming, and various other technologies, is also contributing to market growth. In addition, in the global market, the increasing adoption of digital technologies in sports management, broadcasting, and gaming is contributing to market growth at an even faster rate.
Sports Technology Market Size and Growth Forecast:
-
Market Size in 2025: USD 22.50 Billion
-
Market Size by 2035: USD 144.63 Billion
-
CAGR: 20.45% during 2026–2035
-
Base Year: 2025
-
Forecast Period: 2026–2035
-
Historical Data: 2022–2024
To Get more information on Sports Technology Market - Request Free Sample Report
Sports Technology Market Key Trends:
-
AI and data analytics adoption is increasing for real-time performance tracking and data-driven decision-making.
-
Wearable technology usage is rising to monitor biometrics, enhance performance, and prevent injuries.
-
AR/VR and digital platforms are transforming fan engagement with immersive and personalized experiences.
-
Esports and digital sports platforms are expanding with growing viewership and investments.
-
Cloud-based solutions are improving sports management, broadcasting, and content accessibility.
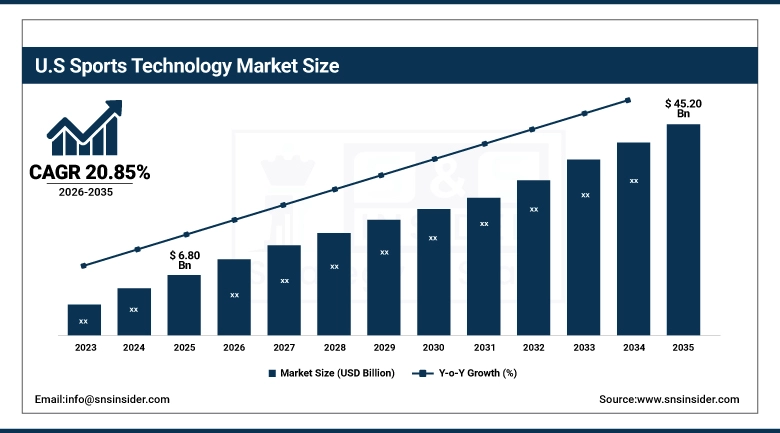
U.S. Sports Technology Market Size Outlook:
The U.S. Sports Technology Market was valued at approximately USD 6.80 Billion in 2025 and is projected to reach around USD 45.20 Billion by 2035, growing at a CAGR of 20.85% during 2026–2035, Growth of the U.S. Market is driven by rising adoption of AI analytics, wearable devices, fan engagement platforms, esports expansion, and increasing investments in digital broadcasting and smart stadium technologies.
Sports Technology Market Key Drivers:
-
Rising Adoption of AI, Wearables, and Fan Engagement Technologies Drives Sports Technology Market
With the increasing use of AI, data analytics, and IoT technologies in the sports industry, the performance of athletes is being improved to a great extent. The increasing use of wearable technology to monitor health and performance metrics in real-time is also contributing to the growth of the market. Besides this, the increasing investment in fan engagement platforms such as AR/VR and mobile applications is revolutionizing the spectator experience. All these factors are contributing to the digital transformation of the sports industry.
Sports Technology Market Key Restraints:
-
High Implementation Costs and Data Security Concerns Limit Market Adoption
The cost involved in using advanced sports technology, including AI technology, smart equipment, and digital infrastructure, acts as a barrier for sports organizations, especially small ones. Furthermore, issues concerning data privacy, cybersecurity, and the misuse of athlete performance data are challenges to the technology’s widespread use. Complexity in technology integration and lack of technical know-how in certain regions are also challenges to the technology’s widespread use in the sports industry. These factors act as challenges to technology and hinder its accessibility in the sports industry.
Sports Technology Market Key Opportunities:
-
Expansion of Smart Stadiums and Esports Ecosystem Creates Growth Opportunities
The fast pace of smart stadium development and the availability of smart devices, real-time analytics, and greater fan experience are creating new opportunities in the market’s growth path. Furthermore, the rise of the new and exciting world of esports is generating considerable investments and sponsorships, as well as a global audience. The progress in immersive technology like AR/VR and cloud computing is creating new opportunities in the market’s growth path, specifically in the professional and amateur sports arena.
Sports Technology Market Segments:
-
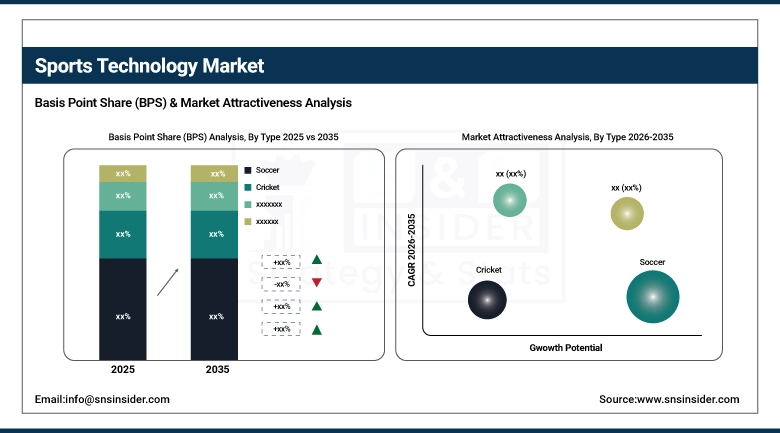
By Type: In 2025, Soccer dominated with 30% share; Basketball fastest growing segment during 2026–2035
-
By Technology: In 2025, Devices dominated with 38% share; E-sports fastest growing segment during 2026–2035
-
By End User: In 2025, Sports Leagues dominated with 35% share; Sports Clubs fastest growing segment during 2026–2035
By Type: Soccer Leads as Basketball Gains Momentum
Soccer leads the market due to its popularity, large fan base, and the significant investments it receives for performance analytics, broadcasting, and fan engagement technology. The major soccer leagues and competitions contribute to the steady adoption of advanced sports technology solutions.
Basketball is gaining traction with the rising adoption of wearable technology, analytics tools, and fan engagement technology, especially for professional competitions and training programs.
By Technology: Devices Lead as E-sports Accelerates
Devices lead in terms of market dominance owing to the popularity of wearables, sensors, and smart equipment for real-time monitoring of performance and prevention of injuries. High demand from athletes and teams keeps this segment at the top.
E-sports is growing rapidly with increasing online viewership, sponsorship investments, and development of digital infrastructure. The advent of competitive gaming is resulting in high adoption of advanced technologies.
By End User: Sports Leagues Lead as Sports Clubs Expand Adoption.
The sports leagues have a commanding position in the market due to the huge investments made in analytics, broadcasting technology, and fan engagement tools. The sports leagues are already utilizing the advanced technology for improving performance and operations. Sports clubs are also catching up with the technology as they are investing more in wearable technology and performance monitoring tools to improve the performance of the players.
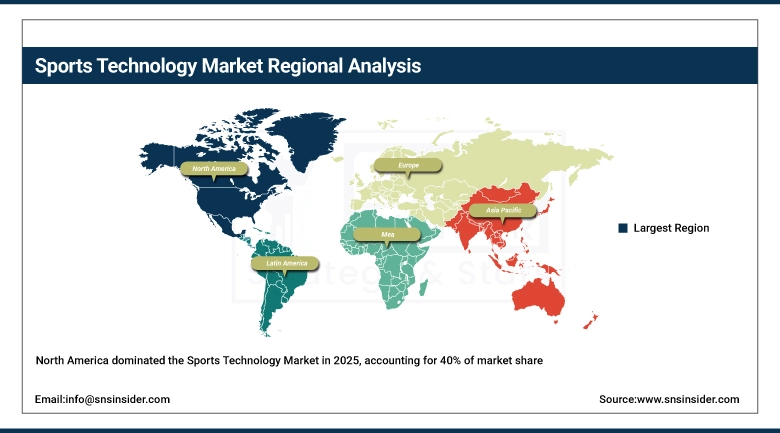
Sports Technology Market Regional Analysis:
North America Sports Technology Market Insights:
In 2025, North America will have the highest share of the sport technology market, which will be approximately 40% of the total revenue. This is due to the fact that the adoption of advanced technology is very high in the United States and Canada. Sports organizations and sport professionals are adopting advanced technology like AI, wearable technology, and performance analytics. The United States is leading the sport technology market with huge investments in sports technology. Sports organizations like the NBA, NFL, and MLB have adopted advanced technology to improve performance and provide a safe environment for players. Additionally, the NBA and other sports organizations have provided immersive experiences to fans. Canada is also growing rapidly, and the focus is on wearable technology and AI.
Get Customized Report as per Your Business Requirement - Enquiry Now
Asia-Pacific Sports Technology Market Insights:
Asia-Pacific is registering the highest growth rate in the sports technology market. Countries such as China, Japan, India, South Korea, and Australia have been investing heavily in sports technology such as AI, wearables, and smart stadiums. China is rapidly growing in areas such as smart fitness technology, esports, and fan engagement. The government is providing strong support to the sports technology market. Japan and South Korea are adopting technologies such as robotics, AR/VR to improve traditional as well as esports. India is also emerging as a key region as investment is increasing in areas such as cricket analytics, wearables, and grassroots sports technology. Australia is leading in areas such as athlete monitoring and wearable technology in sports such as rugby and cricket.
Europe Sports Technology Market Insights:
Europe is the leading sports technology market, driven by adoption in big sports technology countries in Europe such as the United Kingdom (UK), Germany, France, and Spain by the year 2025. Wearable technology, optical tracking and AI-based analytics are popular and majorly used by the European football clubs to ensure the players perform better while minimizing the possibility of an injury. Sports organizations such as the UEFA have begun implementing sports technology like VAR (Video Assistant Referee) or Hawk-Eye, which aid in improving the accuracy of decisions. Germany and the United Kingdom are also leading in research partnerships and sports innovation hubs that encourage inter-movement collaboration between academia, professional sports, and sports tech companies. In addition, the growing demand for various fan engagement tools such as AR, VR, data-driven broadcast, etc., has further boosted the sports technology market.
Latin America Sports Technology Market Insights:
Latin America has recorded a steady growth rate in terms of sports technology. Brazil, Mexico, and Argentina are the key markets for sports technology in Latin America. Football is the most popular sport in Latin America. Sports technology companies are increasingly partnering with football clubs. Brazil has recorded the highest investments in terms of sports technology, including sports training tools. Football is a popular sport in Brazil, and hence, sports technology companies are investing in football. Mexico has recorded the highest growth rate in terms of sports broadcasting technology and smart stadia. Argentina has recorded investments in terms of data analytics and artificial intelligence-based performance monitoring. Latin America is a budget-constrained region. Sports technology companies are witnessing a number of sports technology startups in Latin America, thereby increasing the penetration of sports technology.
Middle East & Africa (MEA) Sports Technology Market Insights:
The Middle East & Africa region has started to emerge as a developing hub for sports technology, with growth being driven by investments in world-class sports infrastructure. The UAE, Qatar, and Saudi Arabia are at the forefront of sports technology, leveraging wearable technology, AI-based analytics, smart stadium technology, and more, for football, athletics, and motorsports. The hosting of the FIFA World Cup 2022 has accelerated sports technology adoption in Qatar, including broadcasting, stadium operations, and fan engagement. The sports technology market has received a boost from the ‘Vision 2030’ initiative launched by the government of Saudi Arabia. In the African market, there has been a growing interest in wearable technology, as seen in the sports technology markets of South Africa and Nigeria. However, the market remains at a nascent stage.
Sports Technology Market Competitive Landscape:
Catapult Sports, founded in 2006 in Australia, is one of the leading companies in delivering sports performance technology, particularly in wearable GPS devices, athlete monitoring systems, and analytics systems for various sports disciplines. The organization assists various professional teams and athletes across the world in delivering data-driven insights to improve performance, minimize injury risks, and maximize training efficiency.
-
October 30, 2024: Catapult signed a deal with England’s Rugby Football Union, Premiership Rugby, and Premiership Women’s Rugby, becoming the preferred provider of athlete monitoring technology.
Zebra Technologies is a global leader in enterprise technology solutions based in the United States, founded in 1969, and offers products like the MotionWorks Sports Solution, which provides real-time tracking of the ball and the players in a game. The company provides technology solutions that help sports organizations improve their decision-making processes and the experience of their fans.
-
March 25, 2024 – Zebra Technologies sponsored the NFL Health & Safety Summit, showcasing its RFID solutions to enhance player performance, injury prevention, and equipment tracking.
In August 2024, Hudl acquired StatsBomb, combining its data analytics expertise (in football and American football) with Hudl’s video analysis software, providing teams and sports analysts across the globe with more insights, efficiency, and the ability to combine video and data.
-
August 12, 2024 – Hudl acquired StatsBomb, enhancing its professional sports solutions with advanced data analytics for football and American football teams, providing deeper insights for performance and recruitment.
Sports Technology Companies are:
-
Catapult Sports
-
STATSports
-
Hudl
-
IBM
-
SAP SE
-
Hawk-Eye Innovations
-
Second Spectrum
-
Genius Sports
-
SportRadar
-
Whoop
-
Polar Electro
-
Fitbit
-
ChyronHego
-
PlaySight Interactive
-
ShotTracker
-
KINEXON
-
Garmin
-
Oracle
| Report Attributes | Details |
|---|---|
| Market Size in 2025 | USD 22.50 Billion |
| Market Size by 2035 | USD 144.63 Billion |
| CAGR | CAGR of 20.45% From 2026 to 2035 |
| Base Year | 2025 |
| Forecast Period | 2026-2035 |
| Historical Data | 2022-2024 |
| Report Scope & Coverage | Market Size, Segments Analysis, Competitive Landscape, Regional Analysis, DROC & SWOT Analysis, Forecast Outlook |
| Key Segments | • By Type (Baseball, Cricket, Tennis, Rugby, Basketball, Ice Hockey, Soccer) • By Technology (Devices, Smart Stadium, E sports, Statistics & Analytics) • By End User ( Sports Clubs, Sports Associations, Sports Leagues, Others) |
| Regional Analysis/Coverage | North America (US, Canada), Europe (Germany, UK, France, Italy, Spain, Russia, Poland, Rest of Europe), Asia Pacific (China, India, Japan, South Korea, Australia, ASEAN Countries, Rest of Asia Pacific), Middle East & Africa (UAE, Saudi Arabia, Qatar, South Africa, Rest of Middle East & Africa), Latin America (Brazil, Argentina, Mexico, Colombia, Rest of Latin America). |
| Company Profiles | Catapult Sports, Zebra Technologies, STATSports, Hudl, IBM, SAP SE, Stats Perform, Hawk-Eye Innovations, Second Spectrum, Genius Sports, SportRadar, Whoop, Polar Electro, Fitbit, ChyronHego, PlaySight Interactive, ShotTracker, KINEXON, Garmin, and Oracle. |
Frequently Asked Questions
Ans: The Sports Technology Market is expected to grow at a CAGR of 20.45% during 2026-2035.
Ans: The Sports Technology Market size was USD 22.50 billion in 2025 and is expected to Reach USD 144.63 billion by 2035.
Ans: Increasing adoption of AI, wearable technologies, and digital fan engagement platforms is the major growth factor of the Sports Technology Market.
Ans: Soccer segment dominated the Sports Technology Market in 2025.
Ans: North America region dominated the Sports Technology Market in 2025.
Get in Touch
