Green Methanol Market Report Scope & Overview:
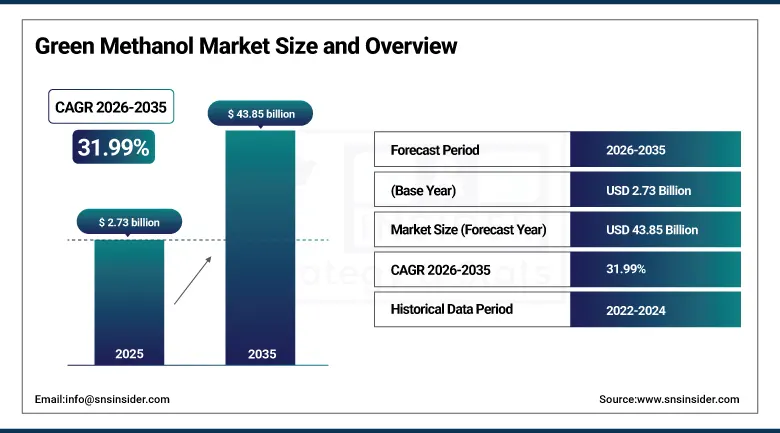
The Green Methanol Market was valued at USD 2.73 billion in 2025 and is expected to reach USD 43.85 billion by 2035, growing at a CAGR of 31.99% from 2026-2035.
The Green Methanol Market is growing because of the rising demand for low-carbon energy in industries like shipping, chemical, and others. The increasing efforts towards decarbonization, tough environmental policies, and investment in renewable hydrogen and carbon capture systems are also adding up to the market growth. Moreover, the rise in the use of methanol-powered vessels along with marine fuel facilities is another major driving factor behind the market’s growth. Governments as well as private firms have invested in renewable fuel projects to lower greenhouse gas emissions.
Maersk signed an offtake agreement for approximately 500,000 tonnes per year of green and e-methanol from Goldwind’s China-based production project, marking a major step toward decarbonizing shipping operations through large-scale adoption of low-carbon marine fuel alternatives.
The world’s first commercial-scale e-methanol plant was inaugurated in Kasso, Denmark in 2025, with an annual capacity of around 42,000 tonnes. The facility produces e-methanol using renewable hydrogen and captured CO₂, supporting sustainable fuel production and industrial decarbonization efforts.
Market Size and Forecast
-
Market Size in 2025: USD 2.73 Billion
-
Market Size by 2035: USD 43.85 Billion
-
CAGR: 31.99% from 2026 to 2035
-
Base Year: 2025
-
Forecast Period: 2026–2035
-
Historical Data: 2022–2024
To Get more information on Green Methanol Market - Request Free Sample Report
Green Methanol Market Trends
-
Rising global focus on decarbonization and low-carbon fuels is driving the green methanol.
-
Growing adoption in shipping, power generation, and chemical feedstock applications is boosting market growth.
-
Expansion of renewable hydrogen and captured CO₂-based fuel production is fueling deployment.
-
Increasing demand for alternative marine fuels to meet emission regulations is shaping adoption trends.
-
Advancements in carbon capture, electrolysis, and biomass-to-methanol technologies are enhancing production efficiency.
-
Rising government incentives, net-zero commitments, and sustainability mandates are supporting market expansion.
-
Collaborations between energy companies, chemical producers, and shipping operators are accelerating innovation and global adoption.
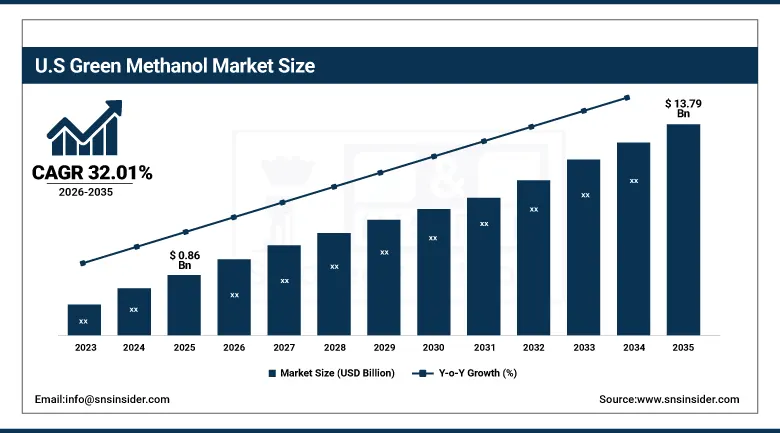
U.S. Green Methanol Market was valued at USD 0.86 billion in 2025 and is expected to reach USD 13.79 billion by 2035, growing at a CAGR of 32.01% from 2026-2035.
The U.S. Green Methanol Market is growing due to increased investment in renewable hydrogen, carbon capture technologies, and sustainable marine fuels. Favorable government policies regarding clean energy transition, industrial decarbonization efforts, and adoption of clean fuels in the shipping and chemical industries are boosting green methanol production in the United States.
Green Methanol Market Segment Highlights
-
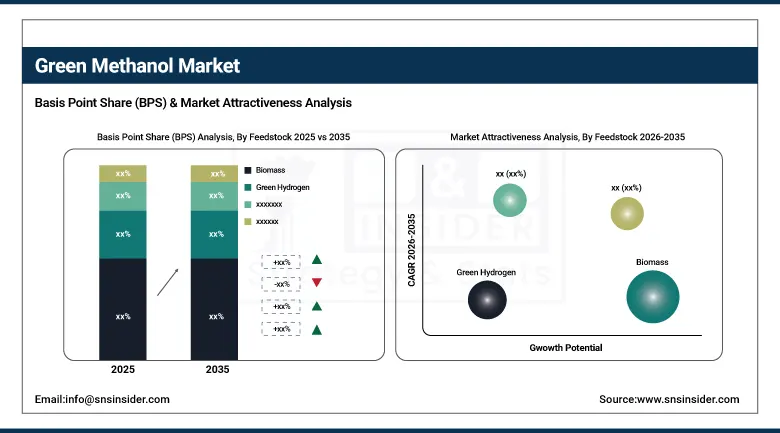
By Feedstock, Biomass segment dominated the Green Methanol Market in 2025 with approximately 48% share; Green Hydrogen segment fastest growing.
-
By Derivative, Formaldehyde segment dominated the Green Methanol Market in 2025 with nearly 43% share; Methanol-To-Olefin segment fastest growing.
-
By Application, Chemical Feedstock segment dominated the Green Methanol Market in 2025 with approximately 58% share; Fuel segment fastest growing.
Green Methanol Market Segment Analysis
By Feedstock, Biomass segment dominates the Green Methanol Market, Green Hydrogen segment expected to grow fastest
The Biomass segment captured a largest market share in 2025 owing to its abundant availability from agricultural wastes, forestry wastes, and municipal solid waste for the purpose of producing sustainable methanol. The biomass pathway is well established in a commercial context and is easily integrated into existing methanol production systems. Policy incentives favoring carbon reduction and waste-to-energy programs also contributed to higher growth rates in this category. Companies preferred to use biomass due to reduced carbon footprints and stable business prospects from methanol production.
The Green Hydrogen segment experienced the most rapid growth due to growing investments in renewable energy systems and electrolyzers that are contributing to increased commercial attractiveness of e-methanol production systems. This approach allows for production of zero-carbon methanol when coupled with carbon dioxide capture. Government policies for promoting hydrogen infrastructure, along with growing sustainability commitments of companies, are contributing to its adoption. Falling costs of renewable electricity generation and enhanced electrolyzer efficiency have also played an important role in rapidly expanding the green hydrogen segment.
By Derivative, Formaldehyde segment dominates the Green Methanol Market, Methanol-To-Olefin segment expected to grow fastest
The Formaldehyde segment occupied the leading position in the market during 2025 due to high demand for formaldehyde from the industries related to construction, automobiles, textiles, and furniture manufacturing. Green methanol has been used as an ingredient in formaldehyde synthesis for the production of resins, adhesives, and insulating materials. The segment also benefited from industrial infrastructure along with consistent demands for engineered wood products. Increasing emphasis on low-carbon chemicals has motivated companies to adopt green methanol in formaldehyde production without compromising its properties and feasibility in the industry.
Methanol-To-Olefin was the fastest-growing segment due to demand for sustainable olefins increased in the production of packaging materials, consumer goods, and plastics. It provided the required ingredients for the production of ethylene and propylene while reducing greenhouse gas emissions. Petrochemical expansion and technological innovations are making methanol-to-olefin conversion more feasible and efficient. Increased restriction on non-renewable chemical synthesis and demand for renewable polymers is expected to boost the adoption of green methanol.
By Application, Chemical Feedstock segment dominates the Green Methanol Market, Fuel segment expected to grow fastest
The Chemical Feedstock segment held the dominant share in the Green Methanol Market in 2025 since methanol continues to play a vital role in the production of formaldehyde, acetic acid, olefins, and other chemicals. The current chemical production processes make large-scale green methanol usage easier due to less need for process changes. The growing adoption of sustainable feedstock materials was necessitated by compliance with emission reduction policies as well as business sustainability initiatives. Stable and consistent demand from downstream industries provided strong demand volumes, thus, contributing significantly to market revenues.
Fuel segment is projected to grow the fastest rate driven by rising use of low-emission marine fuels and alternative sources of transportation energy. The adoption of green methanol is witnessing a rise in shipping, power generation, and heavy transport sector due to its lower emissions and compatibility with existing fuel delivery systems. Decarbonization regulations and development of ships running on methanol is driving up the fuel demand for green methanol. Renewable fuel infrastructure and efforts towards reducing reliance on fossil fuels will drive up growth in the fuel segment of green methanol.
Green Methanol Market Regional Analysis
|
Region |
Major Country |
Share within Region (%) |
|---|---|---|
|
North America |
United States |
85.6% |
|
Europe |
United Kingdom |
17.9% |
|
Asia Pacific |
Australia |
10.7% |
|
Middle East & Africa |
UAE |
15.4% |
|
Latin America |
Brazil |
43.8% |
North America Green Methanol Market Insights
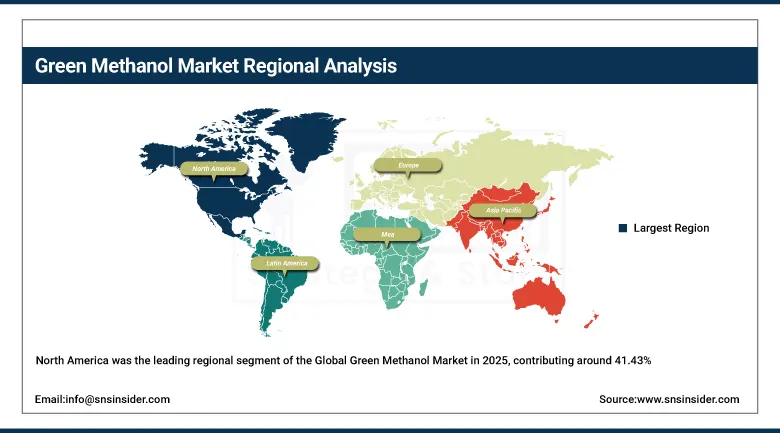
North America was the leading regional segment of the Global Green Methanol Market in 2025, contributing around 41.43% to the global market share. High investments in the development of renewable fuels, increased carbon capture initiatives, and growing use of low-carbon ship fuels fueled regional dominance. The favorable policies of governments towards clean energy transition and industry decarbonization helped boost market expansion. The presence of large green methanol manufacturers, cutting-edge renewable hydrogen plants, and energy-shipping partnerships contributed significantly to market development in the region.
Get Customized Report as per Your Business Requirement - Enquiry Now
Asia Pacific Green Methanol Market Insights
The Asia Pacific region accounted for a considerable market share of the Green Methanol Market and represented the fastest-growing region due to rapid industrialization and clean energy investments in the region. High production of renewable hydrogen, the need for sustainable marine fuels, and favorable government decarbonization initiatives have been key drivers for the growth of the regional market. Countries in the region have been making large investments in renewable energy, carbon reduction, and green chemistry technologies.
Europe Green Methanol Market Insights
The Europe Green Methanol Market is witnessing significant growth owing to strict carbon emissions norms and stringent climate neutrality goals. The rapid rise in investments towards renewable hydrogen, carbon capture utilization, and sustainable maritime fuels is facilitating growth in the European region. Leading players in the chemicals industry and maritime transport have started utilizing green methanol for their decarbonization efforts. The adoption of governmental initiatives that encourage renewable fuel usage and clean energy systems is helping in market growth.
Middle East & Africa and Latin America Green Methanol Market Insights
Middle East & Africa and Latin America Green Methanol Market is witnessing considerable traction owing to growing investments in renewable energy sources and an increased emphasis on the production of sustainable fuels. Solar and wind energy sources are being leveraged for developing renewable hydrogen-based and low-carbon fuel projects in these regions. Favorable government policies and infrastructural developments have been promoting industrial decarbonization and energy diversification in these geographies. Increasing export prospects, escalating chemical manufacturing operations, and strengthening international cooperation are likely to drive future market growth in both these regions.
Market Growth Drivers:
Expanding maritime decarbonization initiatives and low-emission fuel adoption are accelerating commercial demand for renewable methanol across shipping operations: Global shipping firms are turning their attention towards green methanol to mitigate climate change and fulfill carbon regulations at sea. The increased focus on methanol-powered ships, dual fuel engines, and infrastructure for sustainable marine fuel is leading to high demand globally. Leading ports and logistics companies are incorporating renewable fuel bunkering stations for cleaner shipping. Green methanol presents storage and transport benefits over some competing fuels, which further drives adoption in the industry. Commitments to zero-carbon emissions goals and environmental sustainability initiatives are driving companies to enter into long-term fuel supply contracts, fueling production growth and speeding up innovation in biomass and green hydrogen methanol production.
Market Restraints:
High production costs associated with renewable hydrogen and carbon capture infrastructure are limiting large-scale commercial affordability of green methanol projects: The cost of producing green methanol is substantially higher compared to traditional methanol because of high costs associated with renewable energy, electrolyzers, and carbon capture techniques. Scaling up and installing such large projects needs huge financial resources for handling the materials needed in production, storage and transportation. Instability in renewable energy generation and inefficiency increases production cost. Many industries are still not ready to make the shift because of unstable pricing and low immediate economic benefits. Small industries may have challenges with getting funding for such sustainable energy projects. Lack of proper incentives and infrastructure for renewables in some developing countries is also an impediment.
Market Opportunities:
Expanding government incentives and international carbon reduction policies are encouraging large-scale investments in renewable fuel infrastructure development globally: Governments across the globe are implementing policies such as subsidies, tax benefits, and carbon-cutting laws in an attempt to promote the use of renewable fuels and decarbonize industries. The green methanol industry is experiencing favorable regulations that advocate the use of low-carbon maritime fuels, renewable chemicals, and renewable energy sources. Global climate change agreements have led to industries cutting down their reliance on fossil-based feedstocks and adopting sustainable materials. Research and development of renewable hydrogen and carbon capture systems are being funded by various governments. Cooperation between energy firms, shipping firms, and chemical companies is fostering strong partnerships. All these factors will contribute to the growth of the global green methanol market in the future.
Recent Developments:
-
2026: HIF Global accelerated international e-fuels infrastructure development focused on green methanol and synthetic fuel production, supporting maritime and industrial decarbonization initiatives through renewable hydrogen integration.
-
2025: European Energy and Mitsui & Co. successfully produced industry-grade e-methanol at the Kassø Power-to-X facility in Denmark, recognized as the world’s largest commercial e-methanol plant using renewable electricity and biogenic CO₂ for sustainable shipping and industrial decarbonization.
-
2025: thyssenkrupp Uhde secured a FEED contract from Koppö Energia for a Finnish green methanol project designed to produce 450 metric tons daily using captured CO₂ and renewable hydrogen.
-
2024: BASF partnered with ICODOS and KIT to launch the world’s first fully automated and dynamically operated e-methanol plant, demonstrating scalable production using renewable hydrogen and captured carbon dioxide.
Green Methanol Market Key Players
-
Methanex Corporation
-
OCI N.V.
-
Carbon Recycling International
-
Enerkem Inc.
-
Proman AG
-
Södra
-
European Energy
-
Liquid Wind AB
-
Topsoe A/S
-
SunGas Renewables
-
GIDARA Energy
-
WasteFuel
-
Linde plc
-
Johnson Matthey Plc
-
thyssenkrupp Uhde GmbH
-
HIF Global
-
BASF SE
-
Mitsui & Co. Ltd.
-
C2X
-
Praj Industries Ltd.
Green Methanol Market Report Scope:
| Report Attributes | Details |
|---|---|
| Market Size in 2025 | USD 2.73 Billion |
| Market Size by 2035 | USD 43.85 Billion |
| CAGR | CAGR of 31.99% From 2026 to 2035 |
| Base Year | 2025 |
| Forecast Period | 2026-2035 |
| Historical Data | 2022-2024 |
| Report Scope & Coverage | Market Size, Segments Analysis, Competitive Landscape, Regional Analysis, DROC & SWOT Analysis, Forecast Outlook |
| Key Segments | • By Feedstock (Biomass, Green Hydrogen, and CCS) • By Derivative (Formaldehyde, Biodiesel, Dimethyl Ether & Methyl Tert-Butyl Ether, Gasoline, Methyl Methacrylate, Methanol-To-Olefin, Solvents, Acetic Acid, and Others) • By Application (Chemical Feedstock, Fuel, and Others) |
| Regional Analysis/Coverage | North America (US, Canada), Europe (Germany, UK, France, Italy, Spain, Russia, Poland, Rest of Europe), Asia Pacific (China, India, Japan, South Korea, Australia, ASEAN Countries, Rest of Asia Pacific), Middle East & Africa (UAE, Saudi Arabia, Qatar, South Africa, Rest of Middle East & Africa), Latin America (Brazil, Argentina, Mexico, Colombia, Rest of Latin America). |
| Company Profiles | Methanex Corporation, OCI N.V., Carbon Recycling International, Enerkem Inc., Proman AG, Södra, European Energy, Liquid Wind AB, Topsoe A/S, SunGas Renewables, GIDARA Energy, WasteFuel, Linde plc, Johnson Matthey Plc, thyssenkrupp Uhde GmbH, HIF Global, BASF SE, Mitsui & Co. Ltd., C2X, Praj Industries Ltd. |
Frequently Asked Questions
North America dominated the Green Methanol Market in 2025.
The Biomass segment dominated the Green Methanol Market in 2025.
Expanding maritime decarbonization initiatives and low-emission fuel adoption are accelerating commercial demand for renewable methanol across shipping operations.
The Green Methanol Market was valued at USD 2.73 billion in 2025.
The Green Methanol Market is expected to grow at a CAGR of 31.99% from 2026 to 2035.
Get in Touch
