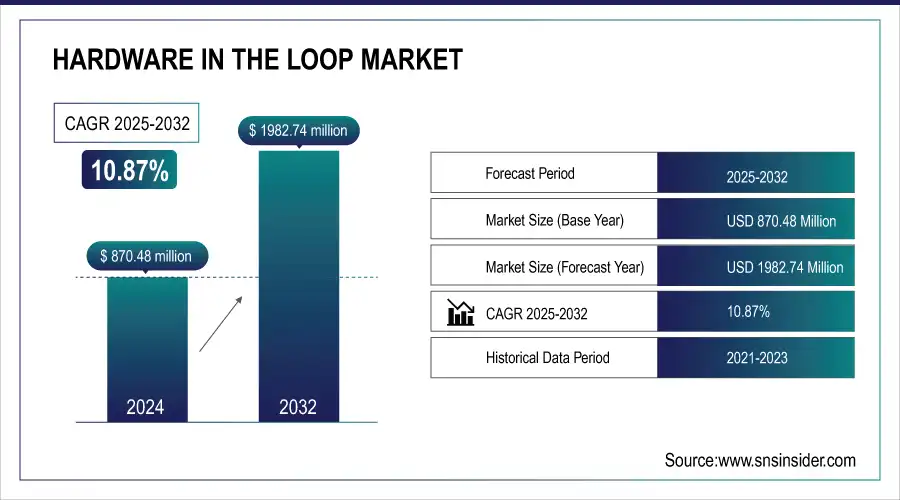
The Hardware in the Loop Market size was valued at USD 870.48 million in 2024 and is expected to reach USD 1982.74 million by 2032, growing at a CAGR of 10.87% over the forecast period 2025-2032.
The Hardware in the Loop market is primarily driven by the growing demand for advanced testing in the automotive and aerospace industries, the rising complexity of embedded systems, and the need for a cost-effective, real-time simulation solution. Rising usage of battery-electric vehicles and driverless technologies also stimulates market development in different enterprise verticals.
The Hardware in the Loop market is currently thriving because of its adoption in various renewable energy systems, robotics, and industrial automation. Continued regulatory pressure relating to product safety and compliance is leading to companies adopting more stringent validation approaches. Moreover, the recent introduction of digital twins and IoT technology is improving the edges of the testing environment, and is improving system models. The market is seeing investment in R&D infrastructure in emerging economies, leading to more avenues for HIL adoption across the education and industrial spectrum.
According to the International Federation of Robotics (IFR), global robot installations reached a record of over 500,000 units in 2023. HIL is used to test robot control algorithms before hardware deployment, especially in safety-critical applications like collaborative robots (cobots).
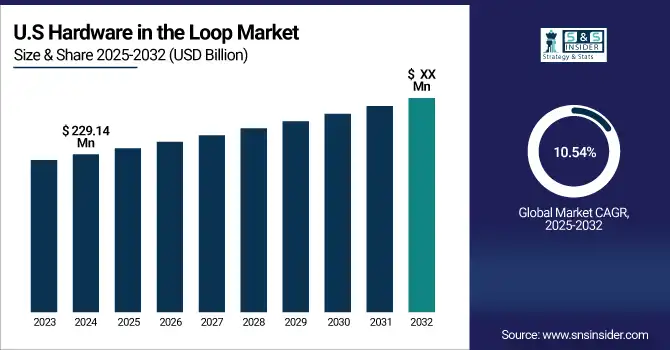
The U.S. Hardware in the Loop Market size is estimated to be USD 229.14 million in 2024 and is projected to grow at a CAGR of 10.54%. The U.S. hardware in the Loop market growth is driven by several factors such as demand for autonomous vehicles, strict safety regulations, and demand for high-end embedded system validation. Increasing application in defense modernization and smart grid development, and rapid IoT and AI integration in industrial automation, is further driving the growth.
Key Drivers:
Rising Demand for HIL Simulation Drives Innovation in Automotive, Aerospace, and Industrial Sectors
The increasing complexity of embedded systems in automotive, aerospace, and industrial sectors is fuelling the demand for the global Hardware in the Loop market. The booming trend of autonomous and electrified vehicles is making more and more real-time testing environments necessary to validate the control systems. Hardware in Safe Loop (HIL) simulation allows for low-cost yet high-accuracy validation of electronic control units (ECUs), thereby significantly minimizing risks and development cycles. It aligns with the strict compliance and regulatory scrutiny for safety-critical applications in aerospace and defense, where it also integrates capabilities to simulate mission scenarios and environmental conditions.
Fiat Chrysler Automobiles (FCA) developed a HIL testbed for functional analysis of multiple control units in hybrid electric vehicles. The system effectively verified functionalities shared among ECUs dedicated to internal combustion engines, transmissions, brakes, and electric motors.
Restrain:
High Costs and Integration Challenges Hinder Adoption of HIL Simulation for SMEs
The high initial cost for HIL setup, combined with the high expenses on specific hardware, software licenses, and skilled personnel, is acting as a major restraint for the Hardware in the Loop market. That could be a huge obstacle to small and medium enterprises (SMEs) or institutions with low R&D budgets. Furthermore, the integration of HIL systems into existing development workflows is not straightforward, as it often involves significant customization, resulting in delays in deployments and increased operating expenses.
Opportunity:
Digital Transformation and Emerging Technologies Drive Adoption of HIL Simulation Globally
Changing global digital transformation trends and the introduction of new technologies are acting as a catalyst for newer avenues for the adoption of HIL simulation. Digital twins and IoT platforms can enable even smarter, data-driven simulation environments. HIL is being extensively used to validate power electronics and control algorithms for sectors such as renewable energy, smart grid systems, and electric mobility. Also, significant expansion potential exists with an increase in research and development investments, particularly in emerging economies in the Asia-Pacific region, Latin America, and Eastern Europe.
Equinor's project utilized digital twins to monitor and predict turbine performance, leading to a reduction of 200,000 tons of CO₂ and 1,000 tons of NOx emissions annually by replacing gas turbines with wind energy
Challenges:
Technological Advancements and Protocol Incompatibility Challenge HIL System Adoption Across Industries
The fast-paced nature of technological innovation is another challenge, as HIL systems tend to become obsolete and cannot keep up with the latest requirements of embedded systems and real-time simulations. This poses a technical challenge to ensure compatibility with new protocols for communication, new standards, and new types of increasingly complex control algorithms. There is also a shortcoming in the uniformity of testing protocol across verticals, which leads to difficulties in adopting widespread patterns and benchmarking in industries such as aerospace, automotive, and energy as well.
By Type
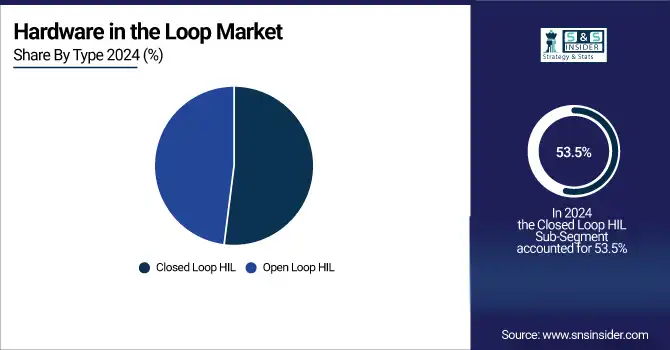
In 2024, the Closed Loop Hardware in the Loop segment dominated the global market, accounting for a 53.5% share. This is due to its extensive feedback mechanisms that offer the possibility of real-time feedback between the controller and all simulated systems, enabling a high level of accuracy and reliability when testing complex embedded systems, especially for automotive and aerospace systems.
The Open Loop HIL segment is expected to achieve the highest CAGR during the years 2025 to 2032. This trend is being propelled by the increasing need for more efficient yet economical testing solutions, especially during early-stage development. Open-loop HIL systems are flexible and easily implementable, making them a perfect fit for early software validation and academic use cases.
By Application
In 2024, the automotive sector was the largest end-use industry in the Hardware in the Loop market, with a share of 41.5% of the total revenue. The growing share is aided by factors such as electronic control unit (ECU) complexity, the proliferation of electric vehicles (EVs), and advancements in autonomous driving technology. HIL simulation is an essential tool in automotive R&D since it allows the efficient and risk-free testing of vehicle components, like ADAS, powertrains, and battery management systems.
The aerospace and defense sector is projected to post the highest CAGR from 2025 to 2032. Increasing demand for HIL simulation in the aerospace and defense market is determined by the growing requirement for safe, cost-effective, high-fidelity testing environments for critical systems (avionics, flight control, and mission systems). As aircraft systems continue to evolve into software-driven solutions, rapid adoption of real-time simulation without physical prototypes is becoming important for its use in aerospace & defense applications.
By Offering
The Hardware-to-loop (HIL) simulation market was dominated by the hardware segment in 2024, with an overall market share of 54.7%. Hardware has a major role in the physical modeling of real-time systems, including controllers, sensors of various types, and actuators. Hardware-in-the-loop (HIL) systems are popular with a strong accuracy and reliability, which are widely applied in automotive, aerospace, and industrial automation industries for real-time physical simulation tests of the embedded systems and components.
The fastest CAGR during the period 2025 to 2032 is projected for software. Software solutions are getting better & better, enabling the most flexible and scalable testing environments. They enable a complex simulation environment and easy changing without hardware modification. This rapid growth of the software segment can be attributed to the increasing demand for flexible, economical, and remote testing solutions for industries including automotive (for autonomous vehicle testing) and aerospace (for software-driven avionics systems).
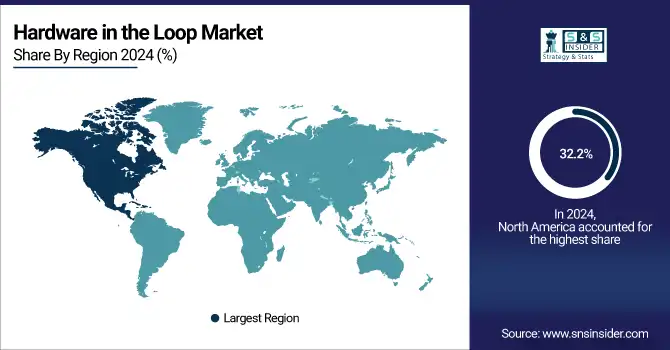
North America accounted for the largest number of the Hardware in the Loop market share with 32.2% of total revenue in 2024. This dominance is primarily due to the existence of major sectors like automotive, aerospace, and defense that depend on HIL simulation for product development and assessment. For example, HIL simulation is utilized for ADAS and electric vehicle components testing at General Motors and Ford. Furthermore, North America holds great potential for demand for hardware-in-the-loop as companies, including Lockheed Martin and Raytheon, use HIL for testing complicated avionics and defense systems.
The US tops the HIL simulation market owing to a strong automotive, aerospace & defense industry and high R&D investments. Innovation, led by a backdrop of heavy technological infrastructure, continuously encourages greater adoption.
From 2025 to 2032, Asia Pacific is projected to observe the highest CAGR. Countries like China, Japan, and India have seen an increase in manufacturing practices, and the quick industrialization of the region is driving the demand for HIL simulations. Companies such as Toyota and Honda are realizing the potential of HIL simulation for autonomous vehicle development in Japan.
Hardware-in-Loop (HIL) Simulation Market, China to Lead the Asia Pacific HIL Simulation Market. The fast pace of industrialization and considerable investment in aerospace and automotive sectors, for example, in the use of HIL for testing avionics by the AVIC, is a factor that determines the growth of the market.
The Hardware in the Loop market in Europe is a crucial market in this global market because of Europe's strengths in the automotive and aerospace industries, as well as industrial automation. And countries such as Germany, the UK, and France are leading the way, with the likes of BMW, Airbus, and Rolls-Royce already using HIL simulation as an integral part of their product development processes. The rise in the demand for HIL is attributed to increasing electric mobility, sustainable manufacturing, as well as stringent safety regulations in the region.
The Hardware-in-the-Loop (HIL) Simulation Market in Europe was led by Germany. Dominated by a vibrant automotive industry, where automotive giants such as BMW, Audi, and Volkswagen used HIL for advanced vehicle testing, and especially in electric and autonomous systems.
The market in the Middle East & Africa (MEA) is estimated to grow at a slow pace due to limited investments in automotive testing, aerospace, and industrial automation in this region. The demand for real-time simulation and testing tools is also driven by the diversification strategies of countries such as the UAE and Saudi Arabia, which are looking to diversify their economies away from oil and focus on smart mobility, defense modernization, and advanced manufacturing.
Some of the major Hardware in the Loop companies are dSPACE, National Instruments, Vector Informatik, Siemens, Typhoon HIL, Speedgoat, Opal-RT, Eontronix, Robert Bosch Engineering, and ModelingTech Energy.
In July 2023, FEV and dSPACE partnered to globally deliver customized power HIL test benches, enhancing validation of power electronics in electric mobility. The collaboration combines FEV’s automation expertise with dSPACE’s HIL systems for turnkey testing solutions.
In August 2024, Siemens' Simcenter Prescan 2407 introduces a scalable, hardware-agnostic Hardware-in-the-Loop (HiL) framework, enhancing real-time sensor data transfer and enabling modular testing setups.
Report Attributes | Details |
---|---|
Market Size in 2024 | USD 870.48 Million |
Market Size by 2032 | USD 1982.74 Million |
CAGR | CAGR of 10.87% From 2025 to 2032 |
Base Year | 2024 |
Forecast Period | 2025-2032 |
Historical Data | 2021-2023 |
Report Scope & Coverage | Market Size, Segments Analysis, Competitive Landscape, Regional Analysis, DROC & SWOT Analysis, Forecast Outlook |
Key Segments | • By Type (Open Loop HIL, Closed Loop HIL) • By Application (Automotive, Aerospace & Defense, Electronics and Semiconductor, Industrial Equipment, Research and Education, Energy and Power, Others) • By Offering (Hardware, Software, Service) |
Regional Analysis/Coverage | North America (US, Canada, Mexico), Europe (Germany, France, UK, Italy, Spain, Poland, Turkey, Rest of Europe), Asia Pacific (China, India, Japan, South Korea, Singapore, Australia, Rest of Asia Pacific), Middle East & Africa (UAE, Saudi Arabia, Qatar, South Africa, Rest of Middle East & Africa), Latin America (Brazil, Argentina, Rest of Latin America) |
Company Profiles | dSPACE, National Instruments, Vector Informatik, Siemens, Typhoon HIL, Speedgoat, Opal-RT, Eontronix, Robert Bosch Engineering, and ModelingTech Energy. |
Ans: The Hardware-in-the-Loop (HIL) Simulation Market is expected to grow at a CAGR of 10.87% from 2025-2032.
Ans: The Hardware-in-the-Loop (HIL) Simulation Market size was USD 870.48 million in 2024 and is expected to reach USD 1982.74 million by 2032.
Ans: The major growth factor of the HIL simulation market is the increasing demand for real-time testing in complex embedded systems across industries.
Ans: The Closed Loop HIL segment dominated the Hardware-in-the-Loop (HIL) Simulation Market in 2024.
Ans: North America dominated the Hardware-in-the-Loop (HIL) Simulation Market in 2024.
Table of Contents
1. Introduction
1.1 Market Definition
1.2 Scope (Inclusion and Exclusions)
1.3 Research Assumptions
2. Executive Summary
2.1 Market Overview
2.2 Regional Synopsis
2.3 Competitive Summary
3. Research Methodology
3.1 Top-Down Approach
3.2 Bottom-up Approach
3.3. Data Validation
3.4 Primary Interviews
4. Market Dynamics Impact Analysis
4.1 Market Driving Factors Analysis
4.1.1 Drivers
4.1.2 Restraints
4.1.3 Opportunities
4.1.4 Challenges
4.2 PESTLE Analysis
4.3 Porter’s Five Forces Model
5. Statistical Insights and Trends Reporting
5.1 Adoption in Electric Vehicles (EVs)
5.2 Integration with AI and Machine Learning
5.3 Integration with Digital Twins
5.4 Impact of Industry 4.0
6. Competitive Landscape
6.1 List of Major Companies, By Region
6.2 Market Share Analysis, By Region
6.3 Product Benchmarking
6.3.1 Product specifications and features
6.3.2 Pricing
6.4 Strategic Initiatives
6.4.1 Marketing and Promotional Activities
6.4.2 Distribution and Supply Chain Strategies
6.4.3 Expansion plans and new product launches
6.4.4 Strategic partnerships and collaborations
6.5 Technological Advancements
6.6 Market Positioning and Branding
7. Hardware-in-the-Loop (HIL) Simulation Market Segmentation, By Type
7.1 Chapter Overview
7.2 Open Loop HIL
7.2.1 Open Loop HIL Market Trends Analysis (2020-2032)
7.2.2 Open Loop HIL Market Size Estimates and Forecasts to 2032 (USD Million)
7.3 Closed Loop HIL
7.3.1 Closed Loop HIL Market Trends Analysis (2020-2032)
7.3.2 Closed Loop HIL Market Size Estimates and Forecasts to 2032 (USD Million)
8. Hardware-in-the-Loop (HIL) Simulation Market Segmentation, By Application
8.1 Chapter Overview
8.2 Automotive
8.2.1 Automotive Market Trends Analysis (2020-2032)
8.2.2 Automotive Market Size Estimates and Forecasts to 2032 (USD Million)
8.3 Aerospace & Defense
8.3.1 Aerospace & Defense Market Trends Analysis (2020-2032)
8.3.2 Aerospace & Defense Market Size Estimates and Forecasts to 2032 (USD Million)
8.4 Electronics and Semiconductor
8.4.1 Electronics and Semiconductor Market Trends Analysis (2020-2032)
8.4.2 Electronics and Semiconductor Market Size Estimates and Forecasts to 2032 (USD Million)
8.5 Industrial Equipment
8.5.1 Industrial Equipment Market Trends Analysis (2020-2032)
8.5.2 Industrial Equipment Market Size Estimates and Forecasts to 2032 (USD Million)
8.6 Research and Education
8.6.1 Research and Education Market Trends Analysis (2020-2032)
8.6.2 Research and Education Market Size Estimates and Forecasts to 2032 (USD Million)
8.7 Energy and Power
8.7.1 Energy and Power Market Trends Analysis (2020-2032)
8.7.2 Energy and Power Market Size Estimates and Forecasts to 2032 (USD Million)
8.8 Others
8.8.1 Others Market Trends Analysis (2020-2032)
8.8.2 Others Market Size Estimates and Forecasts to 2032 (USD Million)
9. Hardware-in-the-Loop (HIL) Simulation Market Segmentation, By Offering
9.1 Chapter Overview
9.2 Hardware
9.2.1 Hardware Market Trends Analysis (2020-2032)
9.2.2 Hardware Market Size Estimates and Forecasts to 2032 (USD Million)
9.3 Software
9.3.1 Software Market Trends Analysis (2020-2032)
9.3.2 Software Market Size Estimates and Forecasts to 2032 (USD Million)
9.4 Service
9.4.1 Service Market Trends Analysis (2020-2032)
9.4.2 Service Market Size Estimates and Forecasts to 2032 (USD Million)
10. Regional Analysis
10.1 Chapter Overview
10.2 North America
10.2.1 Trends Analysis
10.2.2 North America Hardware-in-the-Loop (HIL) Simulation Market Estimates and Forecasts, by Country (2020-2032) (USD Million)
10.2.3 North America Hardware-in-the-Loop (HIL) Simulation Market Estimates and Forecasts, By Type (2020-2032) (USD Million)
10.2.4 North America Hardware-in-the-Loop (HIL) Simulation Market Estimates and Forecasts, By Application (2020-2032) (USD Million)
10.2.5 North America Hardware-in-the-Loop (HIL) Simulation Market Estimates and Forecasts, By Offering (2020-2032) (USD Million)
10.2.6 USA
10.2.6.1 USA Hardware-in-the-Loop (HIL) Simulation Market Estimates and Forecasts, By Type (2020-2032) (USD Million)
10.2.6.2 USA Hardware-in-the-Loop (HIL) Simulation Market Estimates and Forecasts, By Application (2020-2032) (USD Million)
10.2.6.3 USA Hardware-in-the-Loop (HIL) Simulation Market Estimates and Forecasts, By Offering (2020-2032) (USD Million)
10.2.7 Canada
10.2.7.1 Canada Hardware-in-the-Loop (HIL) Simulation Market Estimates and Forecasts, By Type (2020-2032) (USD Million)
10.2.7.2 Canada Hardware-in-the-Loop (HIL) Simulation Market Estimates and Forecasts, By Application (2020-2032) (USD Million)
10.2.7.3 Canada Hardware-in-the-Loop (HIL) Simulation Market Estimates and Forecasts, By Offering (2020-2032) (USD Million)
10.2.8 Mexico
10.2.8.1 Mexico Hardware-in-the-Loop (HIL) Simulation Market Estimates and Forecasts, By Type (2020-2032) (USD Million)
10.2.8.2 Mexico Hardware-in-the-Loop (HIL) Simulation Market Estimates and Forecasts, By Application (2020-2032) (USD Million)
10.2.8.3 Mexico Hardware-in-the-Loop (HIL) Simulation Market Estimates and Forecasts, By Offering (2020-2032) (USD Million)
10.3 Europe
10.3.1 Trends Analysis
10.3.2 Europe Hardware-in-the-Loop (HIL) Simulation Market Estimates and Forecasts, by Country (2020-2032) (USD Million)
10.3.3 Europe Hardware-in-the-Loop (HIL) Simulation Market Estimates and Forecasts, By Type (2020-2032) (USD Million)
10.3.4 Europe Hardware-in-the-Loop (HIL) Simulation Market Estimates and Forecasts, By Application (2020-2032) (USD Million)
10.3.5 Europe Hardware-in-the-Loop (HIL) Simulation Market Estimates and Forecasts, By Offering (2020-2032) (USD Million)
10.3.6 Germany
10.3.6.1 Germany Hardware-in-the-Loop (HIL) Simulation Market Estimates and Forecasts, By Type (2020-2032) (USD Million)
10.3.6.2 Germany Hardware-in-the-Loop (HIL) Simulation Market Estimates and Forecasts, By Application (2020-2032) (USD Million)
10.3.6.3 Germany Hardware-in-the-Loop (HIL) Simulation Market Estimates and Forecasts, By Offering (2020-2032) (USD Million)
10.3.7 France
10.3.7.1 France Hardware-in-the-Loop (HIL) Simulation Market Estimates and Forecasts, By Type (2020-2032) (USD Million)
10.3.7.2 France Hardware-in-the-Loop (HIL) Simulation Market Estimates and Forecasts, By Application (2020-2032) (USD Million)
10.3.7.3 France Hardware-in-the-Loop (HIL) Simulation Market Estimates and Forecasts, By Offering (2020-2032) (USD Million)
10.3.8 UK
10.3.8.1 UK Hardware-in-the-Loop (HIL) Simulation Market Estimates and Forecasts, By Type (2020-2032) (USD Million)
10.3.8.2 UK Hardware-in-the-Loop (HIL) Simulation Market Estimates and Forecasts, By Application (2020-2032) (USD Million)
10.3.8.3 UK Hardware-in-the-Loop (HIL) Simulation Market Estimates and Forecasts, By Offering (2020-2032) (USD Million)
10.3.9 Italy
10.3.9.1 Italy Hardware-in-the-Loop (HIL) Simulation Market Estimates and Forecasts, By Type (2020-2032) (USD Million)
10.3.9.2 Italy Hardware-in-the-Loop (HIL) Simulation Market Estimates and Forecasts, By Application (2020-2032) (USD Million)
10.3.9.3 Italy Hardware-in-the-Loop (HIL) Simulation Market Estimates and Forecasts, By Offering (2020-2032) (USD Million)
10.3.10 Spain
10.3.10.1 Spain Hardware-in-the-Loop (HIL) Simulation Market Estimates and Forecasts, By Type (2020-2032) (USD Million)
10.3.10.2 Spain Hardware-in-the-Loop (HIL) Simulation Market Estimates and Forecasts, By Application (2020-2032) (USD Million)
10.3.10.3 Spain Hardware-in-the-Loop (HIL) Simulation Market Estimates and Forecasts, By Offering (2020-2032) (USD Million)
10.3.11 Poland
10.3.11.1 Poland Hardware-in-the-Loop (HIL) Simulation Market Estimates and Forecasts, By Type (2020-2032) (USD Million)
10.3.11.2 Poland Hardware-in-the-Loop (HIL) Simulation Market Estimates and Forecasts, By Application (2020-2032) (USD Million)
10.3.11.4 Poland Hardware-in-the-Loop (HIL) Simulation Market Estimates and Forecasts, By Offering (2020-2032) (USD Million)
10.3.12 Turkey
10.3.12.1 Turkey Hardware-in-the-Loop (HIL) Simulation Market Estimates and Forecasts, By Type (2020-2032) (USD Million)
10.3.12.2 Turkey Hardware-in-the-Loop (HIL) Simulation Market Estimates and Forecasts, By Application (2020-2032) (USD Million)
10.3.12.3 Turkey Hardware-in-the-Loop (HIL) Simulation Market Estimates and Forecasts, By Offering (2020-2032) (USD Million)
10.3.13 Rest of Europe
10.3.13.1 Rest of Europe Hardware-in-the-Loop (HIL) Simulation Market Estimates and Forecasts, By Type (2020-2032) (USD Million)
10.3.13.2 Rest of Europe Hardware-in-the-Loop (HIL) Simulation Market Estimates and Forecasts, By Application (2020-2032) (USD Million)
10.3.13.3 Rest of Europe Hardware-in-the-Loop (HIL) Simulation Market Estimates and Forecasts, By Offering (2020-2032) (USD Million)
10.4 Asia Pacific
10.4.1 Trends Analysis
10.4.2 Asia Pacific Hardware-in-the-Loop (HIL) Simulation Market Estimates and Forecasts, by Country (2020-2032) (USD Million)
10.4.3 Asia Pacific Hardware-in-the-Loop (HIL) Simulation Market Estimates and Forecasts, By Type (2020-2032) (USD Million)
10.4.4 Asia Pacific Hardware-in-the-Loop (HIL) Simulation Market Estimates and Forecasts, By Application (2020-2032) (USD Million)
10.4.5 Asia Pacific Hardware-in-the-Loop (HIL) Simulation Market Estimates and Forecasts, By Offering (2020-2032) (USD Million)
10.4.6 China
10.4.6.1 China Hardware-in-the-Loop (HIL) Simulation Market Estimates and Forecasts, By Type (2020-2032) (USD Million)
10.4.6.2 China Hardware-in-the-Loop (HIL) Simulation Market Estimates and Forecasts, By Application (2020-2032) (USD Million)
10.4.6.3 China Hardware-in-the-Loop (HIL) Simulation Market Estimates and Forecasts, By Offering (2020-2032) (USD Million)
10.4.7 India
10.4.7.1 India Hardware-in-the-Loop (HIL) Simulation Market Estimates and Forecasts, By Type (2020-2032) (USD Million)
10.4.7.2 India Hardware-in-the-Loop (HIL) Simulation Market Estimates and Forecasts, By Application (2020-2032) (USD Million)
10.4.7.3 India Hardware-in-the-Loop (HIL) Simulation Market Estimates and Forecasts, By Offering (2020-2032) (USD Million)
10.4.8 Japan
10.4.8.1 Japan Hardware-in-the-Loop (HIL) Simulation Market Estimates and Forecasts, By Type (2020-2032) (USD Million)
10.4.8.2 Japan Hardware-in-the-Loop (HIL) Simulation Market Estimates and Forecasts, By Application (2020-2032) (USD Million)
10.4.8.3 Japan Hardware-in-the-Loop (HIL) Simulation Market Estimates and Forecasts, By Offering (2020-2032) (USD Million)
10.4.9 South Korea
10.4.9.1 South Korea Hardware-in-the-Loop (HIL) Simulation Market Estimates and Forecasts, By Type (2020-2032) (USD Million)
10.4.9.2 South Korea Hardware-in-the-Loop (HIL) Simulation Market Estimates and Forecasts, By Application (2020-2032) (USD Million)
10.4.9.3 South Korea Hardware-in-the-Loop (HIL) Simulation Market Estimates and Forecasts, By Offering (2020-2032) (USD Million)
10.4.10 Singapore
10.4.10.1 Singapore Hardware-in-the-Loop (HIL) Simulation Market Estimates and Forecasts, By Type (2020-2032) (USD Million)
10.4.10.2 Singapore Hardware-in-the-Loop (HIL) Simulation Market Estimates and Forecasts, By Application (2020-2032) (USD Million)
10.4.10.3 Singapore Hardware-in-the-Loop (HIL) Simulation Market Estimates and Forecasts, By Offering (2020-2032) (USD Million)
10.4.11 Australia
10.4.11.1 Australia Hardware-in-the-Loop (HIL) Simulation Market Estimates and Forecasts, By Type (2020-2032) (USD Million)
10.4.11.2 Australia Hardware-in-the-Loop (HIL) Simulation Market Estimates and Forecasts, By Application (2020-2032) (USD Million)
10.4.11.3 Australia Hardware-in-the-Loop (HIL) Simulation Market Estimates and Forecasts, By Offering (2020-2032) (USD Million)
10.4.12 Taiwan
10.4.12.1 Taiwan Hardware-in-the-Loop (HIL) Simulation Market Estimates and Forecasts, By Material Type (2020-2032) (USD Million)
10.4.12.2 Taiwan Hardware-in-the-Loop (HIL) Simulation Market Estimates and Forecasts, By Installation (2020-2032) (USD Million)
10.4.12.3 Taiwan Hardware-in-the-Loop (HIL) Simulation Market Estimates and Forecasts, By Offering Industry (2020-2032) (USD Million)
10.4.13 Rest of Asia Pacific
10.4.13.1 Rest of Asia Pacific Hardware-in-the-Loop (HIL) Simulation Market Estimates and Forecasts, By Type (2020-2032) (USD Million)
10.4.13.2 Rest of Asia Pacific Hardware-in-the-Loop (HIL) Simulation Market Estimates and Forecasts, By Application (2020-2032) (USD Million)
10.4.13.3 Rest of Asia Pacific Hardware-in-the-Loop (HIL) Simulation Market Estimates and Forecasts, By Offering (2020-2032) (USD Million)
10.5 Middle East and Africa
10.5.1 Middle East
10.5.1.1 Trends Analysis
10.5.1.2 Middle East Hardware-in-the-Loop (HIL) Simulation Market Estimates and Forecasts, by Country (2020-2032) (USD Million)
10.5.1.3 Middle East Hardware-in-the-Loop (HIL) Simulation Market Estimates and Forecasts, By Type (2020-2032) (USD Million)
10.5.1.4 Middle East Hardware-in-the-Loop (HIL) Simulation Market Estimates and Forecasts, By Application (2020-2032) (USD Million)
10.5.1.5 Middle East Hardware-in-the-Loop (HIL) Simulation Market Estimates and Forecasts, By Offering (2020-2032) (USD Million)
10.5.1.6 UAE
10.5.1.6.1 UAE Hardware-in-the-Loop (HIL) Simulation Market Estimates and Forecasts, By Type (2020-2032) (USD Million)
10.5.1.6.2 UAE Hardware-in-the-Loop (HIL) Simulation Market Estimates and Forecasts, By Application (2020-2032) (USD Million)
10.5.1.6.3 UAE Hardware-in-the-Loop (HIL) Simulation Market Estimates and Forecasts, By Offering (2020-2032) (USD Million)
10.5.1.7 Saudi Arabia
10.5.1.7.1 Saudi Arabia Hardware-in-the-Loop (HIL) Simulation Market Estimates and Forecasts, By Type (2020-2032) (USD Million)
10.5.1.7.2 Saudi Arabia Hardware-in-the-Loop (HIL) Simulation Market Estimates and Forecasts, By Application (2020-2032) (USD Million)
10.5.1.7.3 Saudi Arabia Hardware-in-the-Loop (HIL) Simulation Market Estimates and Forecasts, By Offering (2020-2032) (USD Million)
10.5.1.8 Qatar
10.5.1.8.1 Qatar Hardware-in-the-Loop (HIL) Simulation Market Estimates and Forecasts, By Type (2020-2032) (USD Million)
10.5.1.8.2 Qatar Hardware-in-the-Loop (HIL) Simulation Market Estimates and Forecasts, By Application (2020-2032) (USD Million)
10.5.1.8.3 Qatar Hardware-in-the-Loop (HIL) Simulation Market Estimates and Forecasts, By Offering (2020-2032) (USD Million)
10.5.1.9 South Africa
10.5.1.9.1 South Africa Hardware-in-the-Loop (HIL) Simulation Market Estimates and Forecasts, By Type (2020-2032) (USD Million)
10.5.1.9.2 South Africa Hardware-in-the-Loop (HIL) Simulation Market Estimates and Forecasts, By Application (2020-2032) (USD Million)
10.5.1.9.3 South Africa Hardware-in-the-Loop (HIL) Simulation Market Estimates and Forecasts, By Offering (2020-2032) (USD Million)
10.5.1.10 Rest of Middle East & Africa
10.5.1.10.1 Rest of Middle East & Africa Hardware-in-the-Loop (HIL) Simulation Market Estimates and Forecasts, By Type (2020-2032) (USD Million)
10.5.1.10.2 Rest of Middle East & Africa Hardware-in-the-Loop (HIL) Simulation Market Estimates and Forecasts, By Application (2020-2032) (USD Million)
10.5.1.10.3 Rest of Middle East & Africa Hardware-in-the-Loop (HIL) Simulation Market Estimates and Forecasts, By Offering (2020-2032) (USD Million)
10.6 Latin America
10.6.1 Trends Analysis
10.6.2 Latin America Hardware-in-the-Loop (HIL) Simulation Market Estimates and Forecasts, by Country (2020-2032) (USD Million)
10.6.3 Latin America Hardware-in-the-Loop (HIL) Simulation Market Estimates and Forecasts, By Type (2020-2032) (USD Million)
10.6.4 Latin America Hardware-in-the-Loop (HIL) Simulation Market Estimates and Forecasts, By Application (2020-2032) (USD Million)
10.6.5 Latin America Hardware-in-the-Loop (HIL) Simulation Market Estimates and Forecasts, By Offering (2020-2032) (USD Million)
10.6.6 Brazil
10.6.6.1 Brazil Hardware-in-the-Loop (HIL) Simulation Market Estimates and Forecasts, By Type (2020-2032) (USD Million)
10.6.6.2 Brazil Hardware-in-the-Loop (HIL) Simulation Market Estimates and Forecasts, By Application (2020-2032) (USD Million)
10.6.6.3 Brazil Hardware-in-the-Loop (HIL) Simulation Market Estimates and Forecasts, By Offering (2020-2032) (USD Million)
10.6.7 Argentina
10.6.7.1 Argentina Hardware-in-the-Loop (HIL) Simulation Market Estimates and Forecasts, By Type (2020-2032) (USD Million)
10.6.7.2 Argentina Hardware-in-the-Loop (HIL) Simulation Market Estimates and Forecasts, By Application (2020-2032) (USD Million)
10.6.7.3 Argentina Hardware-in-the-Loop (HIL) Simulation Market Estimates and Forecasts, By Offering (2020-2032) (USD Million)
10.6.8 Rest of Latin America
10.6.8.1 Rest of Latin America Hardware-in-the-Loop (HIL) Simulation Market Estimates and Forecasts, By Type (2020-2032) (USD Million)
10.6.8.2 Rest of Latin America Hardware-in-the-Loop (HIL) Simulation Market Estimates and Forecasts, By Application (2020-2032) (USD Million)
10.6.8.3 Rest of Latin America Hardware-in-the-Loop (HIL) Simulation Market Estimates and Forecasts, By Offering (2020-2032) (USD Million)
11. Company Profiles
11.1 dSPACE GmbH.
11.1.1 Company Overview
11.1.2 Financial
11.1.3 Products/ Services Offered
11.1.4 SWOT Analysis
11.2 National Instruments Corporation (NI)
11.2.1 Company Overview
11.2.2 Financial
11.2.3 Products/ Services Offered
11.2.4 SWOT Analysis
11.3 Vector Informatik GmbH.
11.3.1 Company Overview
11.3.2 Financial
11.3.3 Products/ Services Offered
11.3.4 SWOT Analysis
11.4 Siemens Digital Industries Software.
11.4.1 Company Overview
11.4.2 Financial
11.4.3 Products/ Services Offered
11.4.4 SWOT Analysis
11.5 Typhoon HIL, Inc.
11.5.1 Company Overview
11.5.2 Financial
11.5.3 Products/ Services Offered
11.5.4 SWOT Analysis
11.6 Speedgoat GmbH
11.6.1 Company Overview
11.6.2 Financial
11.6.3 Products/ Services Offered
11.6.4 SWOT Analysis
11.7 Opal-RT Technologies Inc
11.7.1 Company Overview
11.7.2 Financial
11.7.3 Products/ Services Offered
11.7.4 SWOT Analysis
11.8 Eontronix Co., Ltd.
11.8.1 Company Overview
11.8.2 Financial
11.8.3 Products/ Services Offered
11.8.4 SWOT Analysis
11.9 Robert Bosch Engineering and Business Solutions (RBEI)
11.9.1 Company Overview
11.9.2 Financial
11.9.3 Products/ Services Offered
11.9.4 SWOT Analysis
11.10 ModelingTech Energy Co., Ltd.
11.10.1 Company Overview
11.10.2 Financial
11.10.3 Products/ Services Offered
11.10.4 SWOT Analysis
12. Use Cases and Best Practices
13. Conclusion
An accurate research report requires proper strategizing as well as implementation. There are multiple factors involved in the completion of good and accurate research report and selecting the best methodology to compete the research is the toughest part. Since the research reports we provide play a crucial role in any company’s decision-making process, therefore we at SNS Insider always believe that we should choose the best method which gives us results closer to reality. This allows us to reach at a stage wherein we can provide our clients best and accurate investment to output ratio.
Each report that we prepare takes a timeframe of 350-400 business hours for production. Starting from the selection of titles through a couple of in-depth brain storming session to the final QC process before uploading our titles on our website we dedicate around 350 working hours. The titles are selected based on their current market cap and the foreseen CAGR and growth.
The 5 steps process:
Step 1: Secondary Research:
Secondary Research or Desk Research is as the name suggests is a research process wherein, we collect data through the readily available information. In this process we use various paid and unpaid databases which our team has access to and gather data through the same. This includes examining of listed companies’ annual reports, Journals, SEC filling etc. Apart from this our team has access to various associations across the globe across different industries. Lastly, we have exchange relationships with various university as well as individual libraries.
Step 2: Primary Research
When we talk about primary research, it is a type of study in which the researchers collect relevant data samples directly, rather than relying on previously collected data. This type of research is focused on gaining content specific facts that can be sued to solve specific problems. Since the collected data is fresh and first hand therefore it makes the study more accurate and genuine.
We at SNS Insider have divided Primary Research into 2 parts.
Part 1 wherein we interview the KOLs of major players as well as the upcoming ones across various geographic regions. This allows us to have their view over the market scenario and acts as an important tool to come closer to the accurate market numbers. As many as 45 paid and unpaid primary interviews are taken from both the demand and supply side of the industry to make sure we land at an accurate judgement and analysis of the market.
This step involves the triangulation of data wherein our team analyses the interview transcripts, online survey responses and observation of on filed participants. The below mentioned chart should give a better understanding of the part 1 of the primary interview.
Part 2: In this part of primary research the data collected via secondary research and the part 1 of the primary research is validated with the interviews from individual consultants and subject matter experts.
Consultants are those set of people who have at least 12 years of experience and expertise within the industry whereas Subject Matter Experts are those with at least 15 years of experience behind their back within the same space. The data with the help of two main processes i.e., FGDs (Focused Group Discussions) and IDs (Individual Discussions). This gives us a 3rd party nonbiased primary view of the market scenario making it a more dependable one while collation of the data pointers.
Step 3: Data Bank Validation
Once all the information is collected via primary and secondary sources, we run that information for data validation. At our intelligence centre our research heads track a lot of information related to the market which includes the quarterly reports, the daily stock prices, and other relevant information. Our data bank server gets updated every fortnight and that is how the information which we collected using our primary and secondary information is revalidated in real time.
Step 4: QA/QC Process
After all the data collection and validation our team does a final level of quality check and quality assurance to get rid of any unwanted or undesired mistakes. This might include but not limited to getting rid of the any typos, duplication of numbers or missing of any important information. The people involved in this process include technical content writers, research heads and graphics people. Once this process is completed the title gets uploader on our platform for our clients to read it.
Step 5: Final QC/QA Process:
This is the last process and comes when the client has ordered the study. In this process a final QA/QC is done before the study is emailed to the client. Since we believe in giving our clients a good experience of our research studies, therefore, to make sure that we do not lack at our end in any way humanly possible we do a final round of quality check and then dispatch the study to the client.
Key Segments:
By Type
Open Loop HIL
Closed Loop HIL
By Application
Automotive
Aerospace & Defense
Electronics and Semiconductor
Industrial Equipment
Research and Education
Energy and Power
Others
By Offering
Hardware
Software
Service
Request for Segment Customization as per your Business Requirement: Segment Customization Request
Regional Coverage:
North America
US
Canada
Mexico
Europe
Germany
France
UK
Italy
Spain
Poland
Turkey
Rest of Europe
Asia Pacific
China
India
Japan
South Korea
Singapore
Australia
Taiwan
Rest of Asia Pacific
Middle East & Africa
UAE
Saudi Arabia
Qatar
South Africa
Rest of Middle East & Africa
Latin America
Brazil
Argentina
Rest of Latin America
Request for Country Level Research Report: Country Level Customization Request
Available Customization
With the given market data, SNS Insider offers customization as per the company’s specific needs. The following customization options are available for the report:
Detailed Volume Analysis
Criss-Cross segment analysis (e.g. Product X Application)
Competitive Product Benchmarking
Geographic Analysis
Additional countries in any of the regions
Customized Data Representation
Detailed analysis and profiling of additional market players
Next-Generation Solar Cell Market size was valued at USD 3.31 billion in 2024 and is expected to reach USD 14.11 billion by 2032, growing at a CAGR of 19.94% over the forecast period 2025-2032.
The Expanded Beam Cable Market Size was valued at $7.84 Billion in 2023 and is projected to reach $52.75 Billion by 2032, at a CAGR of 23.6% during 2024-2032
The Distributed Temperature Sensing Market Size was valued at USD 758.63 million in 2023 and is expected to grow at a CAGR of 7.04% During 2024-2032.
The Carbon Dioxide (CO2) Monitors Market Size was valued at USD 622.14 million in 2023, and is expected to reach USD 1340.10 million by 2032, and grow at a CAGR of 8.9% over the forecast period 2024-2032
The IR Camera Market Size was valued at USD 8.02 billion in 2023 and is projected to grow at a robust CAGR of 7.19% to reach USD 14.98 billion by 2032.
The Artificial Intelligence (AI) in Semiconductor Market Size was valued at USD 48.96 Billion in 2023 and is expected to grow at a CAGR of 15.2% From 2024-2032.
Hi! Click one of our member below to chat on Phone