Hematologic Malignancies Market Report Scope & Overview:
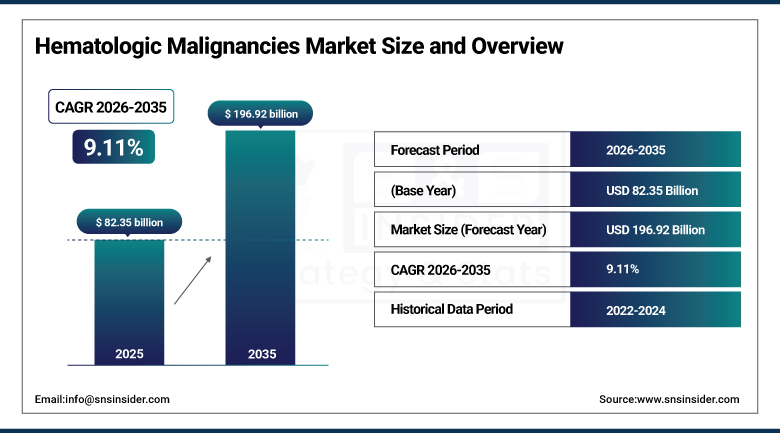
The Hematologic Malignancies Market was estimated at USD 82.35 Billion in 2025 and is expected to reach USD 196.92 Billion by 2035, growing at a CAGR of 9.11% over the forecast period of 2026-2035.
The Hematologic Malignancies Market is expanding owing to the high prevalence of blood cancers like lymphoma, leukemia, and multiple myelomas across the globe. The use of innovative treatment methods such as immunotherapy, targeted therapy, and chimeric antigen receptor T-cell (CAR-T) treatments is contributing towards better treatment results. Rising developments in diagnostic measures and high incidences of early diagnosis have also helped boost the demand for hematologic malignancies treatments.
The U.S. National Cancer Institute (NCI) reported in 2024 approximately 62,770 new leukemia cases, 89,380 lymphoma cases, and over 35,000 multiple myeloma cases, totaling more than 187,000 new hematologic cancer cases annually in the U.S., reflecting a substantial and growing disease burden.
FDA-reported clinical outcomes show that CAR-T cell therapies achieve overall response rates of around 70–90% in certain relapsed or refractory lymphoma and leukemia patients, demonstrating strong clinical efficacy and significantly improving treatment outcomes in difficult-to-treat hematologic malignancies cases.
Market Size and Forecast:
-
Market Size in 2025: USD 82.35 Billion
-
Market Size by 2035: USD 196.92 Billion
-
CAGR: 9.11% from 2026 to 2035
-
Base Year: 2025
-
Forecast Period: 2026–2035
-
Historical Data: 2022–2024
To Get more information on Hematologic Malignancies Market - Request Free Sample Report
Hematologic Malignancies Market Trends:
-
Rising incidence of blood cancers such as leukemia, lymphoma, and multiple myeloma is driving the hematologic malignancies market.
-
Growing adoption of targeted therapies, immunotherapies, and precision medicine is boosting market growth.
-
Expansion of diagnostic capabilities, including molecular testing and advanced imaging, is fueling early detection.
-
Increasing focus on personalized treatment approaches and improved survival outcomes is shaping adoption trends.
-
Advancements in CAR-T cell therapy, monoclonal antibodies, and next-generation sequencing are enhancing treatment efficacy.
-
Rising investments in oncology research and clinical trials are supporting market expansion.
-
Collaborations between pharmaceutical companies, research institutions, and healthcare providers are accelerating innovation and global adoption.
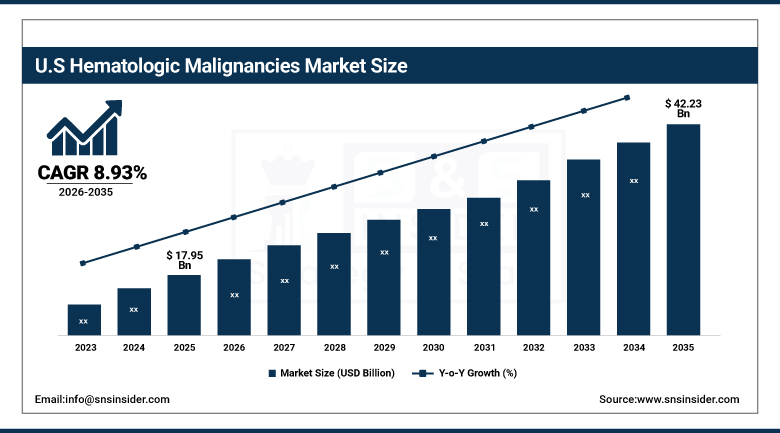
U.S. Hematologic Malignancies Market was valued at USD 17.95 Billion in 2025 and is expected to reach USD 42.23 Billion by 2035, growing at a CAGR of 8.93% from 2026-2035.
The U.S. hematologic malignancies market is witnessing a significant increase owing to an increasing number of blood cancer cases, strong acceptance of new technologies such as immunotherapy and CAR-T therapy, and high investments in healthcare. Other contributing factors include increasing clinical trials, advancements in drug development, and early detection technology.
Hematologic Malignancies Market Segment Highlights:
-
By Disease, Lymphoma segment dominated the Hematologic Malignancies Market in 2025 with 41% market share; Leukemia segment fastest growing (CAGR).
-
By Therapy, Chemotherapy segment dominated the Hematologic Malignancies Market in 2025 with 38% market share; Immunotherapy segment fastest growing (CAGR).
-
By End Use, Hospital Pharmacies segment dominated the Hematologic Malignancies Market in 2025 with 52% market share; Retail Pharmacies segment fastest growing (CAGR).
Hematologic Malignancies Market Segment Analysis:
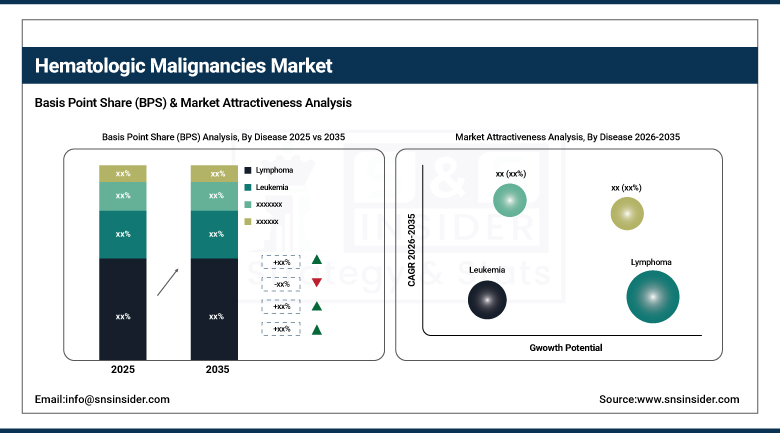
By Disease, Lymphoma segment dominates the Market, Leukemia segment expected to grow fastest
The Lymphoma segment held the largest share in the market in 2025 due to its high prevalence rate, efficient diagnosis, and existing treatment mechanisms that include chemotherapy, radiation, and targeted therapy. Ongoing innovations in monoclonal antibodies and combination therapies continue to improve outcomes, encouraging more patients to opt for treatments. Clinical attention, high disease awareness levels, and availability of novel treatment mechanisms further solidified the dominance of the Lymphoma segment in the market.
Leukemia segment is expected to grow the fastest rate throughout the forecast period. Rising incidences, genetic and lifestyle risk factors, and heightened disease awareness levels contribute significantly to the rapid growth of the segment. Innovations in precision medicine, CAR-T cell therapy, and targeted therapies continue to boost survival rates and encourage greater adoption of treatments. Growth in research pipelines and innovation-based therapy approvals contribute to the fast-paced growth of the Leukemia segment.
By Therapy, Chemotherapy segment dominates the Market, Immunotherapy segment expected to grow fastest
Chemotherapy segment accounted for the largest market share in 2025 attributed to its longstanding presence as the major therapeutic strategy for treating blood cancers. The segment holds a prominent position in the market as it offers various benefits including wide applications, proven clinical processes, and availability. Though novel strategies have emerged, chemotherapy is still an important mode of treatment that can be combined with others, hence its dominance in the market.
Immunotherapy segment is projected to register the highest growth rate over the forecast period attributable to the growing use of advanced treatment technologies, namely monoclonal antibodies, checkpoint inhibitors, and CAR-T cell therapies. These therapies have better efficacy rates and produce minimal side effects as compared to conventional therapy methods. Increasing investments in oncology research and development of novel drugs along with high success rates contribute to the growth of the market.
By End Use, Hospital Pharmacies segment dominates the Market, Retail Pharmacies segment expected to grow fastest
The Hospital Pharmacies segment captured a largest share of the Market in 2025 as a result of a large number of cancer treatments taking place in hospitals, as well as specialized oncology facilities. Hospital pharmacies guarantee immediate availability of advanced chemotherapy and immunotherapy medicines, making treatment management easier for seriously ill patients. The presence of advanced infrastructure, qualified health personnel, and effective treatment facilities also contributed to the dominance of the Hospital Pharmacies segment in the market.
The Retail Pharmacies segment is anticipated to experience the highest growth rate during the forecast period as a result of rising consumer preference for easy medication procurement, as well as the growing availability of outpatient cancer care services. The increased use of oral oncology medicine and supportive therapies has further fueled the importance of the Retail Pharmacies segment in treating cancer patients.
Regional Insights:
|
Region |
Major Country |
Share within Region (%) |
|---|---|---|
|
North America |
United States |
88.7% |
|
Europe |
United Kingdom |
20.6% |
|
Asia Pacific |
Australia |
7.5% |
|
Middle East & Africa |
UAE |
12.8% |
|
Latin America |
Brazil |
48.6% |
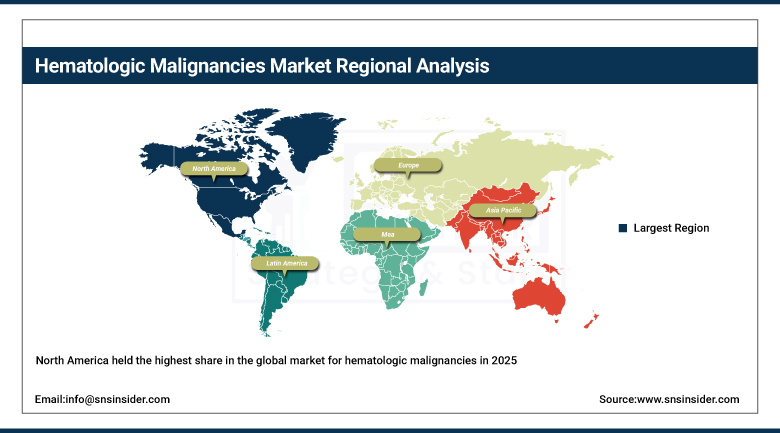
North America Hematologic Malignancies Market Insights
North America held the highest share in the global market for hematologic malignancies in 2025 owing to the higher prevalence rate of blood cancer, better healthcare infrastructure, and the presence of leading players from the pharma and biotech industries. Innovations in therapy, including immunotherapy, targeted therapy, and CAR-T cell therapy, have been adopted early by the region. Other factors contributing to market growth include substantial investment in research and development, positive reimbursement scenario, and active clinical trials.
Get Customized Report as per Your Business Requirement - Enquiry Now
Asia Pacific Hematologic Malignancies Market Insights
Asia Pacific is estimated to be the fastest growing region in terms of the growth potential for the Hematologic malignancies market on account of factors such as the prevalence of cancers, improvements in health care facilities, and advanced treatment options available in this region. Increased focus by governments on cancer education, improved hospital infrastructure, and rapid acceptance of novel therapies are some additional factors aiding market growth. Other growth drivers include increased clinical research and trials, patient pool availability, and reduced cost of treatments.
Europe Hematologic Malignancies Market Insights
Hematologic malignancies market in Europe is expected to grow at a stable rate owing to well-developed healthcare infrastructure, high level of awareness about cancer screening, and use of novel treatment options including immunotherapy and targeted drug therapy. Prevalence rates of lymphoma, leukemia, and multiple myelomas are contributing to the market's growth. Investments in research and development and favorable government policies are supporting the market. Moreover, collaboration between pharma and research organizations is fueling innovations in next generation blood cancers' treatments.
Middle East & Africa and Latin America Hematologic Malignancies Market Insights
Hematologic malignancies markets for the Middle East & Africa and Latin America are experiencing steady growth because of enhanced healthcare infrastructure and increased understanding of blood cancer treatment and detection. Increased funding in oncology centers, advancements in diagnostic tools, and greater governmental involvement are some of the factors contributing to market growth. Availability of innovative therapies and cost factors are among the significant obstacles that can hinder market growth. Nevertheless, increased partnerships between global drug firms and improved healthcare are anticipated to boost market growth in the coming years.
Market Dynamics:
Growth Drivers: Rising Incidence of Blood Cancer Cases and Expanding Diagnostic Awareness Driving Demand for Advanced Hematologic Malignancy Treatments Worldwide
The rise in the incidence rate of lymphoma, leukemia, and multiple myeloma is one of the key factors fueling the demand for solutions to treat such disorders. The aging population, genetic abnormalities, and various other risk factors associated with individuals’ lifestyles are responsible for increasing incidences of hematologic cancers. With improved diagnostic methods, increased screening, and higher awareness levels among people regarding their health, early diagnosis is becoming more common. Health organizations are giving priority to expanding oncology care and implementing chemotherapeutic and immunotherapy approaches, which is boosting the growth of this market.
Market Restraints: Severe Side Effects and Complex Treatment Procedures Reducing Patient Compliance and Limiting Adoption of Certain Therapies
The difficulties encountered with regard to complex and adverse side effects due to chemotherapy and other cancer treatments lower patient compliance and adherence to their treatment. Hematological cancer treatments take up more time and require frequent hospital visits and close monitoring, putting a burden on the patient in terms of both physically and emotionally. The effects such as immune compromise and fatigue can cause reluctance to undertake continuous therapy. Similarly, the complications surrounding the administration of high-efficiency therapy like CAR-T can limit the use of such treatments.
Market Opportunities: Expanding Development of Personalized Medicine and Genomic-Based Cancer Therapies Creating Strong Growth Opportunities in Oncology
The evolution of genomics and personalized medicine is opening up huge possibilities within the field of hematologic malignancies. The increasing utilization of genetic profiling and biomarkers is contributing to the creation of treatments that are both highly targeted and specific to the individual. The pharmaceutical sector is increasingly concentrating on precision oncology with the aim of making treatments more effective while minimizing potential side effects. More investments into genomics, artificial intelligence-powered drug discovery, and molecular diagnostics are rapidly advancing treatment innovations. Personalized immunotherapy treatments are also becoming more common and effective.
Recent Developments:
-
2026: Pfizer reported Phase 3 MagnetisMM-5 trial results showing ELREXFIO significantly improved progression-free survival in relapsed/refractory multiple myeloma, reinforcing its role in earlier-line treatment strategies.
-
2026: BMS accelerated antibody-drug conjugate and CAR-T pipeline expansion post-Seagen acquisition, strengthening its position in lymphoma and multiple myeloma treatment innovation.
-
2025: FDA approved ADCETRIS combination regimen for relapsed/refractory large B-cell lymphoma after Phase 3 ECHELON-3 showed significant survival improvement and reduced mortality risk, establishing new treatment option for heavily pretreated lymphoma patients.
-
2024: Takeda and Pfizer announced Phase 3 HD21 trial results showing ADCETRIS-based combination therapy improved progression-free survival in newly diagnosed advanced Hodgkin lymphoma, supporting ADCETRIS as backbone therapy in frontline treatment.
-
2024: Gilead/Kite continued expanding Yescarta and Tecartus CAR-T programs across B-cell lymphomas, reinforcing clinical benefits in relapsed/refractory large B-cell lymphoma and mantle cell lymphoma with durable remission outcomes.
Hematologic Malignancies Market Key Players:
-
Pfizer Inc.
-
F. Hoffmann-La Roche Ltd
-
Sanofi S.A.
-
Bristol-Myers Squibb Company
-
AbbVie Inc.
-
Novartis AG
-
Amgen Inc.
-
Johnson & Johnson (Janssen)
-
AstraZeneca plc
-
Takeda Pharmaceutical Company
-
Gilead Sciences Inc.
-
Eli Lilly and Company
-
GlaxoSmithKline plc
-
BeiGene (BeOne Medicines)
-
Incyte Corporation
-
Celgene (now part of Bristol-Myers Squibb)
-
Seagen Inc. (Pfizer oncology unit)
-
Kite Pharma (Gilead company)
-
Alexion Pharmaceuticals (AstraZeneca)
-
Merck & Co., Inc.
Hematologic Malignancies Market Report Scope:
| Report Attributes | Details |
|---|---|
| Market Size in 2025 | USD 82.35 Billion |
| Market Size by 2035 | USD 196.92 Billion |
| CAGR | CAGR of 9.11% From 2026 to 2035 |
| Base Year | 2025 |
| Forecast Period | 2026-2035 |
| Historical Data | 2022-2024 |
| Report Scope & Coverage | Market Size, Segments Analysis, Competitive Landscape, Regional Analysis, DROC & SWOT Analysis, Forecast Outlook |
| Key Segments | • By Disease (Lymphoma, Leukemia, and Myeloma) • By Therapy (Chemotherapy, Targeted Therapy, Immunotherapy, and Other Therapies) • By End Use (Retail Pharmacies, Hospital Pharmacies, and Others) |
| Regional Analysis/Coverage | North America (US, Canada), Europe (Germany, UK, France, Italy, Spain, Russia, Poland, Rest of Europe), Asia Pacific (China, India, Japan, South Korea, Australia, ASEAN Countries, Rest of Asia Pacific), Middle East & Africa (UAE, Saudi Arabia, Qatar, South Africa, Rest of Middle East & Africa), Latin America (Brazil, Argentina, Mexico, Colombia, Rest of Latin America). |
| Company Profiles | Pfizer Inc., F. Hoffmann-La Roche Ltd, Sanofi S.A., Bristol-Myers Squibb Company, AbbVie Inc., Novartis AG, Amgen Inc., Johnson & Johnson (Janssen), AstraZeneca plc, Takeda Pharmaceutical Company, Gilead Sciences Inc., Eli Lilly and Company, GlaxoSmithKline plc, BeiGene (BeOne Medicines), Incyte Corporation, Bristol-Myers Squibb (Celgene), Pfizer (Seagen), Gilead (Kite Pharma), AstraZeneca (Alexion), Merck & Co., Inc. |
Frequently Asked Questions
Ans: North America dominated the Hematologic Malignancies Market in 2025.
Ans: The Lymphoma segment dominated the Hematologic Malignancies Market in 2025.
Ans: Rising Incidence of Blood Cancer Cases and Expanding Diagnostic Awareness Driving Demand for Advanced Hematologic Malignancy Treatments Worldwide.
Ans: The Hematologic Malignancies Market was valued at USD 82.35 billion in 2025.
Ans: The Hematologic Malignancies Market is expected to grow at a CAGR of 9.11% from 2026 to 2035.
Get in Touch
