CAR T-Cell Therapies Market Report Scope and Overview:

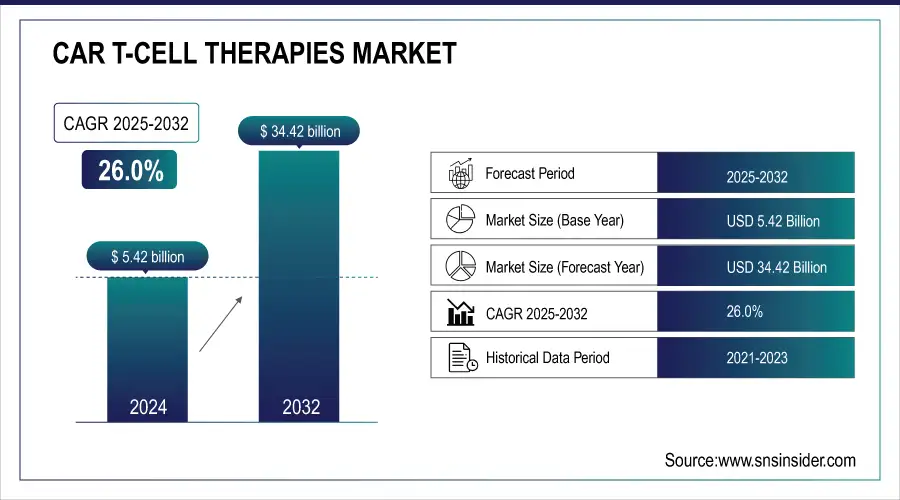
The CAR T-Cell Therapies Market was valued at USD 5.42 billion in 2024 and is expected to reach USD 34.42 billion by 2032 and grow at a CAGR of 26.0% over the forecast period of 2025-2032.


The CAR-T cell therapy market has been witnessing a tremendous boom due to some major driving factors such as cancer incidence, and product approvals as well as investment in the gene therapy space. Even with 2020, Cancer remains a significant global health issue with new cases worldwide exceeding 19 million and almost 10 million deaths caused by cancer, Globocan. The alarming trend has upped the stakes for intense and effective therapies like CAR-T, which has won more milestones than conventional therapies. Adoptive immunotherapy CAR-T is a form of therapy that modifies the T-cells of a patient to be able to target cancer cells more sensitively, an area of promise in conditions such as leukemia, lymphoma, and multiple myeloma.

Product Approvals have been one of the growth factors of the CAR-T market. These approvals of Yescarta, Tecartus, Kymriah, and Carvykti are expected to herald a shift away from the traditional treatment with small molecules and proteins toward cell therapies through adoption. For instance, market competition between companies has increased manifold since February 2022, when the U.S. FDA approved Yescarta as the first CAR-T therapy in relapsed or refractory large B-cell lymphoma (LBCL). The investments in manufacturing capacity, along with clinical research, have increased simultaneously with these approvals. More than 500 clinical trials involving CAR-T therapies have been conducted worldwide, with East Asia and the United States at the forefront of R&D. Particular momentum has been gained in the United States, particularly due to regulatory blessings and private investment.

CAR T-Cell Therapies Market Revenue Analysis

Get More Information on CAR T-Cell Therapies Market - Request Sample Report


CAR T-Cell Therapies Market Highlights:

  • The COVID-19 pandemic delayed CAR-T therapy development in 2020 due to postponed cancer diagnoses and healthcare disruptions, with recovery starting in 2021 as awareness increased and therapy approvals expanded

  • Growing prevalence of hematological cancers such as non-Hodgkin’s lymphoma and leukemia is driving higher adoption of CAR-T therapies globally

  • Advances in gene therapy platforms and significant investments, including Ori Biotech’s USD 100 million Series B funding in 2022, are accelerating commercialization and supply

  • Awareness initiatives and Patient Assistance Programs (PAPs) are improving treatment accessibility and adoption rates

  • Research into CRISPR and other gene-editing technologies is enhancing CAR-T therapy effectiveness, boosting market growth

  • High treatment costs due to complex manufacturing and administration processes limit access, particularly in low- and middle-income regions, and challenge healthcare system budgets

CAR T-Cell Therapies Market Size and Forecast:

  • Market Size in 2024: USD 5.42 Billion

  • Market Size by 2032: USD 34.42 Billion

  • CAGR (2025–2032): 26%

  • Base Year: 2024

  • Forecast Period: 2025–2032

  • Historical Data: 2021–2023

Although the pandemic is already problematic to deal with and thus delays 2020's development of the CAR-T therapy market, delayed diagnoses of cancer and disruptions in health services indicated that the pandemic may have even impacted the count of blood cancer diagnoses, which decreased during this period because such diseases may overlap with symptoms of COVID-19. However, 2021 was a year of recovery as awareness increased and approval for extended indications for CAR-T therapies expanded.

The companies have been constantly scaling up their production capacity to meet the growing demand, and further developments in gene therapy platforms have led to significant investment in the CAR-T space. In this regard, Series B funding of USD 100 million for Ori Biotech in 2022 has accelerated the commercialization of new gene therapies and led to higher supply levels of CAR-T therapies. This strong demand and supply dynamics coupled with further innovation is anticipated to drive growth over the forecast period as well.

CAR T-Cell Therapies Market Drivers:

  • Rising Prevalence of Hematological Cancers Drives Surge in CAR-T Cell Therapy Adoption

The rising prevalence of hematological cancers, such as non-Hodgkin’s lymphoma (NHL) and leukemia, is a critical driver for the growth of the CAR-T cell therapy market. With cancer cases expected to surge globally, the demand for innovative treatments like CAR-T therapy is on the rise. According to the International Agency for Research on Cancer (IARC), the global burden of cancer is projected to reach 27.5 million new cases by 2040, with 16.3 million cancer-related deaths. Similarly, the American Cancer Society estimates a significant increase in cancer cases, from 18.1 million in 2018 to 29.4 million by 2040, highlighting the growing need for advanced therapies.

Increased awareness about blood cancers, driven by initiatives from governments, healthcare agencies, and market players, is resulting in higher diagnosis and treatment rates. Patient Assistance Programs (PAPs) are also contributing to the wider adoption of CAR-T therapies by making treatments more accessible. The rising prevalence of non-Hodgkin’s lymphoma, in particular, is boosting the demand for CAR-T cell therapy. As reported by the American Society of Hematology, NHL is among the most common cancers, with 544,000 new cases and 260,000 deaths reported in 2022.

In addition, researchers are exploring new approaches like CRISPR gene-editing technology to enhance CAR-T therapies, further driving market growth. Overall, the increasing focus on developing novel therapies to treat blood cancers is expected to accelerate the adoption of CAR-T cell therapies during the forecast period.

CAR T-Cell Therapies Market Restraints:

  • High Cost of Treatment Limits the Adoption of CAR-T Cell Therapy

The high cost of CAR-T cell therapy significantly limits its widespread adoption, despite its proven efficacy in treating certain blood cancers. The treatment involves complex processes, including the extraction of a patient’s T-cells, genetic modification, and reinfusion, which require specialized facilities and highly skilled personnel. These factors drive the price of a single treatment to several hundred thousand dollars, making it inaccessible for many patients, especially in low- and middle-income countries. Additionally, insurance coverage and reimbursement policies are often limited, further restricting patient access. High costs also pose challenges for healthcare systems, impacting budget allocation and long-term sustainability. Consequently, while CAR-T therapy represents a breakthrough in personalized medicine, its adoption remains constrained by economic barriers.

CAR T-Cell Therapies Market Segment Analysis:
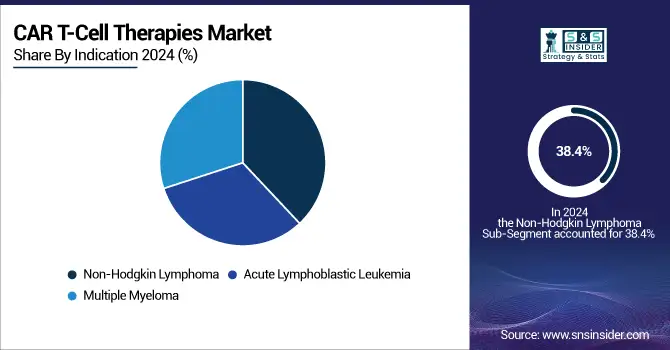
By Drug Type:

The Axicabtagene Ciloleucel (Yescarta) segment dominated the CAR-T cell therapy market with a 24.2% share in 2024, primarily due to its wide range of applications and high efficacy in treating non-Hodgkin lymphoma (NHL). Yescarta, approved by the FDA as the first CAR-T therapy for relapsed or refractory large B-cell lymphoma (LBCL), has gained significant traction. Additionally, Tisagenlecleucel (Kymriah), another key player, is widely used for treating pediatric and young adult patients with acute lymphoblastic leukemia (ALL), further boosting its adoption.

However, Ciltacabtagene Autoleucel (Carvykti) is projected to be the fastest-growing drug type in the market. Approved in 2022 for multiple myeloma, Carvykti has shown remarkable efficacy in patients with relapsed or refractory cases, leading to growing demand. With a robust pipeline of clinical trials and expanding indications, this drug type is expected to witness the highest growth rate during the forecast period.

By Indication:

Non-Hodgkin Lymphoma (NHL) led the market with 38.4% in 2024 among the indications, primarily due to the higher prevalence of this cancer type and the availability of multiple CAR-T therapies, such as Yescarta, Kymriah, and Breyanzi, specifically targeting NHL. The established efficacy of these therapies in treating relapsed or refractory patients has cemented NHL as the dominant segment.

In contrast, multiple myeloma is anticipated to be the fastest-growing segment. Recent drug approvals like Carvykti and Abecma have significantly advanced treatment options for multiple myeloma, especially in patients who have exhausted traditional therapies. This surge in new treatments and ongoing clinical trials will likely propel the growth of the multiple myeloma segment.

By End-user:

Hospitals dominated the end-user segment in the CAR-T cell therapy market with a 42.9% share in 2024. Hospitals, due to their larger patient influx and advanced healthcare infrastructure, are better equipped to administer complex and expensive CAR-T therapies. They also play a pivotal role in facilitating clinical trials, further cementing their dominant position.

However, oncology treatment centers are forecasted to experience the fastest growth in the coming years. As specialized centers focusing exclusively on cancer treatment, these facilities are increasingly adopting CAR-T therapies due to their ability to provide tailored and advanced care to cancer patients. The rise in the number of such centers, along with advancements in treatment protocols, will likely boost their market share during the forecast period.

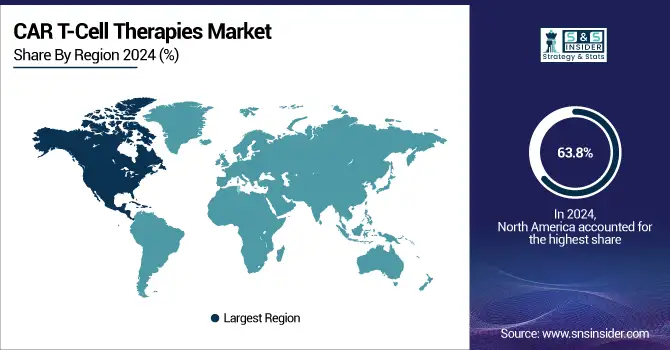
CAR T-Cell Therapies Market Regional Analysis:

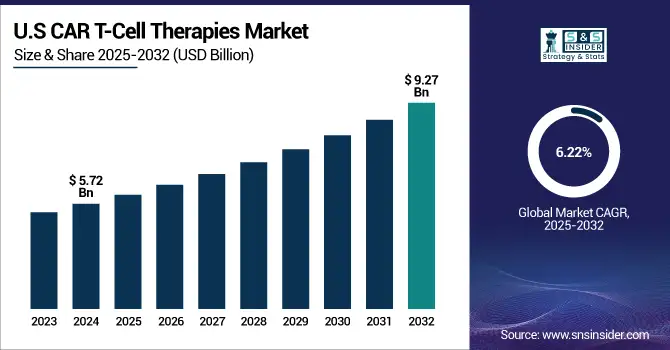
North America CAR T-Cell Therapies Market Trends:

In 2024, North America accounted for approximately 63.8% of the CAR-T cell therapy market revenue, with the U.S. leading the global market. This dominance is primarily due to the region's strong research infrastructure, well-established commercial base, and the large number of ongoing clinical trials for T-cell therapies. The increasing number of regulatory approvals in both the U.S. and Canada, combined with a shifting reimbursement landscape, has further fueled the adoption of CAR-T therapies, contributing to significant market growth.

Asia-Pacific CAR T-Cell Therapies Market Trends:

Meanwhile, the Asia Pacific region is poised to experience a rapid compound annual growth rate (CAGR) of over 30% during the forecast period. China, in particular, has emerged as a key player, boasting the highest number of registered clinical trials for CAR-T therapies. The country’s rapid growth is attributed to substantial government investments and healthcare reforms aimed at advancing cancer treatment. As a result, China is leading the Asia Pacific region in CAR-T market expansion, with the fastest projected CAGR in the coming years. Overall, the increasing focus on research, government support, and favorable regulatory environments across these regions are driving the growth of CAR-T cell therapy globally.


Europe CAR T-Cell Therapies Market Trends:

In Europe, the CAR-T cell therapy market is witnessing steady growth, with countries such as Germany, France, and the U.K. leading in both clinical trials and commercial adoption. The region benefits from well-established healthcare infrastructure, strong government support for advanced therapies, and increasing regulatory approvals. Collaborative initiatives between academic institutions and biopharma companies are accelerating research and development in CAR-T therapies. Additionally, evolving reimbursement policies and growing awareness of personalized medicine are supporting adoption. Europe’s market growth is expected to continue steadily, driven by increased investment in immunotherapy research and gradual expansion of treatment availability across more countries.

Latin America CAR T-Cell Therapies Market Trends:

In Latin America, the CAR-T cell therapy market is still in its nascent stage, with Brazil, Mexico, and Argentina leading in clinical research and early adoption. Market growth is supported by increasing investment in healthcare infrastructure, rising prevalence of hematologic cancers, and growing collaborations with global biopharma companies. Regulatory advancements and limited reimbursement frameworks remain challenges; however, ongoing initiatives to enhance accessibility and local clinical trials are expected to support steady growth in the region, positioning Latin America for gradual expansion in the CAR-T market.

Middle East & Africa (MEA) CAR T-Cell Therapies Market Trends:

The MEA region is an emerging market for CAR-T therapies, with adoption currently limited due to high treatment costs, lack of specialized facilities, and relatively few clinical trials. However, initiatives in countries like the UAE, Saudi Arabia, and South Africa are aimed at improving access to advanced therapies, including investments in healthcare infrastructure and oncology research. Growing awareness of CAR-T therapy, coupled with government support for cancer treatment programs, is expected to drive gradual market growth over the forecast period, particularly in urban healthcare centers.

CAR-T-Cell-Therapies-Market-Regional-Analysis-2023

Need any customization research on CAR T-Cell Therapies Market - Enquiry Now

CAR T-Cell Therapies Market Key Players:

  • Gilead Sciences, Inc.

  • Novartis AG

  • Bristol-Myers Squibb Company

  • Johnson & Johnson Services, Inc. (Janssen Global Services, LLC)

  • Caribou Biosciences, Inc.

  • CARsgen Therapeutics Co., Ltd

  • JW Therapeutics (Shanghai) Co., Ltd.

  • Cartesian Therapeutics, Inc.

  • Aurora Biopharma

  • Merck KGaA

  • TCR2 Therapeutics Inc

  • Bluebird Bio Inc.

  • Sorrento Therapeutics

  • Fate Therapeutics

  • Pfizer Inc.

  • Amgen

  • Celgene Corporation

  • Editas Medicine

  • CRISPR Therapeutics

  • Allogene Therapeutics

CAR T-Cell Therapies Market Competitive Landscape:

Bristol-Myers Squibb Company is a global biopharmaceutical company focused on discovering, developing, and delivering innovative medicines for serious diseases, including oncology, immunology, cardiovascular, and fibrotic disorders. With a strong research pipeline and global presence, the company aims to transform patients’ lives through advanced therapies and personalized medicine.

  • In April 2024, Bristol entered a global capacity reservation and supply agreement with Cellares to produce CAR T-cell therapies using Cellares’ automated, high-throughput manufacturing platform, Cell Shuttle.

Max Healthcare is a leading private healthcare provider in India, offering comprehensive medical services across hospitals, specialty clinics, and diagnostic centers. Known for advanced patient care, cutting-edge technology, and a strong focus on quality and safety, Max Healthcare delivers a wide range of treatments, including critical care, oncology, cardiology, and multi-specialty services.

  • In December 2023, Max Healthcare, in collaboration with ImmunoACT, launched CAR-T cell therapy in Delhi-NCR for the treatment of lymphomas and leukemias.

Gilead Sciences, Inc. is a global biopharmaceutical company specializing in the discovery, development, and commercialization of innovative medicines in areas such as antiviral therapies, oncology, and cell and gene therapy. Gilead is committed to advancing patient care worldwide through research-driven solutions and transformative treatments for life-threatening diseases.

  • In January 2023, Gilead received U.S. FDA approval for modifications to the manufacturing processes of YESCARTA (axicabtagene ciloleucel), reducing the median turnaround time (TAT) in the U.S. from 16 days to 14 days.

CAR T-Cell Therapies Market Report Scope:

Report Attributes Details
Market Size in 2024  USD 5.42 Billion
Market Size by 2032  USD 34.42 Billion
CAGR   CAGR of 26% From 2025 to 2032
Base Year 2024
Forecast Period  2025-2032
Historical Data  2021-2023
Report Scope & Coverage Market Size, Segments Analysis, Competitive  Landscape, Regional Analysis, DROC & SWOT Analysis, Forecast Outlook
Key Segments • By Drug Type [Axicabtagene Ciloleucel (Yescarta), Brexucabtagene Autoleucel (Tecartus), Ciltacabtagene Autoleucel (Carvykti), Idecabtagene Vicleucel (Abecma), Lisocabtagene Maraleucel (Breyanzi), Tisagenlecleucel (Kymriah), Others]
• By Indication (Acute Lymphoblastic Leukemia, Non-Hodgkin Lymphoma, Multiple Myeloma)
• By End-user (Hospitals, Oncology Treatment Centers)
Regional Analysis/Coverage North America (US, Canada), Europe (Germany, UK, France, Italy, Spain, Russia, Poland, Rest of Europe), Asia Pacific (China, India, Japan, South Korea, Australia, ASEAN Countries, Rest of Asia Pacific), Middle East & Africa (UAE, Saudi Arabia, Qatar, South Africa, Rest of Middle East & Africa), Latin America (Brazil, Argentina, Mexico, Colombia, Rest of Latin America).
Company Profiles Gilead Sciences, Inc., Novartis AG, Bristol-Myers Squibb Company, Johnson & Johnson Services, Inc. (Janssen Global Services, LLC), Caribou Biosciences, Inc., CARsgen Therapeutics Co., Ltd, JW Therapeutics (Shanghai) Co., Ltd., Cartesian Therapeutics, Inc., Aurora Biopharma, Merck KGaA, TCR2 Therapeutics Inc, Bluebird Bio Inc., Sorrento Therapeutics, Fate Therapeutics, Pfizer Inc., Amgen, Celgene Corporation, Editas Medicine, CRISPR Therapeutics, Allogene Therapeutics

Table Of Contents

1. Introduction

1.1 Market Definition & Scope

 1.2 Research Assumptions & Abbreviations

 1.3 Research Methodology

2. Executive Summary

2.1 Market Snapshot

 2.2 Market Absolute $ Opportunity Assessment & Y-o-Y Analysis, 2021–2032

 2.3 Market Size & Forecast, By Segmentation, 2021–2032

  2.3.1 Market Size By Drug Type

  2.3.2 Market Size By Indication

  2.3.3 Market Size By End-use

 2.4 Market Share & Bps Analysis By Region, 2024

 2.5 Industry Growth Scenarios – Conservative, Likely & Optimistic

 2.6 Industry CxO’s Perspective

3. Market Overview

3.1 Market Dynamics

  3.1.1 Drivers

  3.1.2 Restraints

  3.1.3 Opportunities

  3.1.4 Key Market Trends

 3.2 Industry PESTLE Analysis

 3.3 Key Industry Forces (Porter’s) Impacting Market Growth

 3.4 Industry Supply Chain Analysis

  3.4.1 Raw Material Suppliers

  3.4.2 Manufacturers

  3.4.3 Distributors/Suppliers

  3.4.4 Customers/End-Users

 3.5 Industry Life Cycle Assessment

 3.6 Parent Market Overview

 3.7 Market Risk Assessment

4. Statistical Insights & Trends Reporting

4.1 Clinical Development & Approval Metrics

4.1.1 Number of CAR T-cell therapy candidates in clinical trials by phase (Phase I, II, III)
4.1.2 Clinical trial success rate (%) by indication (hematologic vs solid tumors)
4.1.3 Average time from IND submission to regulatory approval

4.2 Manufacturing & Production Statistics

4.2.1 Global CAR T-cell therapy manufacturing capacity (patients/year)
4.2.2 Share of autologous versus allogeneic CAR T therapies in production
4.2.3 Average production cost per therapy and cost reduction trends (2020–2032)

4.3 Market Access & Patient Metrics

4.3.1 Patient access rate (%) in key regions (North America, Europe, Asia-Pacific)
4.3.2 Average treatment wait time from enrollment to infusion
4.3.3 Percentage of eligible patients receiving therapy vs diagnosed patients

4.4 Safety & Efficacy Metrics

4.4.1 Incidence rate of cytokine release syndrome (CRS) and neurotoxicity (%)
4.4.2 Overall response rate (ORR) by indication and therapy type
4.4.3 Duration of response (DoR) and median progression-free survival (PFS)

 5. CAR T-Cell Therapies Market Segmental Analysis & Forecast, By Drug Type, 2021 – 2032, Value (USD Billion)

5.1 Introduction

 5.2 Axicabtagene Ciloleucel (Yescarta)

  5.2.1 Key Trends

  5.2.2 Market Size & Forecast, 2021 – 2032

 5.3 Brexucabtagene Autoleucel (Tecartus)

   5.4 Ciltacabtagene Autoleucel (Carvykti)

5.5 Idecabtagene Vicleucel (Abecma)

5.6 Lisocabtagene Maraleucel (Breyanzi)

5.7 Tisagenlecleucel (Kymriah)

5.8 Others

6. CAR T-Cell Therapies Market Segmental Analysis & Forecast, By Indication, 2021 – 2032, Value (USD Billion)

    6.1 Introduction

 6.2 Acute Lymphoblastic Leukemia

  6.2.1 Key Trends

  6.2.2 Market Size & Forecast, 2021 – 2032

 6.3 Non-Hodgkin Lymphoma

    6.4 Multiple Myeloma

7. CAR T-Cell Therapies Market Segmental Analysis & Forecast, By End-use, 2021 – 2032, Value (USD Billion)

    7.1 Introduction

 7.2 Hospitals

  7.2.1 Key Trends

  7.2.2 Market Size & Forecast, 2021 – 2032

 7.3 Oncology Treatment Centers

8. CAR T-Cell Therapies Market Segmental Analysis & Forecast By Region, 2021 – 2025, Value (USD Billion)

8.1 Introduction

8.2 North America

 8.2.1 Key Trends

 8.2.2 CAR T-Cell Therapies Market Size & Forecast, By Drug Type, 2021 – 2032

 8.2.3 CAR T-Cell Therapies Market Size & Forecast, By Indication, 2021 – 2032

 8.2.4 CAR T-Cell Therapies Market Size & Forecast, By End-use, 2021 – 2032

 8.2.5 CAR T-Cell Therapies Market Size & Forecast, By Country, 2021 – 2032

  8.2.5.1 USA

   8.2.5.1.1 CAR T-Cell Therapies Market Size & Forecast, By Drug Type, 2021 – 2032

   8.2.5.1.2 CAR T-Cell Therapies Market Size & Forecast, By Indication, 2021 – 2032

   8.2.5.1.3 CAR T-Cell Therapies Market Size & Forecast, By End-use, 2021 – 2032

  8.2.5.2 Canada

   8.2.5.2.1 CAR T-Cell Therapies Market Size & Forecast, By Drug Type, 2021 – 2032

   8.2.5.2.2 CAR T-Cell Therapies Market Size & Forecast, By Indication, 2021 – 2032

   8.2.5.2.3 CAR T-Cell Therapies Market Size & Forecast, By End-use, 2021 – 2032

8.3 Europe

 8.3.1 Key Trends

 8.3.2 CAR T-Cell Therapies Market Size & Forecast, By Drug Type, 2021 – 2032

 8.3.3 CAR T-Cell Therapies Market Size & Forecast, By Indication, 2021 – 2032

 8.3.4 CAR T-Cell Therapies Market Size & Forecast, By End-use, 2021 – 2032

 8.3.5 CAR T-Cell Therapies Market Size & Forecast, By Country, 2021 – 2032

  8.3.5.1 Germany

   8.3.5.1.1 CAR T-Cell Therapies Market Size & Forecast, By Drug Type, 2021 – 2032

   8.3.5.1.2 CAR T-Cell Therapies Market Size & Forecast, By Indication, 2021 – 2032

   8.3.5.1.3 CAR T-Cell Therapies Market Size & Forecast, By End-use, 2021 – 2032

  8.3.5.2 UK

   8.3.5.2.1 CAR T-Cell Therapies Market Size & Forecast, By Drug Type, 2021 – 2032

   8.3.5.2.2 CAR T-Cell Therapies Market Size & Forecast, By Indication, 2021 – 2032

   8.3.5.2.3 CAR T-Cell Therapies Market Size & Forecast, By End-use, 2021 – 2032

  8.3.5.3 France

   8.3.5.3.1 CAR T-Cell Therapies Market Size & Forecast, By Drug Type, 2021 – 2032

   8.3.5.3.2 CAR T-Cell Therapies Market Size & Forecast, By Indication, 2021 – 2032

   8.3.5.3.3 CAR T-Cell Therapies Market Size & Forecast, By End-use, 2021 – 2032

  8.3.5.4 Italy

   8.3.5.4.1 CAR T-Cell Therapies Market Size & Forecast, By Drug Type, 2021 – 2032

   8.3.5.4.2 CAR T-Cell Therapies Market Size & Forecast, By Indication, 2021 – 2032

   8.3.5.4.3 CAR T-Cell Therapies Market Size & Forecast, By End-use, 2021 – 2032

  8.3.5.5 Spain

   8.3.5.5.1 CAR T-Cell Therapies Market Size & Forecast, By Drug Type, 2021 – 2032

   8.3.5.5.2 CAR T-Cell Therapies Market Size & Forecast, By Indication, 2021 – 2032

   8.3.5.5.3 CAR T-Cell Therapies Market Size & Forecast, By End-use, 2021 – 2032

  8.3.5.6 Russia

   8.3.5.6.1 CAR T-Cell Therapies Market Size & Forecast, By Drug Type, 2021 – 2032

   8.3.5.6.2 CAR T-Cell Therapies Market Size & Forecast, By Indication, 2021 – 2032

   8.3.5.6.3 CAR T-Cell Therapies Market Size & Forecast, By End-use, 2021 – 2032

  8.3.5.7 Poland

   8.3.5.7.1 CAR T-Cell Therapies Market Size & Forecast, By Drug Type, 2021 – 2032

   8.3.5.7.2 CAR T-Cell Therapies Market Size & Forecast, By Indication, 2021 – 2032

   8.3.5.7.3 CAR T-Cell Therapies Market Size & Forecast, By End-use, 2021 – 2032

  8.3.5.8 Rest of Europe

   8.3.5.8.1 CAR T-Cell Therapies Market Size & Forecast, By Drug Type, 2021 – 2032

   8.3.5.8.2 CAR T-Cell Therapies Market Size & Forecast, By Indication, 2021 – 2032

   8.3.5.8.3 CAR T-Cell Therapies Market Size & Forecast, By End-use, 2021 – 2032

8.4 Asia-Pacific

 8.4.1 Key Trends

 8.4.2 CAR T-Cell Therapies Market Size & Forecast, By Drug Type, 2021 – 2032

 8.4.3 CAR T-Cell Therapies Market Size & Forecast, By Indication, 2021 – 2032

 8.4.4 CAR T-Cell Therapies Market Size & Forecast, By End-use, 2021 – 2032

 8.4.5 CAR T-Cell Therapies Market Size & Forecast, By Country, 2021 – 2032

  8.4.5.1 China

   8.4.5.1.1 CAR T-Cell Therapies Market Size & Forecast, By Drug Type, 2021 – 2032

   8.4.5.1.2 CAR T-Cell Therapies Market Size & Forecast, By Indication, 2021 – 2032

   8.4.5.1.3 CAR T-Cell Therapies Market Size & Forecast, By End-use, 2021 – 2032

  8.4.5.2 India

   8.4.5.2.1 CAR T-Cell Therapies Market Size & Forecast, By Drug Type, 2021 – 2032

   8.4.5.2.2 CAR T-Cell Therapies Market Size & Forecast, By Indication, 2021 – 2032

   8.4.5.2.3 CAR T-Cell Therapies Market Size & Forecast, By End-use, 2021 – 2032

  8.4.5.3 Japan

   8.4.5.3.1 CAR T-Cell Therapies Market Size & Forecast, By Drug Type, 2021 – 2032

   8.4.5.3.2 CAR T-Cell Therapies Market Size & Forecast, By Indication, 2021 – 2032

   8.4.5.3.3 CAR T-Cell Therapies Market Size & Forecast, By End-use, 2021 – 2032

  8.4.5.4 South Korea

   8.4.5.4.1 CAR T-Cell Therapies Market Size & Forecast, By Drug Type, 2021 – 2032

   8.4.5.4.2 CAR T-Cell Therapies Market Size & Forecast, By Indication, 2021 – 2032

   8.4.5.4.3 CAR T-Cell Therapies Market Size & Forecast, By End-use, 2021 – 2032

  8.4.5.5 Australia

   8.4.5.5.1 CAR T-Cell Therapies Market Size & Forecast, By Drug Type, 2021 – 2032

   8.4.5.5.2 CAR T-Cell Therapies Market Size & Forecast, By Indication, 2021 – 2032

   8.4.5.5.3 CAR T-Cell Therapies Market Size & Forecast, By End-use, 2021 – 2032

  8.4.5.6 ASEAN Countries

   8.4.5.6.1 CAR T-Cell Therapies Market Size & Forecast, By Drug Type, 2021 – 2032

   8.4.5.6.2 CAR T-Cell Therapies Market Size & Forecast, By Indication, 2021 – 2032

   8.4.5.6.3 CAR T-Cell Therapies Market Size & Forecast, By End-use, 2021 – 2032

  8.4.5.7 Rest of Asia-Pacific

   8.4.5.7.1 CAR T-Cell Therapies Market Size & Forecast, By Drug Type, 2021 – 2032

   8.4.5.7.2 CAR T-Cell Therapies Market Size & Forecast, By Indication, 2021 – 2032

   8.4.5.7.3 CAR T-Cell Therapies Market Size & Forecast, By End-use, 2021 – 2032

8.5 Latin America

 8.5.1 Key Trends

 8.5.2 CAR T-Cell Therapies Market Size & Forecast, By Drug Type, 2021 – 2032

 8.5.3 CAR T-Cell Therapies Market Size & Forecast, By Indication, 2021 – 2032

 8.5.4 CAR T-Cell Therapies Market Size & Forecast, By End-use, 2021 – 2032

 8.5.5 CAR T-Cell Therapies Market Size & Forecast, By Country, 2021 – 2032

  8.5.5.1 Brazil

   8.5.5.1.1 CAR T-Cell Therapies Market Size & Forecast, By Drug Type, 2021 – 2032

   8.5.5.1.2 CAR T-Cell Therapies Market Size & Forecast, By Indication, 2021 – 2032

   8.5.5.1.3 CAR T-Cell Therapies Market Size & Forecast, By End-use, 2021 – 2032

  8.5.5.2 Argentina

   8.5.5.2.1 CAR T-Cell Therapies Market Size & Forecast, By Drug Type, 2021 – 2032

   8.5.5.2.2 CAR T-Cell Therapies Market Size & Forecast, By Indication, 2021 – 2032

   8.5.5.2.3 CAR T-Cell Therapies Market Size & Forecast, By End-use, 2021 – 2032

  8.5.5.3 Mexico

   8.5.5.3.1 CAR T-Cell Therapies Market Size & Forecast, By Drug Type, 2021 – 2032

   8.5.5.3.2 CAR T-Cell Therapies Market Size & Forecast, By Indication, 2021 – 2032

   8.5.5.3.3 CAR T-Cell Therapies Market Size & Forecast, By End-use, 2021 – 2032

  8.5.5.4 Colombia

   8.5.5.4.1 CAR T-Cell Therapies Market Size & Forecast, By Drug Type, 2021 – 2032

   8.5.5.4.2 CAR T-Cell Therapies Market Size & Forecast, By Indication, 2021 – 2032

   8.5.5.4.3 CAR T-Cell Therapies Market Size & Forecast, By End-use, 2021 – 2032

  8.5.5.5 Rest of Latin America

   8.5.5.5.1 CAR T-Cell Therapies Market Size & Forecast, By Drug Type, 2021 – 2032

   8.5.5.5.2 CAR T-Cell Therapies Market Size & Forecast, By Indication, 2021 – 2032

   8.5.5.5.3 CAR T-Cell Therapies Market Size & Forecast, By End-use, 2021 – 2032

8.6 Middle East & Africa

 8.6.1 Key Trends

 8.6.2 CAR T-Cell Therapies Market Size & Forecast, By Drug Type, 2021 – 2032

 8.6.3 CAR T-Cell Therapies Market Size & Forecast, By Indication, 2021 – 2032

 8.6.4 CAR T-Cell Therapies Market Size & Forecast, By End-use, 2021 – 2032

 8.6.5 CAR T-Cell Therapies Market Size & Forecast, By Country, 2021 – 2032

  8.6.5.1 UAE

   8.6.5.1.1 CAR T-Cell Therapies Market Size & Forecast, By Drug Type, 2021 – 2032

   8.6.5.1.2 CAR T-Cell Therapies Market Size & Forecast, By Indication, 2021 – 2032

   8.6.5.1.3 CAR T-Cell Therapies Market Size & Forecast, By End-use, 2021 – 2032

  8.6.5.2 Saudi Arabia

   8.6.5.2.1 CAR T-Cell Therapies Market Size & Forecast, By Drug Type, 2021 – 2032

   8.6.5.2.2 CAR T-Cell Therapies Market Size & Forecast, By Indication, 2021 – 2032

   8.6.5.2.3 CAR T-Cell Therapies Market Size & Forecast, By End-use, 2021 – 2032

  8.6.5.3 Qatar

   8.6.5.3.1 CAR T-Cell Therapies Market Size & Forecast, By Drug Type, 2021 – 2032

   8.6.5.3.2 CAR T-Cell Therapies Market Size & Forecast, By Indication, 2021 – 2032

   8.6.5.3.3 CAR T-Cell Therapies Market Size & Forecast, By End-use, 2021 – 2032

  8.6.5.4 Egypt

   8.6.5.4.1 CAR T-Cell Therapies Market Size & Forecast, By Drug Type, 2021 – 2032

   8.6.5.4.2 CAR T-Cell Therapies Market Size & Forecast, By Indication, 2021 – 2032

   8.6.5.4.3 CAR T-Cell Therapies Market Size & Forecast, By End-use, 2021 – 2032

  8.6.5.5 South Africa

   8.6.5.5.1 CAR T-Cell Therapies Market Size & Forecast, By Drug Type, 2021 – 2032

   8.6.5.5.2 CAR T-Cell Therapies Market Size & Forecast, By Indication, 2021 – 2032

   8.6.5.5.3 CAR T-Cell Therapies Market Size & Forecast, By End-use, 2021 – 2032

  8.6.5.6 Rest of Middle East & Africa

   8.6.5.6.1 CAR T-Cell Therapies Market Size & Forecast, By Drug Type, 2021 – 2032

   8.6.5.6.2 CAR T-Cell Therapies Market Size & Forecast, By Indication, 2021 – 2032

   8.6.5.6.3 CAR T-Cell Therapies Market Size & Forecast, By End-use, 2021 – 2032

9. Competitive Landscape

 9.1 Key Players' Positioning

 9.2 Competitive Developments

  9.2.1 Key Strategies Adopted (%), By Key Players, 2024

  9.2.2 Year-Wise Strategies & Development, 2021 – 2025

  9.2.3 Number Of Strategies Adopted By Key Players, 2024

 9.3 Market Share Analysis, 2024

 9.4 Product/Service & Application Benchmarking

  9.4.1 Product/Service Specifications & Features By Key Players

  9.4.2 Product/Service Heatmap By Key Players

  9.4.3 Application Heatmap By Key Players

 9.5 Industry Start-Up & Innovation Landscape

9.6 Key Company Profiles

 9.6.1 Gilead Sciences, Inc.

  9.6.1.1 Company Overview & Snapshot

  9.6.1.2 Product/Service Portfolio

  9.6.1.3 Key Company Financials

  9.6.1.4 SWOT Analysis

9.6.2 Novartis AG

9.6.3 Bristol-Myers Squibb Company

9.6.4 Johnson & Johnson Services, Inc. (Janssen Global Services, LLC)

9.6.5 Caribou Biosciences, Inc.

9.6.6 CARsgen Therapeutics Co., Ltd

9.6.7 JW Therapeutics (Shanghai) Co., Ltd.

9.6.8 Cartesian Therapeutics, Inc.

9.6.9 Aurora Biopharma

9.6.10 Merck KGaA

9.6.11 TCR2 Therapeutics Inc

9.6.12 Bluebird Bio Inc.

9.6.13 Sorrento Therapeutics

9.6.14 Fate Therapeutics

9.6.15 Pfizer Inc.

9.6.16 Amgen

9.6.17 Celgene Corporation

9.6.18 Editas Medicine

9.6.19 CRISPR Therapeutics

9.6.20 Allogene Therapeutics

10. Analyst Recommendations

 10.1 SNS Insider Opportunity Map

 10.2 Industry Low-Hanging Fruit Assessment

 10.3 Market Entry & Growth Strategy

 10.4 Analyst Viewpoint & Suggestions On Market Growth

11. Assumptions

12. Disclaimer

13. Appendix

 13.1 List Of Tables

 13.2 List Of Figures

Key Segmentation

By Drug Type

  • Axicabtagene Ciloleucel (Yescarta)

  • Brexucabtagene Autoleucel (Tecartus)

  • Ciltacabtagene Autoleucel (Carvykti)

  • Idecabtagene Vicleucel (Abecma)

  • Lisocabtagene Maraleucel (Breyanzi)

  • Tisagenlecleucel (Kymriah)

  • Others

By Indication

  • Acute Lymphoblastic Leukemia

  • Non-Hodgkin Lymphoma

  • Multiple Myeloma

By End-user

  • Hospitals

  • Oncology Treatment Centers

Request for Segment Customization as per your Business Requirement: Segment Customization Request

Regional Coverage:

North America

  • US

  • Canada

  • Mexico

Europe

  • Eastern Europe

    • Poland

    • Romania

    • Hungary

    • Turkey

    • Rest of Eastern Europe

  • Western Europe

    • Germany

    • France

    • UK

    • Italy

    • Spain

    • Netherlands

    • Switzerland

    • Austria

    • Rest of Western Europe

Asia Pacific

  • China

  • India

  • Japan

  • South Korea

  • Vietnam

  • Singapore

  • Australia

  • Rest of Asia Pacific

Middle East & Africa

Middle East

  • UAE

  • Egypt

  • Saudi Arabia

  • Qatar

  • Rest of the Middle East

Africa

  • Nigeria

  • South Africa

  • Rest of Africa

Latin America

  • Brazil

  • Argentina

  • Colombia

  • Rest of Latin America

Request for Country Level Research Report: Country Level Customization Request

Available Customization

With the given market data, SNS Insider offers customization as per the company’s specific needs. The following customization options are available for the report:

  • Product Analysis

  • Criss-Cross segment analysis (e.g. Product X Application)

  • Product Matrix which gives a detailed comparison of the product portfolio of each company

  • Geographic Analysis

  • Additional countries in any of the regions

  • Company Information

  • Detailed analysis and profiling of additional market players (Up to five)

An accurate research report requires proper strategizing as well as implementation. There are multiple factors involved in the completion of good and accurate research report and selecting the best methodology to compete the research is the toughest part. Since the research reports we provide play a crucial role in any company’s decision-making process, therefore we at SNS Insider always believe that we should choose the best method which gives us results closer to reality. This allows us to reach at a stage wherein we can provide our clients best and accurate investment to output ratio.

Each report that we prepare takes a timeframe of 350-400 business hours for production. Starting from the selection of titles through a couple of in-depth brain storming session to the final QC process before uploading our titles on our website we dedicate around 350 working hours. The titles are selected based on their current market cap and the foreseen CAGR and growth.


The 5 steps process:

Step 1: Secondary Research:

Secondary Research or Desk Research is as the name suggests is a research process wherein, we collect data through the readily available information. In this process we use various paid and unpaid databases which our team has access to and gather data through the same. This includes examining of listed companies’ annual reports, Journals, SEC filling etc. Apart from this our team has access to various associations across the globe across different industries. Lastly, we have exchange relationships with various university as well as individual libraries.

Secondary Research

Step 2: Primary Research

When we talk about primary research, it is a type of study in which the researchers collect relevant data samples directly, rather than relying on previously collected data.  This type of research is focused on gaining content specific facts that can be sued to solve specific problems. Since the collected data is fresh and first hand therefore it makes the study more accurate and genuine.

We at SNS Insider have divided Primary Research into 2 parts.

Part 1 wherein we interview the KOLs of major players as well as the upcoming ones across various geographic regions. This allows us to have their view over the market scenario and acts as an important tool to come closer to the accurate market numbers. As many as 45 paid and unpaid primary interviews are taken from both the demand and supply side of the industry to make sure we land at an accurate judgement and analysis of the market.

This step involves the triangulation of data wherein our team analyses the interview transcripts, online survey responses and observation of on filed participants. The below mentioned chart should give a better understanding of the part 1 of the primary interview.

Primary Research

Part 2: In this part of primary research the data collected via secondary research and the part 1 of the primary research is validated with the interviews from individual consultants and subject matter experts.

Consultants are those set of people who have at least 12 years of experience and expertise within the industry whereas Subject Matter Experts are those with at least 15 years of experience behind their back within the same space. The data with the help of two main processes i.e., FGDs (Focused Group Discussions) and IDs (Individual Discussions). This gives us a 3rd party nonbiased primary view of the market scenario making it a more dependable one while collation of the data pointers.

Step 3: Data Bank Validation

Once all the information is collected via primary and secondary sources, we run that information for data validation. At our intelligence centre our research heads track a lot of information related to the market which includes the quarterly reports, the daily stock prices, and other relevant information. Our data bank server gets updated every fortnight and that is how the information which we collected using our primary and secondary information is revalidated in real time.

Data Bank Validation

Step 4: QA/QC Process

After all the data collection and validation our team does a final level of quality check and quality assurance to get rid of any unwanted or undesired mistakes. This might include but not limited to getting rid of the any typos, duplication of numbers or missing of any important information. The people involved in this process include technical content writers, research heads and graphics people. Once this process is completed the title gets uploader on our platform for our clients to read it.

Step 5: Final QC/QA Process:

This is the last process and comes when the client has ordered the study. In this process a final QA/QC is done before the study is emailed to the client. Since we believe in giving our clients a good experience of our research studies, therefore, to make sure that we do not lack at our end in any way humanly possible we do a final round of quality check and then dispatch the study to the client.