Multiple Myeloma Market Size & Trends:
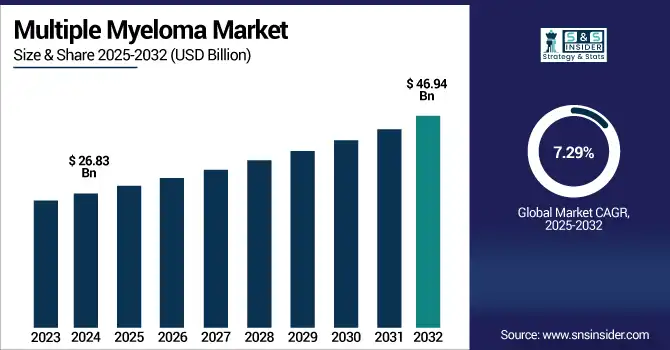
The Multiple Myeloma Market size was valued at USD 26.83 billion in 2024 and is expected to reach USD 46.94 billion by 2032, growing at a CAGR of 7.29% over the forecast period of 2025-2032.
To Get more information on Multiple Myeloma Market- Request Free Sample Report
The global multiple myeloma market is growing at a steady pace due to the prevalence of the disease, increasing adoption of new therapies such as CAR-T cells and bispecific antibodies, and rising diagnostic rates. Progress in personalized medicine and autumn regulatory approval timelines are broadening pathways forward and for treatment opportunities. Moreover, increasing healthcare expenditure along with rising awareness is improving early diagnosis and access to care.
The U.S. multiple myeloma market size was valued at USD 8.09 billion in 2024 and is expected to reach USD 13.91 billion by 2032, growing at a CAGR of 7.06% over the forecast period of 2025-2032.
The U.S. is the highest revenue-generating country in North America in the multiple myeloma market, owing to the advanced healthcare infrastructure, early adoption of novel therapies such as CAR-T and bispecific antibodies, and high prevalence of the disease in the country. In addition, its leadership position in the region is reinforced by strong R&D pipelines and access to innovative treatment options.
CAR-T and bispecific antibody therapies are on the rise: Elranatamab (Elrexfio) was approved in the U.S. in August 2023 and EU/Canada following year, Linvoseltamab (Lynozyfic) received EU approval in April 2025 and U.S. approval in July 2025
Multiple Myeloma Market Dynamics:
Drivers
-
Market Growth is Driven by the Increasing Prevalence of Heart Disease and the Aging Population
Multiple myeloma is largely an older person's disease, with the median age at diagnosis generally between 65 and 70 years. With an ever-growing population of individuals who are maturing, the incidence of patients at risk of developing multiple myeloma continues to rise. The aging of the human population is very pronounced in developed countries, such as the U.S., Japan, and Europe, where life expectancy is greater. Moreover, enhanced detection methods and preventative programs for cancer are leading to an upward trend in those numbers. Indeed, the increasing burden along with a burgeoning aging population is a key factor driving market development for multiple myeloma diagnostics, therapies, and long-term care solutions.
A significant increase in detection, especially among older populations, is also illustrated by a nationwide screening study in Iceland (iStopMM), which determined a smoldering multiple myeloma prevalence of 0.53% among those aged 40 and older.
Age-standardized incidence (↑3·1% annually) and mortality (↑2·2%) rates increased in China between 1990 and 2021, following global patterns largely attributable to demographic changes.
An estimated 140,779 people in Nevertheless, this burden of disease is on the rise as new cases are projected to be around 32,000 annual cases by 2020 (2).
-
The Market Growth is Driven by the Development of Treatment Options
Multiple myeloma therapy has changed drastically over the past decade, with a number of new agents greatly improving patient outcomes. Significant advances have been achieved in targeted therapy, such as immunomodulatory agents (lenalidomide, pomalidomide), proteasome inhibitors (bortezomib, carfilzomib), and monoclonal antibodies (daratumumab, isatuximab). In more recent years, CAR-T cell therapies and bispecific antibodies have become highly potent options for patients with relapsed or refractory disease. These innovations are not just improving survival; they are enabling more precise and personalized treatment. This has led to an increasing demand and hope on the part of clinicians and patients for these therapies, and their increased availability and clinical success continue to drive market growth.
Survival outcomes have been dramatically improved over the last 15 years with the introduction of novel therapies, including proteasome inhibitors and immunomodulatory drugs. Combination regimens offer longer progression-free survival and tolerable safety, as per meta-analyses and clinical reviews.
Daratumumab-based quadruplet regimens (including lenalidomide, bortezomib, dexamethasone) are significantly decreasing early relapse rates, which is driving the rapid advancement of new immune-based treatments.
After positive data were reported in the IMROZ trial, SARCLISA (isatuximab) received FDA approval in 2024, providing the first framework for a combination of standard regimens, expanding the use of isatuximab in the first-line setting for transplant-ineligible patients.
At the same time, mechanistic studies uncovered a new way to overcome proteasome inhibitor resistance, in which the enzyme acid ceramidase (ASAH1) is inhibited to restore the levels of the promyeloid cell death ceramide, and which has shown promising results in preclinical models of relapsed/refractory patients.
Restraint
-
The Factor Restraining the Market from Growing is the High Cost of Advanced Therapies
There are many factors that act as a hindrance to the multiple myeloma market growth, but one of the major restraints is the exorbitant price of novel therapies, when combined, restricts the access and affordability of these therapies in different health systems. Modern therapies such as CAR-T cell therapy (ide-cel and cilta-cel), monoclonal antibodies (daratumumab and isatuximab), and bispecific antibodies range from hundreds of thousands of dilation unit pricing per course of treatment.
This presents a huge dilemma, particularly in low- and middle-income nations, as disposable healthcare expenditure per capita is low and insurance might not be present or greatly limited for these high-cost treatments. These costs can quickly become a burden for the public and private payers even in high-income countries, resulting in prolonged reimbursement processes and limited formulary access or patient co-pay. Thus, despite the demonstration of clinical effectiveness of these new therapies in one or more settings, premium pricing creates an important economic barrier that results in limited access, and therefore, their diffusion into practice is stymied.
Multiple Myeloma Market Segmentation Analysis:
By Drug Class
The immunomodulators segment dominated the multiple myeloma market share in 2024 with a 46.20% due to the long-standing clinical use of immunomodulators among the drug class in multiple myeloma, strong evidence of efficacy, and favorable safety. Agents, such as lenalidomide and pomalidomide, remain mainstays in both newly diagnosed and relapsed/refractory disease. The role of IMiDs in standard of care has been established by wide adoption in combination regimens with proteasome inhibitors and corticosteroids, where they are used. Furthermore, the dominance continues thanks to the availability of oral formulations and existing reimbursement structures in important markets such as the U.S. and the EU.
the anti-CD38 monoclonal antibody segment is expected to witness rapid growth in the forecast period as a result of increasing adoption of targeted therapies and clinical success of daratumumab and isatuximab. Monoclonal antibodies, in particular, have shown better PFS and response rate, particularly in combination regimens. the demand for the anti-CD38 agents will increase in the future as precision medicine further advances and the patient population requests therapies with improved tolerability and with reduced long-term adverse consequences of therapy.
By Treatment Type
Due to established clinical success, a broader patient population, and routine integration into standard-of-care regimens, the targeted therapy segment of the multiple myeloma market by treatment type accounted for the largest share in 2024. targeted therapies (e.g., proteasome inhibitors [bortezomib, carfilzomib] and immunomodulatory drugs [lenalidomide] combined with agents that interfere with cancer cell survival and proliferation) have emerged as key components of treatment. The broad availability, tolerability across ages, and complementary nature of these therapies with other agents all boost their therapeutic appeal.
The Immunotherapy segment is anticipated to be the fastest-growing segment during the forecast years, due to advancements in precision medicine and increasing adoption of immunotherapies such as CAR-T cell therapy, bispecific T-cell engagers (BiTEs), and monoclonal antibodies. These target the immune system of the patient to directly eliminate the myeloma cells and have potential for sustained remission, even in patients heavily pretreated or relapsed/refractory. These are paving their way at a rapid pace, due to increased clinical trial activity, rising FDA approvals, and the suggestion of efficacy and durability of immune-based approaches.
By Drug Type
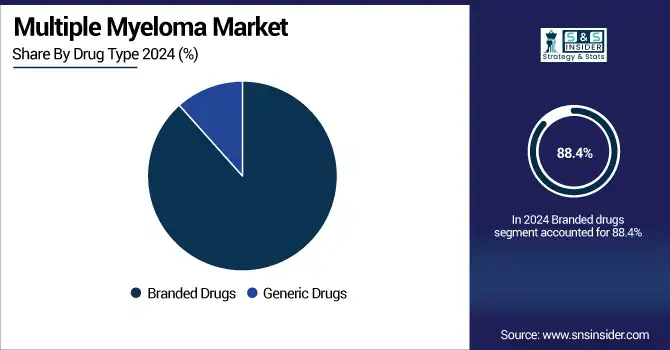
The branded drugs segment held a leading position in the multiple myeloma market by drug type globally in 2024, with around 88.4% market share, owing to the high usage of effective novel agents with established clinical benefits. Substantial role in multiple myeloma treatment regimens for key branded drugs such as Revlimid (lenalidomide), Darzalex (daratumumab), Kyprolis (carfilzomib), and Pomalyst (pomalidomide). These drugs have a lot of data to support their use in prolonging progression-free and overall survival in various patient populations. Strong physician trust, patient access programs, and no fully bioequivalent generics for many of the top molecules (particularly in high-income countries with strong healthcare infrastructure) also support their continued dominance.
The branded drugs segment is expected to develop at the fastest rate due to the introduction and expansion of next-generation therapies, including CAR-T cell therapies and bispecific antibodies. These treatments are reaching the market at premium price points backed by strong clinical data, although with new treatments, there is now renewed hope for relapsed/refractory patients. The multiple myeloma pipeline is robust with new agents targeting various unique antigens and underlying mechanisms, many of which are being expedited through regulatory pathways. Although cost-containment pressures in several regions are increasing, the branded segment is expected to experience higher growth rates than the overall market as new branded therapies are approved and global adoption expands.
By Distribution Channel
By distribution channel, the multiple myeloma market in 2024 was led by the hospital pharmacies segment with a 61.4% market share, owing to the complexity and intensity of treatment regimens, which require clinical oversight. Important treatments—in particular, CAR-T cell therapies, monoclonal antibodies, and proteasome inhibitors—are given through intravenous or injected pathways, which require special equipment and trained staff only available in hospital spaces. And hospitals are an important part of handling possible side effects, tracking when patients do respond, and modifying treatment protocols. Hospital pharmacies continue to serve as the central distribution point for high-risk, high-cost multiple myeloma therapies as the main centers for diagnosis, the initiation of therapy, and the coordination of comprehensive care.
The online pharmacies segment is estimated to register the highest growth in the forecasted period, due to the increasing demand for convenience, cost-effectiveness, and wider access for long-term maintenance medicines. Outpatient use of oral therapies (such as lenalidomide and pomalidomide) makes home delivery through digital pharmacy platforms desirable. Support for this shift is coming from an increased infrastructure built for digital health, increasing uptake of e-prescriptions, and expanding tele-oncology services. Moreover, the increase in regulatory nurturing of remote dispensing and direct-to-patient models, along with enhanced digital literacy and confidence in virtual care, are fast-tracking the adoption of online pharmacy channels amidst the multiple myeloma therapeutic landscape.
Multiple Myeloma Market Regional Insights
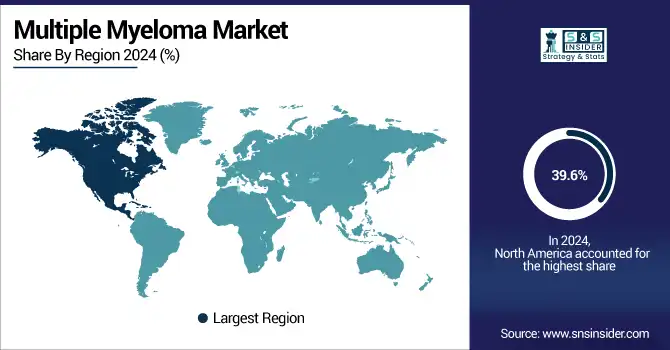
The multiple myeloma market trend in North America is dominated with a 39.6% market share in 2024 due to the advanced healthcare systems in the region, together with a higher level of awareness about this disease, and the firm presence of main pharmaceutical companies. Access to cutting-edge therapies such as CAR-T cell therapies, bispecific antibodies, and next-generation proteasome inhibitors, this region is an early adopter of such therapies. Additionally, multiple myeloma has a large prevalence in the U.S. and robust reimbursement processes that facilitate access to expensive branded therapies.
Asia Pacific is expected to register significant growth throughout the forecast period, owing to rising healthcare expenditure, an increase in the availability of cancer care, and growing diagnosis of diseases. For instance, nations such as China, Japan, South Korea, and India are making significant investments in oncology infrastructure, and advances in diagnostic capabilities are enabling the earlier and more accurate detection of multiple myeloma. Moreover, an increasing aging population (which is more prone to hematological malignancies), increasing health insurance coverage, and the influx of foreign drug producers in the region are driving the market growth at a higher pace. Asia Pacific is emerging as a hotbed of opportunity, bolstered by strategic partnerships and local clinical trials for assessment.
The multiple myeloma market analysis in Europe is expanding at a substantial rate, owing to a growing prevalence of the disease, surging adoption rate of innovative therapies, and strong public healthcare support. Structured treatment guidelines and broad access to advanced diagnostic tools, alongside increasing clinical trial participation, benefit the region. And the European Medicines Agency (EMA) continues to approve new therapies, including monoclonal antibodies and CAR-T cell therapies, improving access to innovative therapies. And Early diagnosis for effective patient treatment, along with value-based price models, are also increasing the demand and pushing the market within most of the countries across Germany, France, Italy & UK.
Despite the gradual growth of healthcare infrastructure, awareness of hematological cancers, and treatment access, countries within Latin America and the MEA are anticipated to record moderate growth in the multiple myeloma market. Countries such as Brazil and Mexico are foraying into cancer care programs and increasing coverage in public healthcare, which is fostering the uptake of standard therapy in Latin America. Growth of the market is attributed to the growing government initiatives towards non-communicable diseases, the rising number of cancer screening centers, and large private healthcare investment in economies such as Saudi Arabia, the UAE, and South Africa, among others, in the MEA region.
Get Customized Report as per Your Business Requirement - Enquiry Now
Multiple Myeloma Market Key Players:
The multiple myeloma market companies are Johnson & Johnson Services, Bristol-Myers Squibb, Amgen, Takeda Pharmaceutical, Sanofi, Pfizer, AbbVie, Novartis, Roche, GSK, Janssen Pharmaceuticals, Regeneron Pharmaceuticals, Legend Biotech, Karyopharm Therapeutics, Bluebird Bio, Oncopeptides, Genmab, Cellectar Biosciences, Beigene, ImmunoGen, and other players.
Recent Developments in the Multiple Myeloma Market:
-
June 2025 – Johnson & Johnson reported promising early results of a Phase 1 clinical trial assessing its investigational trispecific antibody, JNJ-79635322 (JNJ-5322), in relapsed or refractory multiple myeloma patients. Out of the 36 patients treated at the recommended Phase 2 dose (RP2D), the overall response rate (ORR) was 86.1%. Of particular interest, in the cohort of 27 patients who were not pretreated with BCMA- or GPRC5D-directed therapies, the ORR was 100% at the RP2D.
-
April 2024 – Bristol Myers Squibb and 2seventy bio, Inc. disclosed that the U.S. Food and Drug Administration (FDA) has approved Abecma (idecabtagene vicleucel; ide-cel) for the treatment of adult patients with relapsed or refractory multiple myeloma who have received two or more prior therapies, including an immunomodulatory agent (IMiD), a proteasome inhibitor (PI), and an anti-CD38 monoclonal antibody. It is based on successful results from the KarMMa-3 clinical trial.
Multiple Myeloma Market Report Scope:
Report Attributes Details Market Size in 2024 USD 26.83 Billion Market Size by 2032 USD 46.94 Billion CAGR CAGR of 7.29% From 2025 to 2032 Base Year 2024 Forecast Period 2025-2032 Historical Data 2021-2023 Report Scope & Coverage Market Size, Segments Analysis, Competitive Landscape, Regional Analysis, DROC & SWOT Analysis, Forecast Outlook Key Segments • By Drug Class (Immunomodulators, Proteasome Inhibitor, Anti-CD38 Monoclonal Antibody, Alkylating Agents)
• By Treatment Type (Chemotherapy, Targeted Therapy, Immunotherapy, Corticosteroids, Stem Cell Transplantation, Radiation Therapy)
• By Drug Type (Branded Drugs, Generic Drugs)
• By Distribution Channel (Hospital Pharmacies, Retail Pharmacies & Drug Stores, Online Pharmacies)Regional Analysis/Coverage North America (US, Canada, Mexico), Europe (Germany, France, UK, Italy, Spain, Poland, Turkey, Rest of Europe), Asia Pacific (China, India, Japan, South Korea, Singapore, Australia, Rest of Asia Pacific), Middle East & Africa (UAE, Saudi Arabia, Qatar, South Africa, Rest of Middle East & Africa), Latin America (Brazil, Argentina, Rest of Latin America) Company Profiles The multiple myeloma market companies are Johnson & Johnson Services, Bristol-Myers Squibb, Amgen, Takeda Pharmaceutical, Sanofi, Pfizer, AbbVie, Novartis, Roche, GSK, Janssen Pharmaceuticals, Regeneron Pharmaceuticals, Legend Biotech, Karyopharm Therapeutics, Bluebird Bio, Oncopeptides, Genmab, Cellectar Biosciences, Beigene, ImmunoGen, and other players.
Table Of Contents
1. Introduction
1.1 Market Definition & Scope
1.2 Research Assumptions & Abbreviations
1.3 Research Methodology
2. Executive Summary
2.1 Market Snapshot
2.2 Market Absolute $ Opportunity Assessment & Y-o-Y Analysis, 2021–2032
2.3 Market Size & Forecast, By Segmentation, 2021–2032
2.3.1 Market Size By Drug Class
2.3.2 Market Size By Treatment Type
2.3.2 Market Size By Drug Type
2.3.2 Market Size By Distribution Channel
2.4 Market Share & Bps Analysis By Region, 2024
2.5 Industry Growth Scenarios – Conservative, Likely & Optimistic
2.6 Industry CxO’s Perspective
3. Market Overview
3.1 Market Dynamics
3.1.1 Drivers
3.1.2 Restraints
3.1.3 Opportunities
3.1.4 Key Market Trends
3.2 Industry PESTLE Analysis
3.3 Key Industry Forces (Porter’s) Impacting Market Growth
3.4 Industry Supply Chain Analysis
3.4.1 Raw Material Suppliers
3.4.2 Manufacturers
3.4.3 Distributors/Suppliers
3.4.4 Customers/End-Users
3.5 Industry Life Cycle Assessment
3.6 Parent Market Overview
3.7 Market Risk Assessment
4. Statistical Insights & Trends Reporting
4. Statistical Insights and Trend Reporting
4.1 Incidence & Prevalence (2024)
4.1.1 Global Incidence Rate of Multiple Myeloma
4.1.2 Global Prevalence Rate of Multiple Myeloma
4.1.3 Regional Distribution (North America, Europe, Asia Pacific, Latin America, Middle East & Africa)
4.1.4 Age- and Gender-Specific Analysis
4.2 Treatment Adoption Trends, by Region (2024)
4.2.1 Utilization of Key Drug Classes (IMiDs, PIs, Anti-CD38 mAbs)
4.2.2 Adoption of CAR T-Cell and Bispecific Therapies
4.2.3 Use of Stem Cell Transplantation (Autologous vs. Allogeneic)
4.2.4 First-Line vs. Relapsed/Refractory Therapy Trends
4.3 Drug Prescription Volume, by Region (2020–2032)
4.3.1 Historical Prescription Trends (2020–2023)
4.3.2 Forecasted Prescription Volume (2024–2032)
4.3.3 Branded vs. Generic Prescription Share
4.3.4 Regional Patterns in Oral vs. Injectable Drug Use
4.3.5 Institutional vs. Retail Prescription Channels
4.4 Healthcare Spending, by Region (2024)
4.4.1 Government Healthcare Expenditure
4.4.2 Commercial Insurance Coverage Trends
4.4.3 Private and Out-of-Pocket Expenditure
4.4.4 Country-wise Cost Per Treated Patient
4.4.5 Cost Breakdown: Drug, Diagnostic, Procedural, Follow-up Care
4.5 Patient Journey Analytics
4.5.1 Time from Diagnosis to Treatment Initiation
4.5.2 Line-wise Treatment Transition Patterns
4.5.3 Discontinuation and Adherence Metrics
4.5.4 Survival Outcomes (PFS, OS, Median Survival)
4.5.5 Quality-of-Life (QoL) Measures
4.6 Clinical Trial Activity Trends (2020–2025)
4.6.1 Number of Ongoing vs. Completed Trials
4.6.2 Trial Distribution by Region
4.6.3 Focus Areas: Trispecific Antibodies, BCMA, CAR T-cell, etc.
4.6.4 Sponsor Analysis (Industry vs. Academia)
5. Multiple Myeloma Market Segmental Analysis & Forecast, By Drug Class, 2021 – 2032, Value (USD Billion)
5.1 Introduction
5.2 Immunomodulators
5.2.1 Key Trends
5.2.2 Market Size & Forecast, 2021 – 2032
5.3 Proteasome Inhibitor
5.3.1 Key Trends
5.3.2 Market Size & Forecast, 2021 – 2032
5.4 Anti-CD38 Monoclonal Antibody
5.4.1 Key Trends
5.4.2 Market Size & Forecast, 2021 – 2032
5.5 Alkylating Agents
5.5.1 Key Trends
5.5.2 Market Size & Forecast, 2021 – 2032
6. Multiple Myeloma Market Segmental Analysis & Forecast, By Treatment Type, 2021 – 2032, Value (USD Billion)
6.1 Introduction
6.2 Chemotherapy
6.2.1 Key Trends
6.2.2 Market Size & Forecast, 2021 – 2032
6.3 Targeted Therapy
6.3.1 Key Trends
6.3.2 Market Size & Forecast, 2021 – 2032
6.4 Immunotherapy
6.4.1 Key Trends
6.4.2 Market Size & Forecast, 2021 – 2032
6.5 Corticosteroids
6.5.1 Key Trends
6.5.2 Market Size & Forecast, 2021 – 2032
6.6 Stem Cell Transplantation
6.6.1 Key Trends
6.6.2 Market Size & Forecast, 2021 – 2032
6.7 Radiation Therapy
6.7.1 Key Trends
6.7.2 Market Size & Forecast, 2021 – 2032
7. Multiple Myeloma Market Segmental Analysis & Forecast, By Drug Type, 2021 – 2032, Value (USD Billion)
7.1 Introduction
7.2 Branded Drugs
7.2.1 Key Trends
7.2.2 Market Size & Forecast, 2021 – 2032
7.3 Generic Drugs
7.3.1 Key Trends
7.3.2 Market Size & Forecast, 2021 – 2032
8. Multiple Myeloma Market Segmental Analysis & Forecast, By Distribution Channel, 2021 – 2032, Value (USD Billion)
8.1 Introduction
8.2 Hospital Pharmacies
8.2.1 Key Trends
8.2.2 Market Size & Forecast, 2021 – 2032
8.3 Retail Pharmacies & Drug Stores
8.3.1 Key Trends
8.3.2 Market Size & Forecast, 2021 – 2032
8.4 Retail Pharmacies & Drug Stores
8.4.1 Key Trends
8.4.2 Market Size & Forecast, 2021 – 2032
9. Multiple Myeloma Market Segmental Analysis & Forecast By Region, 2021 – 2025, Value (USD Billion)
9.1 Introduction
9.2 North America
9.2.1 Key Trends
9.2.2 Multiple Myeloma Market Size & Forecast, By Drug Class, 2021 – 2032
9.2.3 Multiple Myeloma Market Size & Forecast, By Treatment Type, 2021 – 2032
9.2.4 Multiple Myeloma Market Size & Forecast, By Drug Type, 2021 – 2032
9.2.5 Multiple Myeloma Market Size & Forecast, By Distribution Channel, 2021 – 2032
9.2.6 Multiple Myeloma Market Size & Forecast, By Country, 2021 – 2032
9.2.6.1 USA
9.2.6.1.1 Multiple Myeloma Market Size & Forecast, By Drug Class, 2021 – 2032
9.2.6.1.2 Multiple Myeloma Market Size & Forecast, By Treatment Type, 2021 – 2032
9.2.6.1.3 Multiple Myeloma Market Size & Forecast, By Drug Type, 2021 – 2032
9.2.6.1.4 Multiple Myeloma Market Size & Forecast, By Distribution Channel, 2021 – 2032
9.2.6.2 Canada
9.2.6.2.1 Multiple Myeloma Market Size & Forecast, By Drug Class, 2021 – 2032
9.2.6.2.2 Multiple Myeloma Market Size & Forecast, By Treatment Type, 2021 – 2032
9.2.6.2.3 Multiple Myeloma Market Size & Forecast, By Drug Type, 2021 – 2032
9.2.6.2.4 Multiple Myeloma Market Size & Forecast, By Distribution Channel, 2021 – 2032
9.3 Europe
9.3.1 Key Trends
9.3.2 Multiple Myeloma Market Size & Forecast, By Drug Class, 2021 – 2032
9.3.3 Multiple Myeloma Market Size & Forecast, By Treatment Type, 2021 – 2032
9.3.4 Multiple Myeloma Market Size & Forecast, By Drug Type, 2021 – 2032
9.3.5 Multiple Myeloma Market Size & Forecast, By Distribution Channel, 2021 – 2032
9.3.6 Multiple Myeloma Market Size & Forecast, By Country, 2021 – 2032
9.3.6.1 Germany
9.3.6.1.1 Multiple Myeloma Market Size & Forecast, By Drug Class, 2021 – 2032
9.3.6.1.2 Multiple Myeloma Market Size & Forecast, By Treatment Type, 2021 – 2032
9.3.6.1.3 Multiple Myeloma Market Size & Forecast, By Drug Type, 2021 – 2032
9.3.6.1.4 Multiple Myeloma Market Size & Forecast, By Distribution Channel, 2021 – 2032
9.3.6.2 UK
9.3.6.2.1 Multiple Myeloma Market Size & Forecast, By Drug Class, 2021 – 2032
9.3.6.2.2 Multiple Myeloma Market Size & Forecast, By Treatment Type, 2021 – 2032
9.3.6.2.3 Multiple Myeloma Market Size & Forecast, By Drug Type, 2021 – 2032
9.3.6.2.4 Multiple Myeloma Market Size & Forecast, By Distribution Channel, 2021 – 2032
9.3.6.3 France
9.3.6.3.1 Multiple Myeloma Market Size & Forecast, By Drug Class, 2021 – 2032
9.3.6.3.2 Multiple Myeloma Market Size & Forecast, By Treatment Type, 2021 – 2032
9.3.6.3.3 Multiple Myeloma Market Size & Forecast, By Drug Type, 2021 – 2032
9.3.6.3.4 Multiple Myeloma Market Size & Forecast, By Distribution Channel, 2021 – 2032
9.3.6.4 Italy
9.3.6.4.1 Multiple Myeloma Market Size & Forecast, By Drug Class, 2021 – 2032
9.3.6.4.2 Multiple Myeloma Market Size & Forecast, By Treatment Type, 2021 – 2032
9.3.6.4.3 Multiple Myeloma Market Size & Forecast, By Drug Type, 2021 – 2032
9.3.6.4.4 Multiple Myeloma Market Size & Forecast, By Distribution Channel, 2021 – 2032
9.3.6.5 Spain
9.3.6.5.1 Multiple Myeloma Market Size & Forecast, By Drug Class, 2021 – 2032
9.3.6.5.2 Multiple Myeloma Market Size & Forecast, By Treatment Type, 2021 – 2032
9.3.6.5.3 Multiple Myeloma Market Size & Forecast, By Drug Type, 2021 – 2032
9.3.6.5.4 Multiple Myeloma Market Size & Forecast, By Distribution Channel, 2021 – 2032
9.3.6.6 Russia
9.3.6.6.1 Multiple Myeloma Market Size & Forecast, By Drug Class, 2021 – 2032
9.3.6.6.2 Multiple Myeloma Market Size & Forecast, By Treatment Type, 2021 – 2032
9.3.6.6.3 Multiple Myeloma Market Size & Forecast, By Drug Type, 2021 – 2032
9.3.6.6.4 Multiple Myeloma Market Size & Forecast, By Distribution Channel, 2021 – 2032
9.3.6.7 Poland
9.3.6.7.1 Multiple Myeloma Market Size & Forecast, By Drug Class, 2021 – 2032
9.3.6.7.2 Multiple Myeloma Market Size & Forecast, By Treatment Type, 2021 – 2032
9.3.6.7.3 Multiple Myeloma Market Size & Forecast, By Drug Type, 2021 – 2032
9.3.6.7.4 Multiple Myeloma Market Size & Forecast, By Distribution Channel, 2021 – 2032
9.3.6.8 Rest of Europe
9.3.6.8.1 Multiple Myeloma Market Size & Forecast, By Drug Class, 2021 – 2032
9.3.6.8.2 Multiple Myeloma Market Size & Forecast, By Treatment Type, 2021 – 2032
9.3.6.8.3 Multiple Myeloma Market Size & Forecast, By Drug Type, 2021 – 2032
9.3.6.8.4 Multiple Myeloma Market Size & Forecast, By Distribution Channel, 2021 – 2032
9.4 Asia-Pacific
9.4.1 Key Trends
9.4.2 Multiple Myeloma Market Size & Forecast, By Drug Class, 2021 – 2032
9.4.3 Multiple Myeloma Market Size & Forecast, By Treatment Type, 2021 – 2032
9.4.4 Multiple Myeloma Market Size & Forecast, By Drug Type, 2021 – 2032
9.4.5 Multiple Myeloma Market Size & Forecast, By Distribution Channel, 2021 – 2032
9.4.6 Multiple Myeloma Market Size & Forecast, By Country, 2021 – 2032
9.4.6.1 China
9.4.6.1.1 Multiple Myeloma Market Size & Forecast, By Drug Class, 2021 – 2032
9.4.6.1.2 Multiple Myeloma Market Size & Forecast, By Treatment Type, 2021 – 2032
9.4.6.1.3 Multiple Myeloma Market Size & Forecast, By Drug Type, 2021 – 2032
9.4.6.1.4 Multiple Myeloma Market Size & Forecast, By Distribution Channel, 2021 – 2032
9.4.6.2 India
9.4.6.2.1 Multiple Myeloma Market Size & Forecast, By Drug Class, 2021 – 2032
9.4.6.2.2 Multiple Myeloma Market Size & Forecast, By Treatment Type, 2021 – 2032
9.4.6.2.3 Multiple Myeloma Market Size & Forecast, By Drug Type, 2021 – 2032
9.4.6.2.4 Multiple Myeloma Market Size & Forecast, By Distribution Channel, 2021 – 2032
9.4.6.3 Japan
9.4.6.3.1 Multiple Myeloma Market Size & Forecast, By Drug Class, 2021 – 2032
9.4.6.3.2 Multiple Myeloma Market Size & Forecast, By Treatment Type, 2021 – 2032
9.4.6.3.3 Multiple Myeloma Market Size & Forecast, By Drug Type, 2021 – 2032
9.4.6.3.4 Multiple Myeloma Market Size & Forecast, By Distribution Channel, 2021 – 2032
9.4.6.4 South Korea
9.4.6.4.1 Multiple Myeloma Market Size & Forecast, By Drug Class, 2021 – 2032
9.4.6.4.2 Multiple Myeloma Market Size & Forecast, By Treatment Type, 2021 – 2032
9.4.6.4.3 Multiple Myeloma Market Size & Forecast, By Drug Type, 2021 – 2032
9.4.6.4.4 Multiple Myeloma Market Size & Forecast, By Distribution Channel, 2021 – 2032
9.4.6.5 Australia
9.4.6.5.1 Multiple Myeloma Market Size & Forecast, By Drug Class, 2021 – 2032
9.4.6.5.2 Multiple Myeloma Market Size & Forecast, By Treatment Type, 2021 – 2032
9.4.6.5.3 Multiple Myeloma Market Size & Forecast, By Drug Type, 2021 – 2032
9.4.6.5.4 Multiple Myeloma Market Size & Forecast, By Distribution Channel, 2021 – 2032
9.4.6.6 ASEAN Countries
9.4.6.6.1 Multiple Myeloma Market Size & Forecast, By Drug Class, 2021 – 2032
9.4.6.6.2 Multiple Myeloma Market Size & Forecast, By Treatment Type, 2021 – 2032
9.4.6.6.3 Multiple Myeloma Market Size & Forecast, By Drug Type, 2021 – 2032
9.4.6.6.4 Multiple Myeloma Market Size & Forecast, By Distribution Channel, 2021 – 2032
9.4.6.7 Rest of Asia-Pacific
9.4.6.7.1 Multiple Myeloma Market Size & Forecast, By Drug Class, 2021 – 2032
9.4.6.7.2 Multiple Myeloma Market Size & Forecast, By Treatment Type, 2021 – 2032
9.4.6.7.3 Multiple Myeloma Market Size & Forecast, By Drug Type, 2021 – 2032
9.4.6.7.4 Multiple Myeloma Market Size & Forecast, By Distribution Channel, 2021 – 2032
9.5 Latin America
9.5.1 Key Trends
9.5.2 Multiple Myeloma Market Size & Forecast, By Drug Class, 2021 – 2032
9.5.3 Multiple Myeloma Market Size & Forecast, By Treatment Type, 2021 – 2032
9.5.4 Multiple Myeloma Market Size & Forecast, By Drug Type, 2021 – 2032
9.5.5 Multiple Myeloma Market Size & Forecast, By Distribution Channel, 2021 – 2032
9.5.6 Multiple Myeloma Market Size & Forecast, By Country, 2021 – 2032
9.5.6.1 Brazil
9.5.6.1.1 Multiple Myeloma Market Size & Forecast, By Drug Class, 2021 – 2032
9.5.6.1.2 Multiple Myeloma Market Size & Forecast, By Treatment Type, 2021 – 2032
9.5.6.1.3 Multiple Myeloma Market Size & Forecast, By Drug Type, 2021 – 2032
9.5.6.1.4 Multiple Myeloma Market Size & Forecast, By Distribution Channel, 2021 – 2032
9.5.6.2 Argentina
9.5.6.2.1 Multiple Myeloma Market Size & Forecast, By Drug Class, 2021 – 2032
9.5.6.2.2 Multiple Myeloma Market Size & Forecast, By Treatment Type, 2021 – 2032
9.5.6.2.3 Multiple Myeloma Market Size & Forecast, By Drug Type, 2021 – 2032
9.5.6.2.4 Multiple Myeloma Market Size & Forecast, By Distribution Channel, 2021 – 2032
9.5.6.3 Mexico
9.5.6.3.1 Multiple Myeloma Market Size & Forecast, By Drug Class, 2021 – 2032
9.5.6.3.2 Multiple Myeloma Market Size & Forecast, By Treatment Type, 2021 – 2032
9.5.6.3.3 Multiple Myeloma Market Size & Forecast, By Drug Type, 2021 – 2032
9.5.6.3.4 Multiple Myeloma Market Size & Forecast, By Distribution Channel, 2021 – 2032
9.5.6.4 Colombia
9.5.6.4.1 Multiple Myeloma Market Size & Forecast, By Drug Class, 2021 – 2032
9.5.6.4.2 Multiple Myeloma Market Size & Forecast, By Treatment Type, 2021 – 2032
9.5.6.4.3 Multiple Myeloma Market Size & Forecast, By Drug Type, 2021 – 2032
9.5.6.4.4 Multiple Myeloma Market Size & Forecast, By Distribution Channel, 2021 – 2032
9.5.6.5 Rest of Latin America
9.5.6.5.1 Multiple Myeloma Market Size & Forecast, By Drug Class, 2021 – 2032
9.5.6.5.2 Multiple Myeloma Market Size & Forecast, By Treatment Type, 2021 – 2032
9.5.6.5.3 Multiple Myeloma Market Size & Forecast, By Drug Type, 2021 – 2032
9.5.6.5.4 Multiple Myeloma Market Size & Forecast, By Distribution Channel, 2021 – 2032
9.6 Middle East & Africa
9.6.1 Key Trends
9.6.2 Multiple Myeloma Market Size & Forecast, By Drug Class, 2021 – 2032
9.6.3 Multiple Myeloma Market Size & Forecast, By Treatment Type, 2021 – 2032
9.6.4 Multiple Myeloma Market Size & Forecast, By Drug Type, 2021 – 2032
9.6.5 Multiple Myeloma Market Size & Forecast, By Distribution Channel, 2021 – 2032
9.6.6 Multiple Myeloma Market Size & Forecast, By Country, 2021 – 2032
9.6.6.1 UAE
9.6.6.1.1 Multiple Myeloma Market Size & Forecast, By Drug Class, 2021 – 2032
9.6.6.1.2 Multiple Myeloma Market Size & Forecast, By Treatment Type, 2021 – 2032
9.6.6.1.3 Multiple Myeloma Market Size & Forecast, By Drug Type, 2021 – 2032
9.6.6.1.4 Multiple Myeloma Market Size & Forecast, By Distribution Channel, 2021 – 2032
9.6.6.2 Saudi Arabia
9.6.6.2.1 Multiple Myeloma Market Size & Forecast, By Drug Class, 2021 – 2032
9.6.6.2.2 Multiple Myeloma Market Size & Forecast, By Treatment Type, 2021 – 2032
9.6.6.2.3 Multiple Myeloma Market Size & Forecast, By Drug Type, 2021 – 2032
9.6.6.2.4 Multiple Myeloma Market Size & Forecast, By Distribution Channel, 2021 – 2032
9.6.6.3 Qatar
9.6.6.3.1 Multiple Myeloma Market Size & Forecast, By Drug Class, 2021 – 2032
9.6.6.3.2 Multiple Myeloma Market Size & Forecast, By Treatment Type, 2021 – 2032
9.6.6.3.3 Multiple Myeloma Market Size & Forecast, By Drug Type, 2021 – 2032
9.6.6.3.4 Multiple Myeloma Market Size & Forecast, By Distribution Channel, 2021 – 2032
9.6.6.4 Egypt
9.6.6.4.1 Multiple Myeloma Market Size & Forecast, By Drug Class, 2021 – 2032
9.6.6.4.2 Multiple Myeloma Market Size & Forecast, By Treatment Type, 2021 – 2032
9.6.6.4.3 Multiple Myeloma Market Size & Forecast, By Drug Type, 2021 – 2032
9.6.6.4.4 Multiple Myeloma Market Size & Forecast, By Distribution Channel, 2021 – 2032
9.6.6.5 South Africa
9.6.6.5.1 Multiple Myeloma Market Size & Forecast, By Drug Class, 2021 – 2032
9.6.6.5.2 Multiple Myeloma Market Size & Forecast, By Treatment Type, 2021 – 2032
9.6.6.5.3 Multiple Myeloma Market Size & Forecast, By Drug Type, 2021 – 2032
9.6.6.5.4 Multiple Myeloma Market Size & Forecast, By Distribution Channel, 2021 – 2032
9.6.6.6 Rest of Middle East & Africa
9.6.6.6.1 Multiple Myeloma Market Size & Forecast, By Drug Class, 2021 – 2032
9.6.6.6.2 Multiple Myeloma Market Size & Forecast, By Treatment Type, 2021 – 2032
9.6.6.6.3 Multiple Myeloma Market Size & Forecast, By Drug Type, 2021 – 2032
9.6.6.6.4 Multiple Myeloma Market Size & Forecast, By Distribution Channel, 2021 – 2032
10. Competitive Landscape
10.1 Key Players' Positioning
10.2 Competitive Developments
10.2.1 Key Strategies Adopted (%), By Key Players, 2024
10.2.2 Year-Wise Strategies & Development, 2021 – 2025
10.2.3 Number Of Strategies Adopted By Key Players, 2024
10.3 Market Share Analysis, 2024
10.4 Product/Service & Application Benchmarking
10.4.1 Product/Service Specifications & Features By Key Players
10.4.2 Product/Service Heatmap By Key Players
10.4.3 Application Heatmap By Key Players
10.5 Industry Start-Up & Innovation Landscape
10.6 Key Company Profiles
10.6.1 Johnson & Johnson Services
10.6.1.1 Company Overview & Snapshot
10.6.1.2 Product/Service Portfolio
10.6.1.3 Key Company Financials
10.6.1.4 SWOT Analysis
10.6.2 Bristol-Myers Squibb
10.6.2.1 Company Overview & Snapshot
10.6.2.2 Product/Service Portfolio
10.6.2.3 Key Company Financials
10.6.2.4 SWOT Analysis
10.6.3 Amgen
10.6.3.1 Company Overview & Snapshot
10.6.3.2 Product/Service Portfolio
10.6.3.3 Key Company Financials
10.6.3.4 SWOT Analysis
10.6.4 Takeda Pharmaceutical
10.6.4.1 Company Overview & Snapshot
10.6.4.2 Product/Service Portfolio
10.6.4.3 Key Company Financials
10.6.4.4 SWOT Analysis
10.6.5 Sanofi
10.6.5.1 Company Overview & Snapshot
10.6.5.2 Product/Service Portfolio
10.6.5.3 Key Company Financials
10.6.5.4 SWOT Analysis
10.6.6 Pfizer
10.6.6.1 Company Overview & Snapshot
10.6.6.2 Product/Service Portfolio
10.6.6.3 Key Company Financials
10.6.6.4 SWOT Analysis
10.6.7 AbbVie
10.6.7.1 Company Overview & Snapshot
10.6.7.2 Product/Service Portfolio
10.6.7.3 Key Company Financials
10.6.7.4 SWOT Analysis
10.6.8 Novartis
10.6.8.1 Company Overview & Snapshot
10.6.8.2 Product/Service Portfolio
10.6.8.3 Key Company Financials
10.6.8.4 SWOT Analysis
10.6.9 Roche
10.6.9.1 Company Overview & Snapshot
10.6.9.2 Product/Service Portfolio
10.6.9.3 Key Company Financials
10.6.9.4 SWOT Analysis
10.6.10 GSK
10.6.10.1 Company Overview & Snapshot
10.6.10.2 Product/Service Portfolio
10.6.10.3 Key Company Financials
10.6.10.4 SWOT Analysis
10.6.11 Janssen Pharmaceuticals
10.6.11.1 Company Overview & Snapshot
10.6.11.2 Product/Service Portfolio
10.6.11.3 Key Company Financials
10.6.11.4 SWOT Analysis
10.6.12 Regeneron Pharmaceuticals
10.6.12.1 Company Overview & Snapshot
10.6.12.2 Product/Service Portfolio
10.6.12.3 Key Company Financials
10.6.12.4 SWOT Analysis
10.6.13 Legend Biotech
10.6.13.1 Company Overview & Snapshot
10.6.13.2 Product/Service Portfolio
10.6.13.3 Key Company Financials
10.6.13.4 SWOT Analysis
10.6.14 Karyopharm Therapeutics
10.6.14.1 Company Overview & Snapshot
10.6.14.2 Product/Service Portfolio
10.6.14.3 Key Company Financials
10.6.14.4 SWOT Analysis
10.6.15 Bluebird Bio
10.6.15.1 Company Overview & Snapshot
10.6.15.2 Product/Service Portfolio
10.6.15.3 Key Company Financials
10.6.15.4 SWOT Analysis
10.6.16 Oncopeptides
10.6.16.1 Company Overview & Snapshot
10.6.16.2 Product/Service Portfolio
10.6.16.3 Key Company Financials
10.6.16.4 SWOT Analysis
10.6.17 Genmab
10.6.17.1 Company Overview & Snapshot
10.6.17.2 Product/Service Portfolio
10.6.17.3 Key Company Financials
10.6.17.4 SWOT Analysis
10.6.18 Cellectar Biosciences
10.6.18.1 Company Overview & Snapshot
10.6.18.2 Product/Service Portfolio
10.6.18.3 Key Company Financials
10.6.18.4 SWOT Analysis
10.6.19 Beigene
10.6.19.1 Company Overview & Snapshot
10.6.19.2 Product/Service Portfolio
10.6.19.3 Key Company Financials
10.6.19.4 SWOT Analysis
10.6.20 ImmunoGen
10.6.20.1 Company Overview & Snapshot
10.6.20.2 Product/Service Portfolio
10.6.20.3 Key Company Financials
10.6.20.4 SWOT Analysis
11. Analyst Recommendations
11.1 SNS Insider Opportunity Map
11.2 Industry Low-Hanging Fruit Assessment
11.3 Market Entry & Growth Strategy
11.4 Analyst Viewpoint & Suggestions On Market Growth
12. Assumptions
13. Disclaimer
14. Appendix
14.1 List Of Tables
14.2 List Of Figures
Key Market Segments:
By Drug Class
- Immunomodulators
- Proteasome Inhibitor
- Anti-CD38 Monoclonal Antibody
- Alkylating Agents
By Treatment Type
- Chemotherapy
- Targeted Therapy
- Immunotherapy
- Corticosteroids
- Stem Cell Transplantation
- Radiation Therapy
By Drug Type
- Branded Drugs
- Generic Drugs
By Distribution Channel
- Hospital Pharmacies
- Retail Pharmacies & Drug Stores
- Online Pharmacies
Request for Segment Customization as per your Business Requirement: Segment Customization Request
Regional Coverage:
North America
- US
- Canada
Europe
- Germany
- France
- UK
- Italy
- Spain
- Russia
- Poland
- Rest of Europe
Asia Pacific
- China
- India
- Japan
- South Korea
- Australia
- ASEAN Countries
- Rest of Asia Pacific
Middle East & Africa
- UAE
- Saudi Arabia
- Qatar
- Egypt
- South Africa
- Rest of Middle East & Africa
Latin America
- Brazil
- Argentina
- Mexico
- Colombia
- Rest of Latin America
Request for Country Level Research Report: Country Level Customization Request
Available Customization
With the given market data, SNS Insider offers customization as per the company’s specific needs. The following customization options are available for the report:
- Detailed Volume Analysis
- Criss-Cross segment analysis (e.g., Product X Application)
- Competitive Product Benchmarking
- Geographic Analysis
- Additional countries in any of the regions
- Customized Data Representation
- Detailed analysis and profiling of additional market players
An accurate research report requires proper strategizing as well as implementation. There are multiple factors involved in the completion of good and accurate research report and selecting the best methodology to compete the research is the toughest part. Since the research reports we provide play a crucial role in any company’s decision-making process, therefore we at SNS Insider always believe that we should choose the best method which gives us results closer to reality. This allows us to reach at a stage wherein we can provide our clients best and accurate investment to output ratio.
Each report that we prepare takes a timeframe of 350-400 business hours for production. Starting from the selection of titles through a couple of in-depth brain storming session to the final QC process before uploading our titles on our website we dedicate around 350 working hours. The titles are selected based on their current market cap and the foreseen CAGR and growth.
The 5 steps process:
Step 1: Secondary Research:
Secondary Research or Desk Research is as the name suggests is a research process wherein, we collect data through the readily available information. In this process we use various paid and unpaid databases which our team has access to and gather data through the same. This includes examining of listed companies’ annual reports, Journals, SEC filling etc. Apart from this our team has access to various associations across the globe across different industries. Lastly, we have exchange relationships with various university as well as individual libraries.

Step 2: Primary Research
When we talk about primary research, it is a type of study in which the researchers collect relevant data samples directly, rather than relying on previously collected data. This type of research is focused on gaining content specific facts that can be sued to solve specific problems. Since the collected data is fresh and first hand therefore it makes the study more accurate and genuine.
We at SNS Insider have divided Primary Research into 2 parts.
Part 1 wherein we interview the KOLs of major players as well as the upcoming ones across various geographic regions. This allows us to have their view over the market scenario and acts as an important tool to come closer to the accurate market numbers. As many as 45 paid and unpaid primary interviews are taken from both the demand and supply side of the industry to make sure we land at an accurate judgement and analysis of the market.
This step involves the triangulation of data wherein our team analyses the interview transcripts, online survey responses and observation of on filed participants. The below mentioned chart should give a better understanding of the part 1 of the primary interview.

Part 2: In this part of primary research the data collected via secondary research and the part 1 of the primary research is validated with the interviews from individual consultants and subject matter experts.
Consultants are those set of people who have at least 12 years of experience and expertise within the industry whereas Subject Matter Experts are those with at least 15 years of experience behind their back within the same space. The data with the help of two main processes i.e., FGDs (Focused Group Discussions) and IDs (Individual Discussions). This gives us a 3rd party nonbiased primary view of the market scenario making it a more dependable one while collation of the data pointers.
Step 3: Data Bank Validation
Once all the information is collected via primary and secondary sources, we run that information for data validation. At our intelligence centre our research heads track a lot of information related to the market which includes the quarterly reports, the daily stock prices, and other relevant information. Our data bank server gets updated every fortnight and that is how the information which we collected using our primary and secondary information is revalidated in real time.

Step 4: QA/QC Process
After all the data collection and validation our team does a final level of quality check and quality assurance to get rid of any unwanted or undesired mistakes. This might include but not limited to getting rid of the any typos, duplication of numbers or missing of any important information. The people involved in this process include technical content writers, research heads and graphics people. Once this process is completed the title gets uploader on our platform for our clients to read it.
Step 5: Final QC/QA Process:
This is the last process and comes when the client has ordered the study. In this process a final QA/QC is done before the study is emailed to the client. Since we believe in giving our clients a good experience of our research studies, therefore, to make sure that we do not lack at our end in any way humanly possible we do a final round of quality check and then dispatch the study to the client.