High Purity Gas Market Size Analysis:
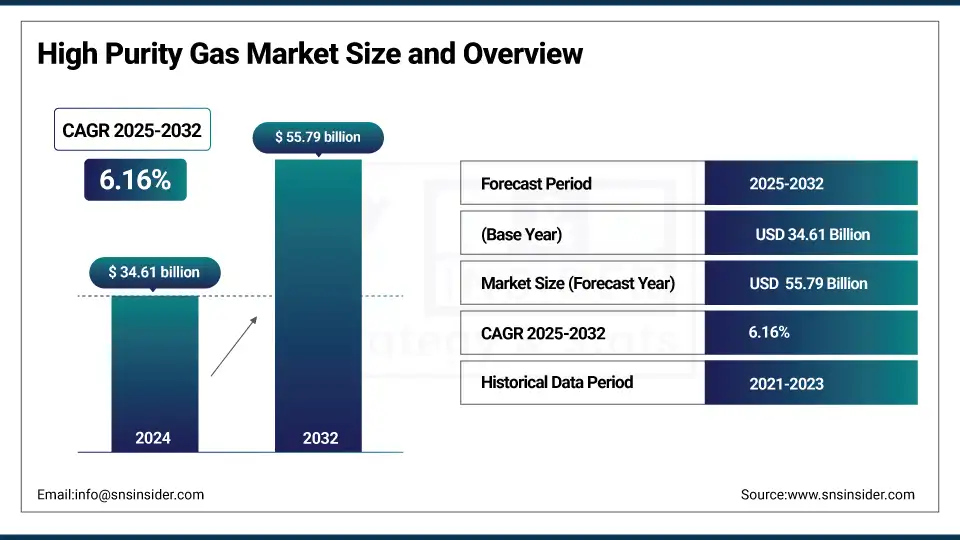
The High Purity Gas market size was valued at USD 34.61 billion in 2024 and is expected to reach USD 55.79 billion by 2032, growing at a CAGR of 6.16% over the forecast period of 2025-2032.
Strong demand from the semiconductor and pharmaceutical industries led by tight purity regulations is driving the high purity gas market. The pure gases high market growth will be using specialty in lithography, cleanroom and noble gases market, which we see applications in line of MRI and electronics. Growing interest in the environment is generating demand for high-purity hydrogen and oxygen aimed at decarbonization. Leading high purity gas suppliers such as Linde won 64 small on-site plant deals in 2024 amidst a supply driven high purity gas market.
To Get more information On High Purity Gas Market - Request Free Sample Report
In 2023 the USGS discovered that the consumption of Grade-A helium had grown to 59 million m³ and valued at $1.1 billion, and the global demand could double by 2035. Air Liquide’s €70m (USD 82.10 million) deal to supply Singapore’s VSMC wafer fab also strengthens the high purity gas market’s size and specialty gas adoption. These trends amplify the analysis of high purity gas market and continue to drive high purity gas market share worldwide.
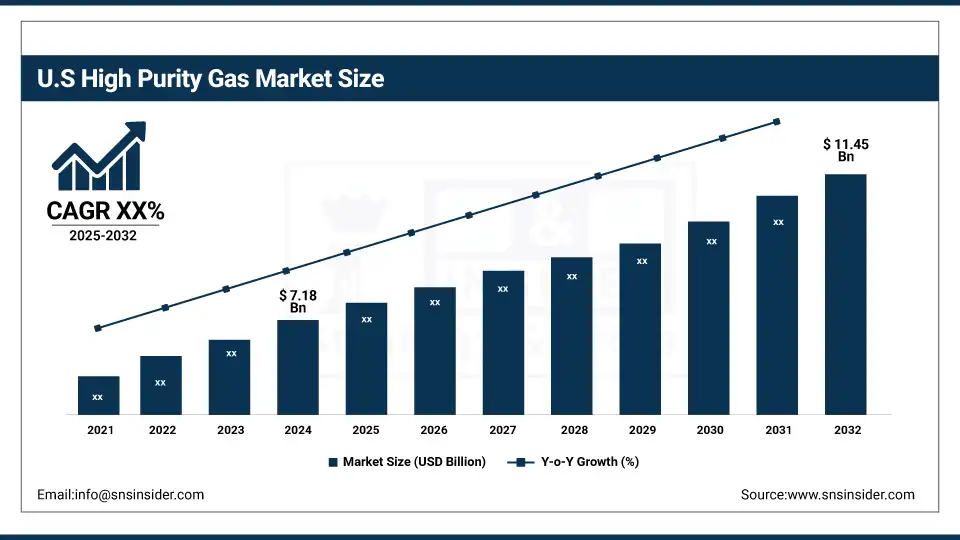
The U.S. dominates North America’s high purity gas market with a market size of USD 7.18 billion and is projected to reach a value of USD 11.45 billion by 2032 with a market share of about 72%, driven by its advanced semiconductor, aerospace, and pharmaceutical industry demands. According to the Semiconductor Industry Association (SIA), over 20 new chip fabs began construction across the U.S. in 2023, all requiring ultra-pure gases like nitrogen and argon. Additionally, the U.S. FDA mandates the use of pharmaceutical-grade gases in drug formulation and sterilization, enhancing demand. Leading high purity gas companies such as Air Products and Praxair (now part of Linde) have expanded capacity to meet the country’s industrial-scale requirements.
High Purity Gas Market Dynamics:
Drivers:
-
Expansion of advanced semiconductor manufacturing increases specialty gas requirements
The high purity gas market is growing with the increasing installation of semiconductor unit plants in which ultra high purity specialty gases such as nitrogen trifluoride and silane are used. Air Liquide has recently commissioned new purification facilities in South Korea to address this requirement. The noble gas market, helium and neon, is also increasing through the demands of EUV lithography. With increasing global chip investment, the demand for precision gas will drive the growth of the high purity gas market and consolidated role of large high purity gas enterprises.
-
Hydrogen transition in heavy industry drives growth in high purity electrolysis gases
The trend towards green hydrogen generation is fuelling demand for ultra-pure gases, notably hydrogen and oxygen for electrolysis. The energy ministry of Germany reported that the capacity for electrolyzers in 2023 had grown some 150% and that these needed super-clean gas input. Gas suppliers of high purity gases are getting contracts with steel and ammonia producers for on-site supply. This transition underpins longer-term high purity gas market growth and reinforces the specialty gases sector, specifically where clean energy targets and decarbonisation efforts mirror the need for purity and reliability.
Restraints:
-
Supply constraints from geopolitical risks affect noble gas availability
The market for noble gases has been upended by geopolitical Change, namely the Russia–Ukraine conflict, which has diminished helium and neon exports. Overall Grade-A helium supply, the U.S. Geological Survey reports, was down 12% in 2023. This dearth has led to price increases and lack of availability for gas‐companies of high purity, particularly serving the semiconductor and electronics markets. The volatility is a major obstacle to market growth for high purity gas buyers who must revaluate their strategy for supply and their contingency plans as a result.
High Purity Gas Market Segmentation Analysis:
By Type
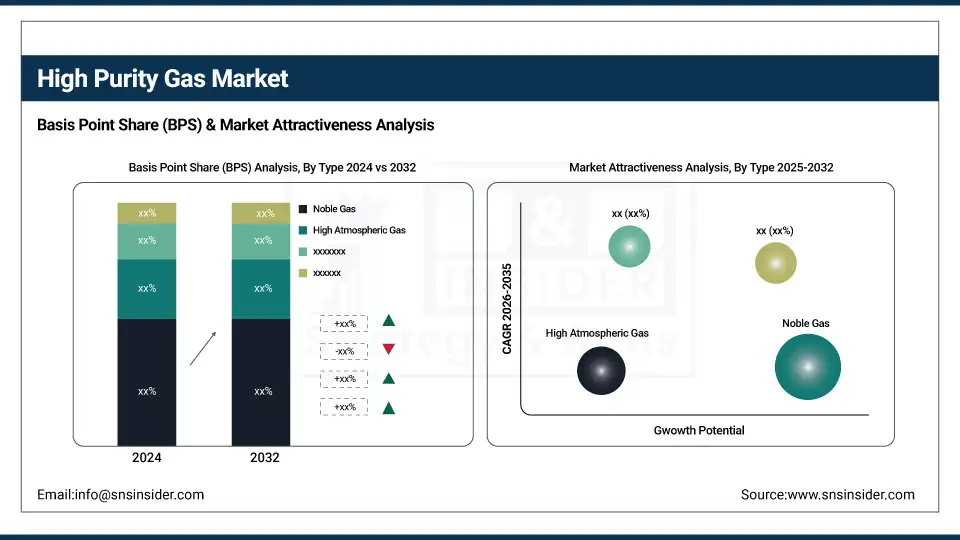
Noble gas dominated the high purity gas market in 2024 with a market share of 40.6%. Its dominance is driven by extensive applications in aerospace, defense lasers, and scientific research. NASA’s current propulsion testing also employs xenon as a thruster fuel, bringing us closer to real-world use case. In April 2023, the US Department of Defense disclosed its plan to use more krypton and xenon for satellite propulsion. This regular government use of the noble gases has enabled them to dominate the high purity gas market.
High atmospheric gas is the fastest-growing segment in the high purity gas market from 2025 to 2032, with a CAGR of 6.51%. Its growth is backed by employing it for space life-support systems and by using it in controlled atmosphere packaging. NASA’s life sciences division says oxygen purity of greater than 99.99% is required for onboard crew cabin atmospheres. Likewise, the U.S. Department of Agriculture endorses modified atmosphere packaging for the export of perishable food goods via high-purity nitrogen, indicating segmental growth in food and space tech applications.
By Function
Insulation dominated the high purity gas market in 2024 with a 48.3% market share. It is widely used in high-voltage switchgear systems and thermal insulation in vacuum panels. The U.S. Department of Energy Smart Grid Program recognized nitrogen mixtures as important insulators for the smart transmission and distribution grid. Firms such as General Electric have modified gas-insulated switchgear concepts using a cleaner gas. This function allows for the safe and tactical distribution of power, and insulation remains firmly in place as the top material in the HP gas market.
Coolant is the fastest-growing function in the high purity gas market from 2025 to 2032, growing at a CAGR of 6.46%. Its increasing application in the organ transportation and vaccine storage also drives the growth. mRNA vaccines need to be stored at ultradeep-freeze temperatures, using liquid nitrogen, according to the U.S. Centers for Disease Control and Prevention. Biomedical logistics companies like Cryoport have scaled infrastructure to accommodate temperature-sensitive shipments, pushing up demand for ultra-high purity coolant gases within the medical field.
By Storage & Distribution And Transportation
Commercial vehicles dominated the high purity gas market in 2024 with a 52.8% share due to their role in refrigerated logistics and emissions control. The U.S. Department of Agriculture reported a 23% rise in refrigerated truck deliveries between 2021 and 2023, necessitating the continuous use of carbon dioxide and nitrogen gases for temperature regulation. Furthermore, high purity urea-based SCR systems are essential in trucks to reduce NOx emissions, establishing commercial fleets as key contributors to market dominance.
Passenger vehicles are the fastest growing segment from 2025 to 2032 in the high purity gas market with a CAGR of 27.59%. Growth is largely attributed to electric vehicle battery manufacturing processes that use high purity gases for electrode drying and chamber cleaning. Tesla’s 2023 battery facility expansions in Texas include dry room technology utilizing ultra-pure nitrogen and argon. Supportive government incentives for EV manufacturing reinforce this trend, promoting advanced gas adoption in passenger vehicle production lines.
By End-Use Industry
Electronics dominated the high purity gas market in 2024 with a 36.8% market share, driven by innovations in OLED and quantum display manufacturing. LG Display in 2023 unveiled expanded use of high-purity fluorine-based gases in next-generation panel production. Vietnam, the Korea Display Industry Association also pointed to a rise of noble gas usage in flat panel production lines. Strict purity levels are given, as well as validated need for them, to liberate the electronics sector as the driving force of high-purity gas market and consequent supply chain.
Chemicals is the fastest growing end-use industry from 2025 to 2032, with a CAGR of 7.09%, supported by the agrochemical and polymer synthesis sectors. In 2023, DuPont expanded its ethylene copolymer production capacity, requiring high purity nitrogen for inert reaction environments. The American Chemical Society emphasized the growing need for precise gas composition in polymer chain development. This industrial transformation increases demand for ultra-pure gases, securing the chemical industry’s position as a key growth segment.
High Purity Gas Market Regional Analysis:
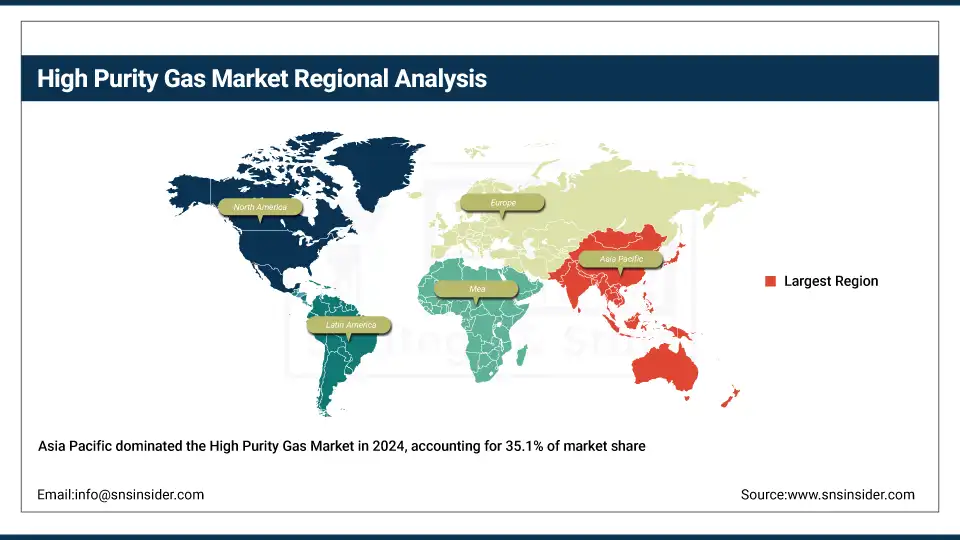
Asia Pacific dominates the high purity gas market with a 35.1% market share in 2024 and is the fastest-growing region with a CAGR of 6.53% from 2025 to 2032, driven by rapid industrialization in electronics and solar manufacturing. According to the Asia Industrial Gases Association, government investments in semiconductor hubs and clean energy projects boost demand for noble and ultra-pure gases. China leads this growth, producing over 30% of global wafers in 2023, with Air Liquide and Linde expanding operations to meet purity standards set by the Ministry of Industry and Information Technology.
Get Customized Report as per Your Business Requirement - Enquiry Now
North America held a 28.7% share in the high purity gas market in 2024 due to strong industrial gas infrastructure, particularly in electronics and healthcare. The region’s specialty gases consumption is rising with semiconductor investments and advanced medical facilities. In October 2023, the U.S. Department of Energy (DOE) launched clean hydrogen projects that depend on high purity atmospheric gases. Additionally, the Compressed Gas Association (CGA) has set standards for purity levels, boosting regulatory alignment and quality across industrial applications. These trends continue to support high purity gas market growth in North America.
High Purity Gas Market Key Players:
The major high purity gas market competitors include Linde plc, Air Liquide S.A., Air Products and Chemicals, Inc., Messer Group GmbH, Matheson Tri-Gas, Inc., Iwatani Corporation, Nippon Sanso Holdings Corporation, Taiyo Nippon Sanso Corporation, Resonac Holdings Corporation, and Gruppo SIAD S.p.A.
Recent Developments in the High Purity Gas Market:
-
In July 2025, Jewellok expanded its ultra-high-purity gas solutions with new diaphragm valves and delivery systems for semiconductor, biotech, and aerospace use, enhancing leak integrity and gas purity standards.
-
In January 2025, INOX Air Products launched India’s first ultra-high-purity nitrous oxide plant in Chennai, supplying 99.9999% purity gas to support domestic semiconductor and electronics manufacturing initiatives.
| Report Attributes | Details |
|---|---|
| Market Size in 2024 | USD 34.61 billion |
| Market Size by 2032 | USD 55.79 billion |
| CAGR | CAGR of 6.16% From 2025 to 2032 |
| Base Year | 2024 |
| Forecast Period | 2025-2032 |
| Historical Data | 2021-2023 |
| Report Scope & Coverage | Market Size, Segments Analysis, Competitive Landscape, Regional Analysis, DROC & SWOT Analysis, Forecast Outlook |
| Key Segments | •By Type (High Atmospheric Gas, Noble Gas, Carbon Gas, and Others), •By Function (Insulation, Illumination, and Coolant), •By Storage & Distribution And Transportation (Cylinders/Packaged Gas, Merchant Liquid, and Tonnage), •By End-Use Industry (Electronics, Metal Production, Chemicals, Oil & Gas, Medical & Healthcare, Food & Beverage, and Others) |
| Regional Analysis/Coverage | North America (US, Canada, Mexico), Europe (Germany, France, UK, Italy, Spain, Poland, Turkey, Rest of Europe), Asia Pacific (China, India, Japan, South Korea, Singapore, Australia, Rest of Asia Pacific), Middle East & Africa (UAE, Saudi Arabia, Qatar, South Africa, Rest of Middle East & Africa), Latin America (Brazil, Argentina, Rest of Latin America) |
| Company Profiles | Linde plc, Air Liquide S.A., Air Products and Chemicals, Inc., Messer Group GmbH, Matheson Tri-Gas, Inc., Iwatani Corporation, Nippon Sanso Holdings Corporation, Taiyo Nippon Sanso Corporation, Resonac Holdings Corporation, and Gruppo SIAD S.p.A. |
Frequently Asked Questions
Asia-Pacific leads the high purity gas market growth, supported by China’s wafer production and clean-tech investments.
Companies face noble gas shortages and price volatility due to geopolitical tensions and supply disruptions.
Asia-Pacific dominates the high purity gas market due to strong electronics manufacturing and expanding clean energy initiatives.
Electronics and pharmaceutical industries are key consumers, driven by cleanroom, semiconductor, and drug sterilization applications.
The high purity gas market is projected to grow at a CAGR of 6.16% between 2025 and 2032.
Get in Touch
