Hydrogenated Vegetable Oil Market Size & Overview:
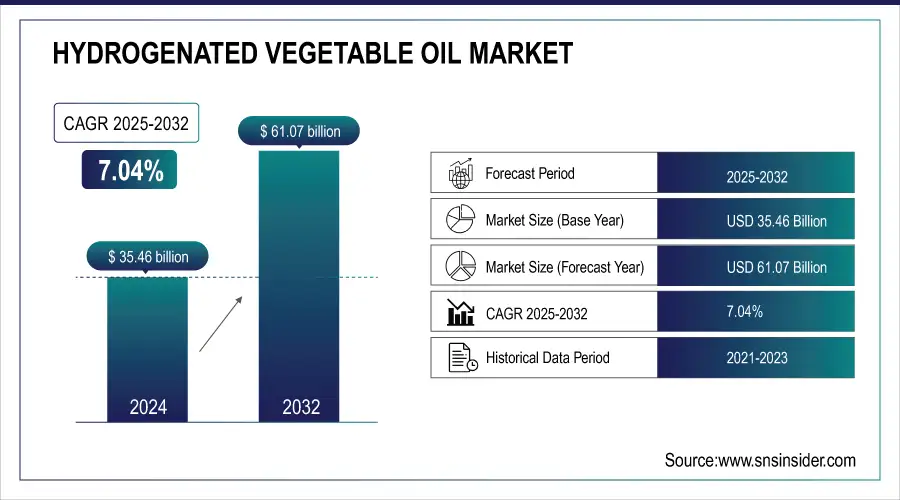
The Hydrogenated Vegetable Oil Market size was valued at USD 35.46 billion in 2024 and is expected to reach USD 61.07 billion by 2032, growing at a CAGR of 7.04% over the forecast period of 2025-2032.
Rising sustainability standards and the advent use of feedstock propel the hydrogenated vegetable oil market. Key participants in the industrial hydrogenated vegetable oil industry are incorporating waste oils and tall oil for renewable diesel manufacturing in line with market demand for decarbonization. Hydrogenated vegetable oil companies such as Cargill uprooted trans fats from their incumbent position by introducing HVO alternatives and improving clean-label offerings in the food and feed premix applications. Market demand is supported by government programs, including the U.S. Renewable Fuel Standard and California’s Low Carbon Fuel Standard.
To Get more information on Hydrogenated Vegetable Oil Market - Request Free Sample Report
According to the U.S. Energy Information Administration, production of renewable diesel averaged 170,000 barrels per day in 2023, reflecting a significant growth in market size and market share. Neste’s €1.9 billion (USD 2.20 billion) Rotterdam expansion to 2.7 million tons in 2026 is an example of strategic scaling in the hydrogenated veg oil market that we can use to model markets.
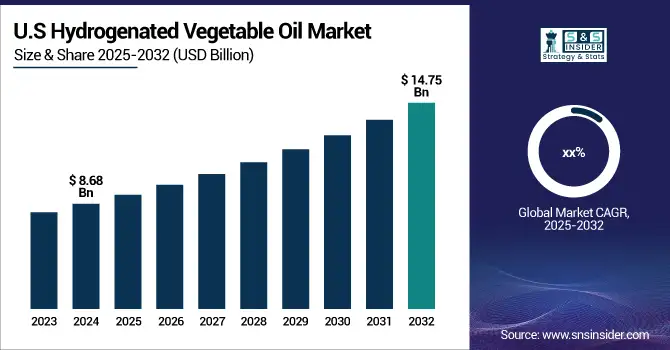
The U.S. leads the region with a market size of USD 8.68 billion in 2024 and is projected to reach a value of USD 14.75 billion by 2032, with a market share of about 70.3%, with policies such as the Renewable Fuel Standard and California’s Low Carbon Fuel Standard that promote HVO use. U.S. Energy Information Administration data showed 170,000 b/d of renewable diesel in 2023, with a large portion coming from unfractionated HVO.
Hydrogenated Vegetable Oil Market Growth Drivers:
-
Renewable diesel policies worldwide are accelerating the industrial hydrogenated vegetable oil market growth
National clean energy policies, including the U.S. Renewable Fuel Standard and Brazil’s RenovaBio, continue to drive the use of hydrogenated vegetable oil as an attractive, sustainable fuel feedstock. These incentives are leading companies like Valero and Neste to increase output. This expansion of the industrial hydrogenated vegetable oil market is advantageously boosting trends in the hydrogenated vegetable oil market that are concentrated on biofuel blending, emission reduction, and decarbonization. This regulatory impetus has gone to created profitable opportunities for the hydrogenated vegetable oil industry trends and for gaining a competitive edge towards the global energy transition initiatives.
-
Expanding feed premix applications to support hydrogenated vegetable oil integration into animal nutrition
Hydrogenated vegetable oil is now included in the feed premixes market as a functional premix additive. Due to its high energy density and its ability to be mixed into vitamin premix formulations, hydrogenated vegetable oil makes better utilization of nutritional values in the feed of animals. This is in line with the growing demand for fortified animal nutrition in Asia and North America. Hydrogenated vegetable oil market analysis indicates the development of R&D to improve oil-in-feed formulations by companies, which enables the growth of the hydrogenated vegetable oil market in agriculture and livestock industries.
Hydrogenated Vegetable Oil Market Restraints:
-
Growing competition from advanced bio-based oils challenges the hydrogenated vegetable oil market share
Advanced bio-based oils like hydrotreated esters and fatty acids , and oil from algae are gaining interest from large biofuel and food producers. These options provide better performance and sustainability scorecards, and they are turning the heads of feed premix and energy companies. With an increasing number of hydrogenated vegetable oils firms starting to look at other lipid technologies, the traditional hydrogenated vegetable oil market expansion may slow down. On the other hand, emerging alternatives are likely to limit the dependence on traditional hydrogenated vegetable oil, thereby affecting the long-term hydrogenated vegetable oil market outlook.
Hydrogenated Vegetable Oil Market Segmentation Analysis:
By Type
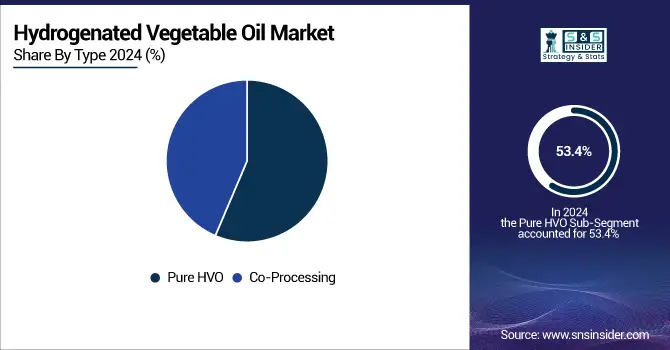
Pure hydrogenated vegetable oil dominated in 2024 with 53.4% market share, largely due to its versatility across food, feed, and industrial uses. Its uniform quality and functionality make it ideal for the food & beverage industry as it enables manufacturers to meet FDA and USDA recommendations for trans-fat reduction. Cargill and Wilmar International push for pure HVO in their offerings and support the hydrogenated vegetable oil market progression for more health-friendly options, as well as wider premix additive uses.
The co-processing segment is the fastest growing with a 7.12% CAGR (2025–2032), driven by refinery integration, blending vegetable oils with fossil fuels to meet renewable energy mandates. TotalEnergies and Shell have led co-processing initiatives that make use of these techniques and produce lower-carbon footprints. Such hybrid fuels, encouraged by regulatory measures such as the U.S. Renewable Fuel Standard, are contributing to a market share uptake of hydrogenated vegetable oil in industrial and energy sectors pursuing decarbonization and biofuel diversification.
By Grade
Unfractionated segment dominated with 43.7% market share in 2024, driven by its extensive use in renewable diesel and biofuel sectors. Its reduced refining needs are perfect for industrial use on a bigger scale. For example, according to the U.S. Energy Information Administration, in 2023, large plants were producing substantial amounts of renewable diesel from unfractionated hydrogenated vegetable oil. Valero’s Diamond Green Diesel and the like use it to produce fuel relatively inexpensively, supporting trends in the unfractionated hydrogenated vegetable oil market that uses scalable, renewable fuel solutions.
Fractionated segment is the fastest growing with a 7.37% CAGR forecasted for 2025–2032, favored in high-purity applications such as cosmetics and specialty chemicals. BASF and Croda International are ramping up production of fractionated hydrogenated vegetable oil in response to consumer demand for clean-label, sustainable personal care. Government regulations such as the EU Green Deal and California’s Low Carbon Fuel Standard spur widespread use, driving up the market share of hydrogenated vegetable fat in the specialty segment with a premium on pricing and margins.
By End-use
The food & beverage segment dominated with 37.6% market share in 2024, driven by the need for clean-label, trans-fat-free hydrogenated vegetable oils for baked goods, snacks, and processed foods. This trend was hastened by the FDA’s decision to remove the partially hydrogenated oils regulations. Hydrogenated vegetable oil provided as a vitamin premix is offered by companies such as Cargill, ADM & this fosters the growth of the feed premixes market as well as healthier product formulation.
The personal care and cosmetics segment is the fastest growing, with a 7.46% CAGR forecasted for 2025–2032, driven by increasing consumer demand for sustainable, plant-derived ingredients. BASF and Croda introduce hydrogenated vegetable oil-based emulsifiers and stabilisers for skin care in response to eco-friendly trends. Innovation: Government programs, including the EU’s cosmetic ingredient safety evaluations, are considered to be important drivers for market growth, increasing the market share for hydrogenated vegetable oil in both natural cosmetics and premium personal care products.
Hydrogenated Vegetable Oil Market Regional Outlook:
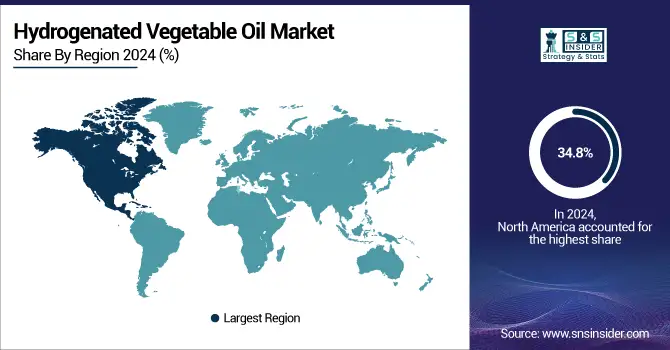
North America dominated the hydrogenated vegetable oil market in 2024 with a 34.8% share, owing to high renewable diesel production and favorable regulations. Industry leaders such as Valero’s Diamond Green Diesel and Neste’s expansion are indicative of industrial hydrogenated vegetable oil market trends towards large-scale, low-carbon energy solutions.
Get Customized Report as per Your Business Requirement - Enquiry Now
Europe held a significant 30.6% share in 2024, ranking third globally, driven by eco-friendly EU biofuel mandates and renewable energy plans. Key countries such as the Netherlands and Finland charted the way forward with projects such as Neste’s Rotterdam expansion and TotalEnergies’ La Mède biorefinery. Germany made HVO inroads to support Auch’s local dominance. These trends complement the trends prevailing in the hydrogenated vegetable oil market for low-emissive fuels, leading to strong prospects in the hydrogenated vegetable fat market, with feed premixes and clean-label additives in the food and cosmetics industry in particular.
Asia Pacific was the second-largest and fastest-growing region in 2024, with a 24.7% share and a 7.52% CAGR, driven by increasing biofuel policies and the growth of HVO capacity. Governments throughout China, India, and Japan implemented mandates promoting the use of renewable diesel, such as India’s national bio-energy mission. Companies such as Wilmar, Musim Mas, and Eneos bought into companies producing hydrogenated vegetable oils to serve growing markets for both energy and cosmetics. These trends are also contributing to the feed premixes market expansion through the incorporation of HVO-based vitamin premix additives in the animal feed architectures.
The Latin American region is a significant market for hydrogenated vegetable oil through 2025, supported by RenovaBio and biodiesel blend mandates in Brazil. HVO production is being scaled up in Brazil by Petrobras and BSBios for domestic and export markets. A healthy output of soybean oil from Argentina supports feedstock availability. The region is also witnessing hydrogenated vegetable oil inclusion in animal feed premix lines following feed premix market trends in nutrition and clean label purposes. These advances are driving the growth of the hydrogenated vegetable oil market and are promoting a sustainable agricultural value chain.
The Middle East & Africa are projected to emerge as a lucrative region during the forecast period, as the Biofuels Industrial Strategy from South Africa encourages the production of renewable fuels from non-food feedstocks. The UAE’s Net Zero 2050 target and ENOC’s pilot projects in sustainable fuels are indicative of regional progress. Industrial and food-grade HVO applications are being considered by Egypt under its Green Economy programmes. These initiatives dovetail with hydrogenated vegetable oil industry analysis that promotes sustainable feed premixes market and renewable energy, by utilizing HVO as a premix additive at agro-based industries.
Hydrogenated Vegetable Oil Market Companies are:
The major hydrogenated vegetable oil market competitors include Neste, TotalEnergies, Eni S.p.A., Valero Energy (Diamond Green Diesel), World Energy, UPM Biofuels, Preem AB, Repsol, Chevron (REG – Renewable Energy Group), and Cepsa.
Recent Developments:
-
In May 2025, Cargill removed trans fats by innovating hydrogenated vegetable oil alternatives, promoting health-conscious formulations, and supporting clean-label trends in food and feed premix markets.
-
In April 2025, BBC reported rising food costs drove demand for sustainable oils like hydrogenated vegetable oil, prompting companies to strengthen feed premix strategies amid global supply disruptions.
| Report Attributes | Details |
|---|---|
| Market Size in 2024 | USD 35.46 billion |
| Market Size by 2032 | USD 61.07 billion |
| CAGR | CAGR of 7.04% From 2025 to 2032 |
| Base Year | 2024 |
| Forecast Period | 2025-2032 |
| Historical Data | 2021-2023 |
| Report Scope & Coverage | Market Size, Segments Analysis, Competitive Landscape, Regional Analysis, DROC & SWOT Analysis, Forecast Outlook |
| Key Segments | •By Grade (Unfractionated, Fractionated, Others) •By Type (Pure HVO, Co-processing) •By End-use (Food & Beverage, Personal Care and Cosmetics, Industrial, Others) |
| Regional Analysis/Coverage | North America (US, Canada, Mexico), Europe (Germany, France, UK, Italy, Spain, Poland, Turkey, Rest of Europe), Asia Pacific (China, India, Japan, South Korea, Singapore, Australia, Rest of Asia Pacific), Middle East & Africa (UAE, Saudi Arabia, Qatar, South Africa, Rest of Middle East & Africa), Latin America (Brazil, Argentina, Rest of Latin America) |
| Company Profiles | Neste, TotalEnergies, Eni S.p.A., Valero Energy (Diamond Green Diesel), World Energy, UPM Biofuels, Preem AB, Repsol, Chevron (REG – Renewable Energy Group), and Cepsa |
Frequently Asked Questions
Food & beverage and personal care industries are driving the hydrogenated vegetable oil market growth through clean-label demand.
Co-processing and refinery integration, blending HVO with fossil fuels, are key hydrogenated vegetable oil market trends.
North America, followed by Asia Pacific and Europe, is expected to dominate the hydrogenated vegetable oil market share.
Leading hydrogenated vegetable oils companies include Neste, Valero, TotalEnergies, Chevron, Eni S.p.A., and Cargill.
The hydrogenated vegetable oil market is projected to grow at a CAGR of 7.04% from 2025 to 2032.
Get in Touch
