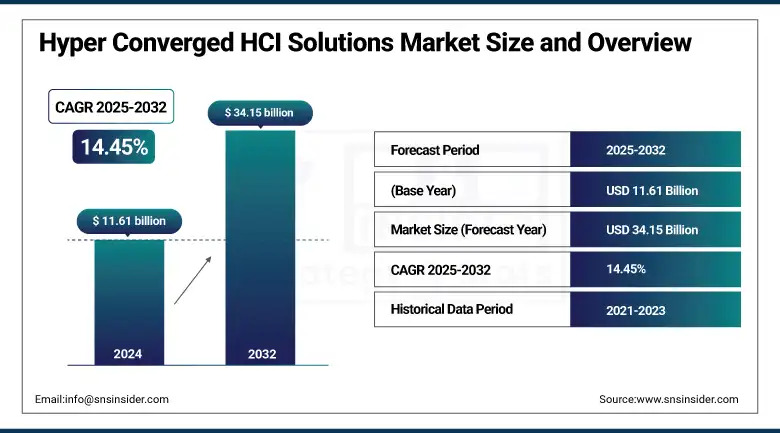
The Hyper Converged HCI Solutions Market size was valued at USD 11.61 billion in 2024 and is expected to reach USD 34.15 billion by 2032, expanding at a CAGR of 14.45% over the forecast period of 2025-2032.
The Hyper-Converged Infrastructure (HCI) Solutions Market is rapidly expanding as organizations seek streamlined, scalable, and cost-effective IT infrastructure. By integrating compute, storage, and networking into a unified, software-defined platform, HCI simplifies operations and enhances performance across data centers and edge environments. The increasing adoption of hybrid cloud, virtualization requirements, and digital transformation initiatives is driving the market. Businesses are using HCI for cost-effective backup and disaster recovery, workload consolidation, and agility. New capabilities such as support for Kubernetes and AI-guided automation are also driving adoption. North America is the dominating region in the market, whereas Asia Pacific is expected to be emerging as the fastest-growing region due to growing cloud and data center spending.
According to research, as of 2024, over 58% of enterprises globally have implemented or are piloting HCI solutions, with many reporting up to a 40% reduction in infrastructure costs due to streamlined management and reduced hardware expenditures.
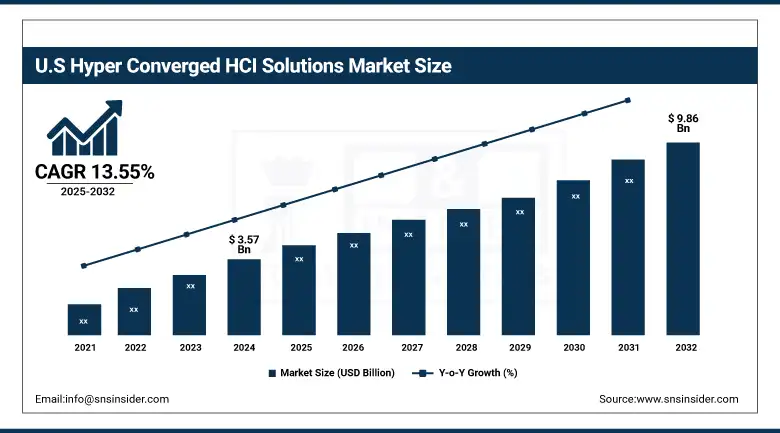
The U.S Hyper Converged HCI Solutions Market size reached USD 3.57 billion in 2024 and is expected to reach USD 9.86 billion in 2032 at a CAGR of 13.55% from 2025 to 2032.
The US hyper-converged infrastructure (HCI) solutions market is the most significant market due to the early and high adoption of the virtualization technology in the US, hybrid cloud strategies, and software-defined infrastructure. American enterprises are spending significantly on digital transformation, edge computing, and refreshing legacy systems, as major factors that fuel the adoption of HCI. The existence of big market players like Dell Technologies, VMware, Cisco, and Nutanix helps speed up product innovations, customer onboarding, and market penetration. Strong enterprise needs for easy-to-manage IT, solid disaster recovery, and scalable infrastructure also drive growth.
Drivers:
Rising Enterprise Shift Toward Simplified and Scalable Infrastructure Accelerates Technology Deployment Globally.
Enterprises are increasingly shifting toward simplified, software-defined infrastructure to eliminate legacy complexities and reduce operating costs. HCI consolidates calculation, storage, and networking control into a single tool set, simplifying scale and operational agility. This represents an increasing interest in hybrid cloud support, edge deployments, and virtual desktop infrastructure (VDI). The recent announcements, such as VMware’s vSAN Max and Nutanix GPT integration, show some performance and automated enhancements. Enterprises are now adopting HCI for a variety of goals, such as ultra-fast disaster recovery, consolidated workloads, and AI readiness, such that it is becoming a standard for digital transformation and next-generation data center strategies.
Restraints:
Lack of Skilled IT Professionals and High Initial Deployment Costs Hamper Rapid Market Adoption Across SMEs.
Despite increasing demand, many small and medium enterprises (SMEs) struggle with the high upfront costs and lack of skilled personnel required to deploy and manage HCI environments effectively. Advanced HCI solutions demand expertise in virtualization, hybrid cloud orchestration, and software-defined storage resources often unavailable to smaller IT teams. This complexity acts as a barrier, particularly in developing economies. While vendors are launching simplified or managed HCI offerings, cost concerns and resource constraints still limit adoption among cost-sensitive customers.
Opportunities:
Growing Edge Computing and 5G Deployment Open New Use Cases for Hyper-Converged Infrastructure Platforms.
The proliferation of edge computing and 5G networks is opening new opportunities for hyper-converged infrastructure to support latency-sensitive and distributed workloads. As enterprises deploy applications closer to the data source, compact and scalable HCI nodes are ideal for edge sites due to their modular design and simplified management. Vendors like HPE and Scale Computing have launched edge-optimized HCI solutions integrated with AI/ML capabilities and real-time analytics support. The demand for autonomous systems, smart cities, and IoT-driven services further enhances this growth trajectory, making edge HCI an emerging frontier for service innovation and infrastructure decentralization.
Challenges:
Complex Integration with Legacy Systems and Existing Infrastructure Creates Operational and Compatibility Challenges.
Integrating HCI solutions with legacy infrastructure remains a major challenge for enterprises undergoing digital transformation. Many organizations operate with outdated systems and fragmented IT environments, making it difficult to unify operations under a single HCI architecture. Compatibility issues with older storage arrays, networking protocols, and application stacks often require costly customization or migration. These technical limitations can delay deployments and lead to suboptimal performance. Vendors focus on API integration, yet aligning with legacy systems remains a challenge, limiting seamless scalability and ROI potential.
By Component
The hardware segment dominated the market with a 62.27% share of revenue in 2024, driven by demand for integrated appliances that bundle compute, storage, and networking into a single chassis. Major players like Dell Technologies (VxRail) and Cisco (HyperFlex) are continuously launching performance-optimized hardware platforms for hybrid cloud and edge deployments. Rising investments in private data centers and latency-sensitive applications are fueling the preference for appliance-based HCI systems.
The software segment is projected to grow at the highest CAGR of 15.25%, propelled by the shift toward software-defined infrastructure. Vendors like Nutanix (AOS) and VMware (vSAN) are enabling flexible, hardware-agnostic HCI platforms that support hybrid and multi-cloud strategies. The rapid rise of containerized applications, the need for lifecycle automation, and the increasing demand for platform-agnostic scalability are accelerating software adoption. This trend makes the software component essential for future-ready, agile enterprise IT environments.
By Application
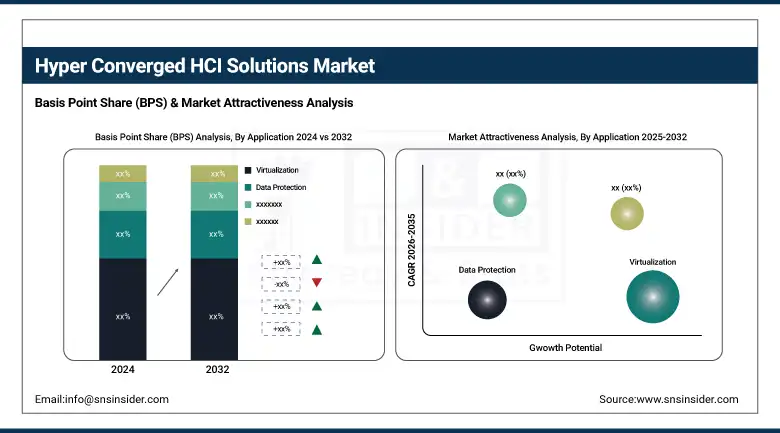
The virtualization segment accounted for the largest revenue share at 31.30% in 2024, owing to high demand for server consolidation, VDI, and application mobility. Companies like Nutanix and VMware have optimized their platforms for virtual workload management, streamlining provisioning and performance. The rise in remote work and hybrid workforce models has further strengthened the use of virtualization in HCI as a core use case, delivering cost efficiency and operational agility.
The data protection segment is expected to register the highest CAGR of 15.67% through 2032. Growing concerns about ransomware, compliance (e.g., GDPR, HIPAA), and disaster recovery are boosting demand for built-in backup and replication features. Firms like Cohesity and Veeam are enhancing data protection as-a-service, integrated into HCI stacks for seamless, end-to-end coverage.
By Enterprise Size
Large enterprises dominated the market with a 65.38% revenue share in 2024, attributed to their scale, complex workloads, and need for centralized governance across distributed IT environments. Solutions like Cisco HyperFlex and VMware Cloud Foundation are tailored for enterprise deployments, providing high performance, compliance, and scalability. With digital transformation accelerating, large enterprises remain the primary adopters of HCI for modernizing core infrastructure.
SMEs are expected to grow at the fastest CAGR of 15.12% over the forecast period, as vendors deliver cost-effective and easy-to-manage HCI solutions tailored to small business needs. Companies like Scale Computing and StarWind offer subscription-based platforms with reduced operational complexity. HCI’s plug-and-play deployment, lower total cost of ownership, and cloud compatibility are attracting a growing base of SME adopters.
By End Use
The BFSI segment led the market with a 24.58% revenue share in 2024, driven by stringent compliance mandates and the need for high-availability infrastructure. Institutions are deploying HCI to support real-time analytics, fraud detection, and secure transactions. Vendors like Nutanix and Fortinet are offering specialized financial-grade HCI platforms with layered security and robust data governance, enabling continuous operations in banking and insurance environments.
The healthcare segment is projected to grow at the fastest CAGR of 16.33% during 2025–2032, supported by growing telemedicine, EMR/EHR systems, and diagnostic imaging workloads. HCI helps hospitals meet HIPAA compliance, protect sensitive patient data, and streamline performance across clinical systems. Solutions like HPE SimpliVity are designed for healthcare environments with built-in backup and rapid disaster recovery, driving adoption in hospitals and medical research facilities.
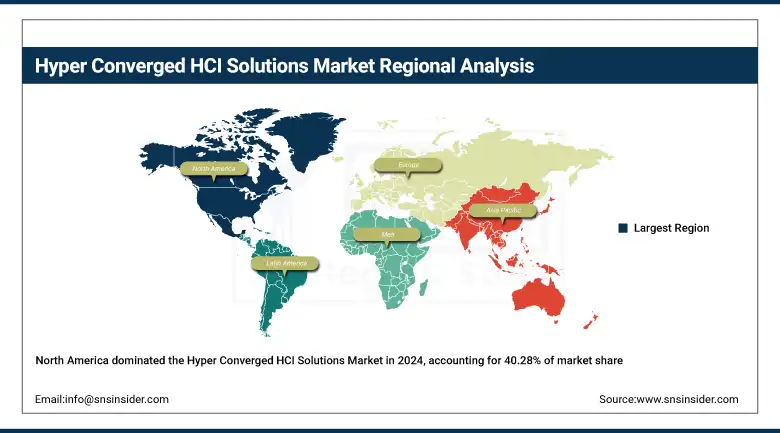
North America held the largest share of the Hyper-Converged HCI Solutions Market in 2024, accounting for 40.28% of global revenue. This dominance is attributed to the early adoption of virtualization technologies, the strong presence of key players like VMware, Nutanix, and Cisco, and widespread cloud migration. Additionally, enterprise focus on IT modernization and data center consolidation continues to fuel HCI adoption across industries. The United States is the dominant country in this region due to its mature IT infrastructure, large-scale enterprise demand, and continuous investments in hyper-converged and hybrid cloud technologies from market leaders like Dell EMC and HPE.
Europe represents a substantial portion of the market, driven by digital transformation efforts across banking, healthcare, and manufacturing sectors. The rise of data localization regulations such as GDPR and the growing emphasis on secure, scalable, and cost-efficient infrastructure have accelerated HCI deployment across mid-sized and large enterprises in the region. Germany dominates the European market due to its strong industrial base, investment in smart manufacturing, and leadership in Industry 4.0 initiatives, all of which demand robust, virtualized infrastructure.
Asia Pacific is the fastest-growing region in the market, with a share of 22.28% in 2024 and an accelerating CAGR. Rapid digitalization, increasing SME cloud adoption, and government-backed smart infrastructure projects are fueling market growth. Enterprises are leveraging HCI for scalable, secure deployments in sectors like finance, education, and e-commerce. China leads the region with aggressive investments in cloud infrastructure, edge computing, and smart city deployments. Its digital economy and initiatives like “New Infrastructure” heavily support hyper-converged technology adoption.
The Middle East & Africa and Latin America are experiencing steady growth in HCI adoption, fueled by data center modernization, cloud initiatives, and rising demand for scalable, cost-efficient infrastructure across banking, telecom, and public sectors. The UAE leads in MEA due to cloud-first strategies, while Brazil dominates Latin America through strong digital transformation and enterprise-driven deployments.
The major key players of the Hyper Converged HCI Solutions Market are Nutanix, Inc., Dell EMC, Cisco Systems, Inc., Hewlett-Packard Enterprise (HPE), Microsoft Corporation, Huawei Technologies Co., Ltd., NetApp, Inc., IBM Corporation, Scale Computing, StarWind Software, Inc., and others.
In May 2025, Dell Technologies introduced next-gen VxRail HCI appliances featuring Intel Xeon Scalable processors and integrated VMware vSAN ESA, designed to enhance performance and scalability across edge and data center deployments.
In April 2025, Nutanix launched Cloud Native AOS, offering enterprise-grade storage and data services for Kubernetes environments. The update adds support for Dell PowerFlex and Pure Storage FlashArray, enhancing AI integration and flexibility for mission-critical workloads.
Report Attributes | Details |
---|---|
Market Size in 2024 | USD 11.61 Billion |
Market Size by 2032 | USD 34.15 Billion |
CAGR | CAGR of 14.45% From 2025 to 2032 |
Base Year | 2024 |
Forecast Period | 2025-2032 |
Historical Data | 2021-2023 |
Report Scope & Coverage | Market Size, Segments Analysis, Competitive Landscape, Regional Analysis, DROC & SWOT Analysis, Forecast Outlook |
Key Segments | •By Component (Hardware, Software, Services) •By Application (Virtualization, Data Protection, Cloud Computing, Remote Office/Branch Office, Others) •By Enterprise Size (Small and Medium Enterprises, Large Enterprises) •By End-User (BFSI, Healthcare, IT and Telecommunications, Government, Education, Manufacturing, Others) |
Regional Analysis/Coverage | North America (US, Canada, Mexico), Europe (Germany, France, UK, Italy, Spain, Poland, Turkey, Rest of Europe), Asia Pacific (China, India, Japan, South Korea, Singapore, Australia, Rest of Asia Pacific), Middle East & Africa (UAE, Saudi Arabia, Qatar, South Africa, Rest of Middle East & Africa), Latin America (Brazil, Argentina, Rest of Latin America) |
Company Profiles | Nutanix, Inc., Dell EMC, Cisco Systems, Inc., Hewlett-Packard Enterprise (HPE), Microsoft Corporation, Huawei Technologies Co., Ltd., NetApp, Inc., IBM Corporation, Scale Computing, StarWind Software, Inc. |
Answer: North America dominated the Hyper Converged HCI Solutions Market in 2024, accounting for 40.28% of global revenue. This leadership is driven by early virtualization adoption, a mature IT ecosystem, and the presence of leading HCI vendors such as VMware, Cisco, and Dell EMC.
Answer: By Component, the Hardware segment dominated the market with a 62.27% revenue share in 2024, driven by demand for integrated compute-storage-networking appliances, especially for private and hybrid cloud deployments.
Answer: The major growth driver is the rising enterprise shift toward simplified, scalable, software-defined infrastructure, which helps reduce legacy system complexity and operational costs while enabling hybrid cloud and edge computing capabilities.
Answer: The Hyper Converged HCI Solutions Market size was valued at USD 11.61 billion in 2024.
Answer: The market is projected to grow at a CAGR of 14.45% from 2025 to 2032.
1. Introduction
1.1 Market Definition & Scope
1.2 Research Assumptions & Abbreviations
1.3 Research Methodology
2. Executive Summary
2.1 Market Snapshot
2.2 Market Absolute $ Opportunity Assessment & Y-o-Y Analysis, 2021–2032
2.3 Market Size & Forecast, By Segmentation, 2021–2032
2.3.1 Market Size By Component
2.3.2 Market Size By Enterprise Size
2.3.2 Market Size By Application
2.3.2 Market Size By End-User
2.4 Market Share & BPS Analysis By Region, 2024
2.5 Industry Growth Scenarios – Conservative, Likely & Optimistic
2.6 Industry CxO’s Perspective
3. Market Overview
3.1 Market Dynamics
3.1.1 Drivers
3.1.2 Restraints
3.1.3 Opportunities
3.1.4 Key Market Trends
3.2 Industry PESTLE Analysis
3.3 Key Industry Forces (Porter’s) Impacting Market Growth
3.4 Industry Supply Chain Analysis
3.4.1 Raw Material Suppliers
3.4.2 Manufacturers
3.4.3 Distributors/Suppliers
3.4.4 Customers/End-Users
3.5 Industry Life Cycle Assessment
3.6 Parent Market Overview
3.7 Market Risk Assessment
4. Statistical Insights & Trends Reporting
4.1 System Efficiency & Infrastructure Optimization
4.1.1 Average server consolidation ratio achieved through HCI deployment
4.1.2 Data deduplication and compression efficiency ratio across HCI storage layers
4.1.3 Energy consumption reduction (%) in data centers using HCI nodes
4.1.4 Number of simultaneous workloads supported per HCI cluster
4.1.5 Mean system boot and recovery time improvement after HCI integration
4.2 IT Resource & Cost Impact Metrics
4.2.1 Percentage reduction in manual IT intervention post-HCI automation
4.2.2 Average annual savings in operational IT costs with HCI transition
4.2.3 Number of departments or functions migrated to HCI-based infrastructure
4.2.4 Annual maintenance cost differences between HCI and traditional 3-tier architecture
4.2.5 Share of CAPEX to OPEX conversion in companies adopting HCI
4.3 Market Utilization & Integration Trends
4.3.1 Percentage of HCI deployments integrated with public cloud platforms (AWS, Azure, GCP)
4.3.2 Adoption rate of Kubernetes-ready HCI environments in DevOps pipelines
4.3.3 Growth rate of HCI-as-a-service subscriptions among mid-sized enterprises
4.3.4 Number of edge computing applications using compact HCI devices
4.3.5 Average data backup frequency (per day) enabled by HCI setups
4.4 Vendor Landscape & Ecosystem Maturity
4.4.1 Number of third-party integrations per major HCI platform
4.4.2 Year-on-year growth in API-enabled HCI solutions
4.4.3 Volume of support tickets resolved using predictive analytics in HCI systems
4.4.4 Average number of security patches issued annually by top HCI vendors
4.4.5 Time-to-market reduction (weeks) for new applications on HCI environments
5. Hyper Converged HCI Solutions Market Segmental Analysis & Forecast, By Component, 2021 – 2032, Value (USD Billion)
5.1 Introduction
5.2 Hardware
5.2.1 Key Trends
5.2.2 Market Size & Forecast, 2021 – 2032
5.3 Software
5.3.1 Key Trends
5.3.2 Market Size & Forecast, 2021 – 2032
5.4 Services
5.4.1 Key Trends
5.4.2 Market Size & Forecast, 2021 – 2032
6. Hyper Converged HCI Solutions Market Segmental Analysis & Forecast, By Enterprise Size, 2021 – 2032, Value (USD Billion)
6.1 Introduction
6.2 Large enterprises
6.2.1 Key Trends
6.2.2 Market Size & Forecast, 2021 – 2032
6.3 SMEs
6.3.1 Key Trends
6.3.2 Market Size & Forecast, 2021 – 2032
7. Hyper Converged HCI Solutions Market Segmental Analysis & Forecast, By End-User, 2021 – 2032, Value (USD Billion)
7.1 Introduction
7.2 BFSI
7.2.1 Key Trends
7.2.2 Market Size & Forecast, 2021 – 2032
7.3 Healthcare
7.3.1 Key Trends
7.3.2 Market Size & Forecast, 2021 – 2032
7.4 IT and Telecommunications
7.4.1 Key Trends
7.4.2 Market Size & Forecast, 2021 – 2032
7.5 Government
7.5.1 Key Trends
7.5.2 Market Size & Forecast, 2021 – 2032
7.6 Education
7.6.1 Key Trends
7.6.2 Market Size & Forecast, 2021 – 2032
7.7 Manufacturing
7.7.1 Key Trends
7.7.2 Market Size & Forecast, 2021 – 2032
7.8 Others
7.8.1 Key Trends
7.8.2 Market Size & Forecast, 2021 – 2032
8. Hyper Converged HCI Solutions Market Segmental Analysis & Forecast, By Application, 2021 – 2032, Value (USD Billion)
8.1 Introduction
8.2 Virtualization
8.2.1 Key Trends
8.2.2 Market Size & Forecast, 2021 – 2032
8.3 Data Protection
8.3.1 Key Trends
8.3.2 Market Size & Forecast, 2021 – 2032
8.4 Cloud Computing
8.4.1 Key Trends
8.4.2 Market Size & Forecast, 2021 – 2032
8.4 Remote Office/Branch Office
8.5.1 Key Trends
8.5.2 Market Size & Forecast, 2021 – 2032
8.6 Others
8.6.1 Key Trends
8.6.2 Market Size & Forecast, 2021 – 2032
9. Hyper Converged HCI Solutions Market Segmental Analysis & Forecast By Region, 2021 – 2025, Value (USD Billion)
9.1 Introduction
9.2 North America
9.2.1 Key Trends
9.2.2 Hyper Converged HCI Solutions Market Size & Forecast, By Component, 2021 – 2032
9.2.3 Hyper Converged HCI Solutions Market Size & Forecast, By Enterprise Size, 2021 – 2032
9.2.4 Hyper Converged HCI Solutions Market Size & Forecast, By End-User, 2021 – 2032
9.2.5 Hyper Converged HCI Solutions Market Size & Forecast, By Application, 2021 – 2032
9.2.6 Hyper Converged HCI Solutions Market Size & Forecast, By Country, 2021 – 2032
9.2.6.1 USA
9.2.6.1.1 Hyper Converged HCI Solutions Market Size & Forecast, By Component, 2021 – 2032
9.2.6.1.2 Hyper Converged HCI Solutions Market Size & Forecast, By Enterprise Size, 2021 – 2032
9.2.6.1.3 Hyper Converged HCI Solutions Market Size & Forecast, By End-User, 2021 – 2032
9.2.6.1.4 Hyper Converged HCI Solutions Market Size & Forecast, By Application, 2021 – 2032
9.2.6.2 Canada
9.2.6.2.1 Hyper Converged HCI Solutions Market Size & Forecast, By Component, 2021 – 2032
9.2.6.2.2 Hyper Converged HCI Solutions Market Size & Forecast, By Enterprise Size, 2021 – 2032
9.2.6.2.3 Hyper Converged HCI Solutions Market Size & Forecast, By End-User, 2021 – 2032
9.2.6.2.4 Hyper Converged HCI Solutions Market Size & Forecast, By Application, 2021 – 2032
9.3 Europe
9.3.1 Key Trends
9.3.2 Hyper Converged HCI Solutions Market Size & Forecast, By Component, 2021 – 2032
9.3.3 Hyper Converged HCI Solutions Market Size & Forecast, By Enterprise Size, 2021 – 2032
9.3.4 Hyper Converged HCI Solutions Market Size & Forecast, By End-User, 2021 – 2032
9.3.5 Hyper Converged HCI Solutions Market Size & Forecast, By Application, 2021 – 2032
9.3.6 Hyper Converged HCI Solutions Market Size & Forecast, By Country, 2021 – 2032
9.3.6.1 Germany
9.3.6.1.1 Hyper Converged HCI Solutions Market Size & Forecast, By Component, 2021 – 2032
9.3.6.1.2 Hyper Converged HCI Solutions Market Size & Forecast, By Enterprise Size, 2021 – 2032
9.3.6.1.3 Hyper Converged HCI Solutions Market Size & Forecast, By End-User, 2021 – 2032
9.3.6.1.4 Hyper Converged HCI Solutions Market Size & Forecast, By Application, 2021 – 2032
9.3.6.2 UK
9.3.6.2.1 Hyper Converged HCI Solutions Market Size & Forecast, By Component, 2021 – 2032
9.3.6.2.2 Hyper Converged HCI Solutions Market Size & Forecast, By Enterprise Size, 2021 – 2032
9.3.6.2.3 Hyper Converged HCI Solutions Market Size & Forecast, By End-User, 2021 – 2032
9.3.6.2.4 Hyper Converged HCI Solutions Market Size & Forecast, By Application, 2021 – 2032
9.3.6.3 France
9.3.6.3.1 Hyper Converged HCI Solutions Market Size & Forecast, By Component, 2021 – 2032
9.3.6.3.2 Hyper Converged HCI Solutions Market Size & Forecast, By Enterprise Size, 2021 – 2032
9.3.6.3.3 Hyper Converged HCI Solutions Market Size & Forecast, By End-User, 2021 – 2032
9.3.6.3.4 Hyper Converged HCI Solutions Market Size & Forecast, By Application, 2021 – 2032
9.3.6.4 Italy
9.3.6.4.1 Hyper Converged HCI Solutions Market Size & Forecast, By Component, 2021 – 2032
9.3.6.4.2 Hyper Converged HCI Solutions Market Size & Forecast, By Enterprise Size, 2021 – 2032
9.3.6.4.3 Hyper Converged HCI Solutions Market Size & Forecast, By End-User, 2021 – 2032
9.3.6.4.4 Hyper Converged HCI Solutions Market Size & Forecast, By Application, 2021 – 2032
9.3.6.5 Spain
9.3.6.5.1 Hyper Converged HCI Solutions Market Size & Forecast, By Component, 2021 – 2032
9.3.6.5.2 Hyper Converged HCI Solutions Market Size & Forecast, By Enterprise Size, 2021 – 2032
9.3.6.5.3 Hyper Converged HCI Solutions Market Size & Forecast, By End-User, 2021 – 2032
9.3.6.5.4 Hyper Converged HCI Solutions Market Size & Forecast, By Application, 2021 – 2032
9.3.6.6 Russia
9.3.6.6.1 Hyper Converged HCI Solutions Market Size & Forecast, By Component, 2021 – 2032
9.3.6.6.2 Hyper Converged HCI Solutions Market Size & Forecast, By Enterprise Size, 2021 – 2032
9.3.6.6.3 Hyper Converged HCI Solutions Market Size & Forecast, By End-User, 2021 – 2032
9.3.6.6.4 Hyper Converged HCI Solutions Market Size & Forecast, By Application, 2021 – 2032
9.3.6.7 Poland
9.3.6.7.1 Hyper Converged HCI Solutions Market Size & Forecast, By Component, 2021 – 2032
9.3.6.7.2 Hyper Converged HCI Solutions Market Size & Forecast, By Enterprise Size, 2021 – 2032
9.3.6.7.3 Hyper Converged HCI Solutions Market Size & Forecast, By End-User, 2021 – 2032
9.3.6.7.4 Hyper Converged HCI Solutions Market Size & Forecast, By Application, 2021 – 2032
9.3.6.8 Rest of Europe
9.3.6.8.1 Hyper Converged HCI Solutions Market Size & Forecast, By Component, 2021 – 2032
9.3.6.8.2 Hyper Converged HCI Solutions Market Size & Forecast, By Enterprise Size, 2021 – 2032
9.3.6.8.3 Hyper Converged HCI Solutions Market Size & Forecast, By End-User, 2021 – 2032
9.3.6.8.4 Hyper Converged HCI Solutions Market Size & Forecast, By Application, 2021 – 2032
9.4 Asia-Pacific
9.4.1 Key Trends
9.4.2 Hyper Converged HCI Solutions Market Size & Forecast, By Component, 2021 – 2032
9.4.3 Hyper Converged HCI Solutions Market Size & Forecast, By Enterprise Size, 2021 – 2032
9.4.4 Hyper Converged HCI Solutions Market Size & Forecast, By End-User, 2021 – 2032
9.4.5 Hyper Converged HCI Solutions Market Size & Forecast, By Application, 2021 – 2032
9.4.6 Hyper Converged HCI Solutions Market Size & Forecast, By Country, 2021 – 2032
9.4.6.1 China
9.4.6.1.1 Hyper Converged HCI Solutions Market Size & Forecast, By Component, 2021 – 2032
9.4.6.1.2 Hyper Converged HCI Solutions Market Size & Forecast, By Enterprise Size, 2021 – 2032
9.4.6.1.3 Hyper Converged HCI Solutions Market Size & Forecast, By End-User, 2021 – 2032
9.4.6.1.4 Hyper Converged HCI Solutions Market Size & Forecast, By Application, 2021 – 2032
9.4.6.2 India
9.4.6.2.1 Hyper Converged HCI Solutions Market Size & Forecast, By Component, 2021 – 2032
9.4.6.2.2 Hyper Converged HCI Solutions Market Size & Forecast, By Enterprise Size, 2021 – 2032
9.4.6.2.3 Hyper Converged HCI Solutions Market Size & Forecast, By End-User, 2021 – 2032
9.4.6.2.4 Hyper Converged HCI Solutions Market Size & Forecast, By Application, 2021 – 2032
9.4.6.3 Japan
9.4.6.3.1 Hyper Converged HCI Solutions Market Size & Forecast, By Component, 2021 – 2032
9.4.6.3.2 Hyper Converged HCI Solutions Market Size & Forecast, By Enterprise Size, 2021 – 2032
9.4.6.3.3 Hyper Converged HCI Solutions Market Size & Forecast, By End-User, 2021 – 2032
9.4.6.3.4 Hyper Converged HCI Solutions Market Size & Forecast, By Application, 2021 – 2032
9.4.6.4 South Korea
9.4.6.4.1 Hyper Converged HCI Solutions Market Size & Forecast, By Component, 2021 – 2032
9.4.6.4.2 Hyper Converged HCI Solutions Market Size & Forecast, By Enterprise Size, 2021 – 2032
9.4.6.4.3 Hyper Converged HCI Solutions Market Size & Forecast, By End-User, 2021 – 2032
9.4.6.4.4 Hyper Converged HCI Solutions Market Size & Forecast, By Application, 2021 – 2032
9.4.6.5 Australia
9.4.6.5.1 Hyper Converged HCI Solutions Market Size & Forecast, By Component, 2021 – 2032
9.4.6.5.2 Hyper Converged HCI Solutions Market Size & Forecast, By Enterprise Size, 2021 – 2032
9.4.6.5.3 Hyper Converged HCI Solutions Market Size & Forecast, By End-User, 2021 – 2032
9.4.6.5.4 Hyper Converged HCI Solutions Market Size & Forecast, By Application, 2021 – 2032
9.4.6.6 ASEAN Countries
9.4.6.6.1 Hyper Converged HCI Solutions Market Size & Forecast, By Component, 2021 – 2032
9.4.6.6.2 Hyper Converged HCI Solutions Market Size & Forecast, By Enterprise Size, 2021 – 2032
9.4.6.6.3 Hyper Converged HCI Solutions Market Size & Forecast, By End-User, 2021 – 2032
9.4.6.6.4 Hyper Converged HCI Solutions Market Size & Forecast, By Application, 2021 – 2032
9.4.6.7 Rest of Asia-Pacific
9.4.6.7.1 Hyper Converged HCI Solutions Market Size & Forecast, By Component, 2021 – 2032
9.4.6.7.2 Hyper Converged HCI Solutions Market Size & Forecast, By Enterprise Size, 2021 – 2032
9.4.6.7.3 Hyper Converged HCI Solutions Market Size & Forecast, By End-User, 2021 – 2032
9.4.6.7.4 Hyper Converged HCI Solutions Market Size & Forecast, By Application, 2021 – 2032
9.5 Latin America
9.5.1 Key Trends
9.5.2 Hyper Converged HCI Solutions Market Size & Forecast, By Component, 2021 – 2032
9.5.3 Hyper Converged HCI Solutions Market Size & Forecast, By Enterprise Size, 2021 – 2032
9.5.4 Hyper Converged HCI Solutions Market Size & Forecast, By End-User, 2021 – 2032
9.5.5 Hyper Converged HCI Solutions Market Size & Forecast, By Application, 2021 – 2032
9.5.6 Hyper Converged HCI Solutions Market Size & Forecast, By Country, 2021 – 2032
9.5.6.1 Brazil
9.5.6.1.1 Hyper Converged HCI Solutions Market Size & Forecast, By Component, 2021 – 2032
9.5.6.1.2 Hyper Converged HCI Solutions Market Size & Forecast, By Enterprise Size, 2021 – 2032
9.5.6.1.3 Hyper Converged HCI Solutions Market Size & Forecast, By End-User, 2021 – 2032
9.5.6.1.4 Hyper Converged HCI Solutions Market Size & Forecast, By Application, 2021 – 2032
9.5.6.2 Argentina
9.5.6.2.1 Hyper Converged HCI Solutions Market Size & Forecast, By Component, 2021 – 2032
9.5.6.2.2 Hyper Converged HCI Solutions Market Size & Forecast, By Enterprise Size, 2021 – 2032
9.5.6.2.3 Hyper Converged HCI Solutions Market Size & Forecast, By End-User, 2021 – 2032
9.5.6.2.4 Hyper Converged HCI Solutions Market Size & Forecast, By Application, 2021 – 2032
9.5.6.3 Mexico
9.5.6.3.1 Hyper Converged HCI Solutions Market Size & Forecast, By Component, 2021 – 2032
9.5.6.3.2 Hyper Converged HCI Solutions Market Size & Forecast, By Enterprise Size, 2021 – 2032
9.5.6.3.3 Hyper Converged HCI Solutions Market Size & Forecast, By End-User, 2021 – 2032
9.5.6.3.4 Hyper Converged HCI Solutions Market Size & Forecast, By Application, 2021 – 2032
9.5.6.4 Colombia
9.5.6.4.1 Hyper Converged HCI Solutions Market Size & Forecast, By Component, 2021 – 2032
9.5.6.4.2 Hyper Converged HCI Solutions Market Size & Forecast, By Enterprise Size, 2021 – 2032
9.5.6.4.3 Hyper Converged HCI Solutions Market Size & Forecast, By End-User, 2021 – 2032
9.5.6.4.4 Hyper Converged HCI Solutions Market Size & Forecast, By Application, 2021 – 2032
9.5.6.5 Rest of Latin America
9.5.6.5.1 Hyper Converged HCI Solutions Market Size & Forecast, By Component, 2021 – 2032
9.5.6.5.2 Hyper Converged HCI Solutions Market Size & Forecast, By Enterprise Size, 2021 – 2032
9.5.6.5.3 Hyper Converged HCI Solutions Market Size & Forecast, By End-User, 2021 – 2032
9.5.6.5.4 Hyper Converged HCI Solutions Market Size & Forecast, By Application, 2021 – 2032
9.6 Middle East & Africa
9.6.1 Key Trends
9.6.2 Hyper Converged HCI Solutions Market Size & Forecast, By Component, 2021 – 2032
9.6.3 Hyper Converged HCI Solutions Market Size & Forecast, By Enterprise Size, 2021 – 2032
9.6.4 Hyper Converged HCI Solutions Market Size & Forecast, By End-User, 2021 – 2032
9.6.5 Hyper Converged HCI Solutions Market Size & Forecast, By Application, 2021 – 2032
9.6.6 Hyper Converged HCI Solutions Market Size & Forecast, By Country, 2021 – 2032
9.6.6.1 UAE
9.6.6.1.1 Hyper Converged HCI Solutions Market Size & Forecast, By Component, 2021 – 2032
9.6.6.1.2 Hyper Converged HCI Solutions Market Size & Forecast, By Enterprise Size, 2021 – 2032
9.6.6.1.3 Hyper Converged HCI Solutions Market Size & Forecast, By End-User, 2021 – 2032
9.6.6.1.4 Hyper Converged HCI Solutions Market Size & Forecast, By Application, 2021 – 2032
9.6.6.2 Saudi Arabia
9.6.6.2.1 Hyper Converged HCI Solutions Market Size & Forecast, By Component, 2021 – 2032
9.6.6.2.2 Hyper Converged HCI Solutions Market Size & Forecast, By Enterprise Size, 2021 – 2032
9.6.6.2.3 Hyper Converged HCI Solutions Market Size & Forecast, By End-User, 2021 – 2032
9.6.6.2.4 Hyper Converged HCI Solutions Market Size & Forecast, By Application, 2021 – 2032
9.6.6.3 Qatar
9.6.6.3.1 Hyper Converged HCI Solutions Market Size & Forecast, By Component, 2021 – 2032
9.6.6.3.2 Hyper Converged HCI Solutions Market Size & Forecast, By Enterprise Size, 2021 – 2032
9.6.6.3.3 Hyper Converged HCI Solutions Market Size & Forecast, By End-User, 2021 – 2032
9.6.6.3.4 Hyper Converged HCI Solutions Market Size & Forecast, By Application, 2021 – 2032
9.6.6.4 Egypt
9.6.6.4.1 Hyper Converged HCI Solutions Market Size & Forecast, By Component, 2021 – 2032
9.6.6.4.2 Hyper Converged HCI Solutions Market Size & Forecast, By Enterprise Size, 2021 – 2032
9.6.6.4.3 Hyper Converged HCI Solutions Market Size & Forecast, By End-User, 2021 – 2032
9.6.6.4.4 Hyper Converged HCI Solutions Market Size & Forecast, By Application, 2021 – 2032
9.6.6.5 South Africa
9.6.6.5.1 Hyper Converged HCI Solutions Market Size & Forecast, By Component, 2021 – 2032
9.6.6.5.2 Hyper Converged HCI Solutions Market Size & Forecast, By Enterprise Size, 2021 – 2032
9.6.6.5.3 Hyper Converged HCI Solutions Market Size & Forecast, By End-User, 2021 – 2032
9.6.6.5.4 Hyper Converged HCI Solutions Market Size & Forecast, By Application, 2021 – 2032
9.6.6.6 Rest of Middle East & Africa
9.6.6.6.1 Hyper Converged HCI Solutions Market Size & Forecast, By Component, 2021 – 2032
9.6.6.6.2 Hyper Converged HCI Solutions Market Size & Forecast, By Enterprise Size, 2021 – 2032
9.6.6.6.3 Hyper Converged HCI Solutions Market Size & Forecast, By End-User, 2021 – 2032
9.6.6.6.4 Hyper Converged HCI Solutions Market Size & Forecast, By Application, 2021 – 2032
10. Competitive Landscape
10.1 Key Players' Positioning
10.2 Competitive Developments
10.2.1 Key Strategies Adopted (%), By Key Players, 2024
10.2.2 Year-Wise Strategies & Development, 2021 – 2025
10.2.3 Number Of Strategies Adopted By Key Players, 2024
10.3 Market Share Analysis, 2024
10.4 Product/Service & Application Benchmarking
10.4.1 Product/Service Specifications & Features By Key Players
10.4.2 Product/Service Heatmap By Key Players
10.4.3 Application Heatmap By Key Players
10.5 Industry Start-Up & Innovation Landscape
10.6 Key Company Profiles
10.6.1 Nutanix, Inc.
10.6.1.1 Company Overview & Snapshot
10.6.1.2 Product/Service Portfolio
10.6.1.3 Key Company Financials
10.6.1.4 SWOT Analysis
10.6.2 Dell EMC
10.6.2.1 Company Overview & Snapshot
10.6.2.2 Product/Service Portfolio
10.6.2.3 Key Company Financials
10.6.2.4 SWOT Analysis
10.6.3 Cisco Systems, Inc.
10.6.3.1 Company Overview & Snapshot
10.6.3.2 Product/Service Portfolio
10.6.3.3 Key Company Financials
10.6.3.4 SWOT Analysis
10.6.4 Hewlett-Packard Enterprise (HPE)
10.6.4.1 Company Overview & Snapshot
10.6.4.2 Product/Service Portfolio
10.6.4.3 Key Company Financials
10.6.4.4 SWOT Analysis
10.6.5 Microsoft Corporation
10.6.5.1 Company Overview & Snapshot
10.6.5.2 Product/Service Portfolio
10.6.5.3 Key Company Financials
10.6.5.4 SWOT Analysis
10.6.6 Huawei Technologies Co., Ltd.
10.6.6.1 Company Overview & Snapshot
10.6.6.2 Product/Service Portfolio
10.6.6.3 Key Company Financials
10.6.6.4 SWOT Analysis
10.6.7 NetApp, Inc.
10.6.7.1 Company Overview & Snapshot
10.6.7.2 Product/Service Portfolio
10.6.7.3 Key Company Financials
10.6.7.4 SWOT Analysis
10.6.8 IBM Corporation
10.6.8.1 Company Overview & Snapshot
10.6.8.2 Product/Service Portfolio
10.6.8.3 Key Company Financials
10.6.8.4 SWOT Analysis
10.6.9 Scale Computing
10.6.9.1 Company Overview & Snapshot
10.6.9.2 Product/Service Portfolio
10.6.9.3 Key Company Financials
10.6.9.4 SWOT Analysis
10.6.10 StarWind Software, Inc.
10.6.10.1 Company Overview & Snapshot
10.6.10.2 Product/Service Portfolio
10.6.10.3 Key Company Financials
10.6.10.4 SWOT Analysis
10.6.11 VMware, Inc.
10.6.11.1 Company Overview & Snapshot
10.6.11.2 Product/Service Portfolio
10.6.11.3 Key Company Financials
10.6.11.4 SWOT Analysis
10.6.12 Lenovo Group Ltd.
10.6.12.1 Company Overview & Snapshot
10.6.12.2 Product/Service Portfolio
10.6.12.3 Key Company Financials
10.6.12.4 SWOT Analysis
10.6.13 Fujitsu Limited
10.6.13.1 Company Overview & Snapshot
10.6.13.2 Product/Service Portfolio
10.6.13.3 Key Company Financials
10.6.13.4 SWOT Analysis
10.6.14 Red Hat, Inc.
10.6.14.1 Company Overview & Snapshot
10.6.14.2 Product/Service Portfolio
10.6.14.3 Key Company Financials
10.6.14.4 SWOT Analysis
10.6.15 Hitachi Vantara
10.6.15.1 Company Overview & Snapshot
10.6.15.2 Product/Service Portfolio
10.6.15.3 Key Company Financials
10.6.15.4 SWOT Analysis
10.6.16 NEC Corporation
10.6.16.1 Company Overview & Snapshot
10.6.16.2 Product/Service Portfolio
10.6.16.3 Key Company Financials
10.6.16.4 SWOT Analysis
10.6.17 Pivot3
10.6.17.1 Company Overview & Snapshot
10.6.17.2 Product/Service Portfolio
10.6.17.3 Key Company Financials
10.6.17.4 SWOT Analysis
10.6.18 Maxta, Inc.
10.6.18.1 Company Overview & Snapshot
10.6.18.2 Product/Service Portfolio
10.6.18.3 Key Company Financials
10.6.18.4 SWOT Analysis
10.6.19 DataCore Software Corporation
10.6.19.1 Company Overview & Snapshot
10.6.19.2 Product/Service Portfolio
10.6.19.3 Key Company Financials
10.6.19.4 SWOT Analysis
10.6.20 Sangfor Technologies
10.6.20.1 Company Overview & Snapshot
10.6.20.2 Product/Service Portfolio
10.6.20.3 Key Company Financials
10.6.20.4 SWOT Analysis
11. Analyst Recommendations
11.1 SNS Insider Opportunity Map
11.2 Industry Low-Hanging Fruit Assessment
11.3 Market Entry & Growth Strategy
11.4 Analyst Viewpoint & Suggestions On Market Growth
12. Assumptions
13. Disclaimer
14. Appendix
14.1 List Of Tables
14.2 List Of Figures
An accurate research report requires proper strategizing as well as implementation. There are multiple factors involved in the completion of good and accurate research report and selecting the best methodology to compete the research is the toughest part. Since the research reports we provide play a crucial role in any company’s decision-making process, therefore we at SNS Insider always believe that we should choose the best method which gives us results closer to reality. This allows us to reach at a stage wherein we can provide our clients best and accurate investment to output ratio.
Each report that we prepare takes a timeframe of 350-400 business hours for production. Starting from the selection of titles through a couple of in-depth brain storming session to the final QC process before uploading our titles on our website we dedicate around 350 working hours. The titles are selected based on their current market cap and the foreseen CAGR and growth.
The 5 steps process:
Step 1: Secondary Research:
Secondary Research or Desk Research is as the name suggests is a research process wherein, we collect data through the readily available information. In this process we use various paid and unpaid databases which our team has access to and gather data through the same. This includes examining of listed companies’ annual reports, Journals, SEC filling etc. Apart from this our team has access to various associations across the globe across different industries. Lastly, we have exchange relationships with various university as well as individual libraries.
Step 2: Primary Research
When we talk about primary research, it is a type of study in which the researchers collect relevant data samples directly, rather than relying on previously collected data. This type of research is focused on gaining content specific facts that can be sued to solve specific problems. Since the collected data is fresh and first hand therefore it makes the study more accurate and genuine.
We at SNS Insider have divided Primary Research into 2 parts.
Part 1 wherein we interview the KOLs of major players as well as the upcoming ones across various geographic regions. This allows us to have their view over the market scenario and acts as an important tool to come closer to the accurate market numbers. As many as 45 paid and unpaid primary interviews are taken from both the demand and supply side of the industry to make sure we land at an accurate judgement and analysis of the market.
This step involves the triangulation of data wherein our team analyses the interview transcripts, online survey responses and observation of on filed participants. The below mentioned chart should give a better understanding of the part 1 of the primary interview.
Part 2: In this part of primary research the data collected via secondary research and the part 1 of the primary research is validated with the interviews from individual consultants and subject matter experts.
Consultants are those set of people who have at least 12 years of experience and expertise within the industry whereas Subject Matter Experts are those with at least 15 years of experience behind their back within the same space. The data with the help of two main processes i.e., FGDs (Focused Group Discussions) and IDs (Individual Discussions). This gives us a 3rd party nonbiased primary view of the market scenario making it a more dependable one while collation of the data pointers.
Step 3: Data Bank Validation
Once all the information is collected via primary and secondary sources, we run that information for data validation. At our intelligence centre our research heads track a lot of information related to the market which includes the quarterly reports, the daily stock prices, and other relevant information. Our data bank server gets updated every fortnight and that is how the information which we collected using our primary and secondary information is revalidated in real time.
Step 4: QA/QC Process
After all the data collection and validation our team does a final level of quality check and quality assurance to get rid of any unwanted or undesired mistakes. This might include but not limited to getting rid of the any typos, duplication of numbers or missing of any important information. The people involved in this process include technical content writers, research heads and graphics people. Once this process is completed the title gets uploader on our platform for our clients to read it.
Step 5: Final QC/QA Process:
This is the last process and comes when the client has ordered the study. In this process a final QA/QC is done before the study is emailed to the client. Since we believe in giving our clients a good experience of our research studies, therefore, to make sure that we do not lack at our end in any way humanly possible we do a final round of quality check and then dispatch the study to the client.
By Component
Hardware
Software
Services
By Application
Virtualization
Data Protection
Cloud Computing
Remote Office/Branch Office
Others
By Enterprise Size
Small and Medium Enterprises
Large Enterprises
By End-User
BFSI
Healthcare
IT and Telecommunications
Government
Education
Manufacturing
Others
Request for Segment Customization as per your Business Requirement: Segment Customization Request
Regional Coverage:
North America
US
Canada
Mexico
Europe
Germany
France
UK
Italy
Spain
Poland
Turkey
Rest of Europe
Asia Pacific
China
India
Japan
South Korea
Singapore
Australia
Rest of Asia Pacific
Middle East & Africa
UAE
Saudi Arabia
Qatar
South Africa
Rest of Middle East & Africa
Latin America
Brazil
Argentina
Rest of Latin America
Request for Country Level Research Report: Country Level Customization Request
Available Customization
With the given market data, SNS Insider offers customization as per the company’s specific needs. The following customization options are available for the report:
Detailed Volume Analysis
Criss-Cross segment analysis (e.g. Product X Application)
Competitive Product Benchmarking
Geographic Analysis
Additional countries in any of the regions
Customized Data Representation
Detailed analysis and profiling of additional market players