Inductive Loop Vehicle Detector Market Size Analysis:
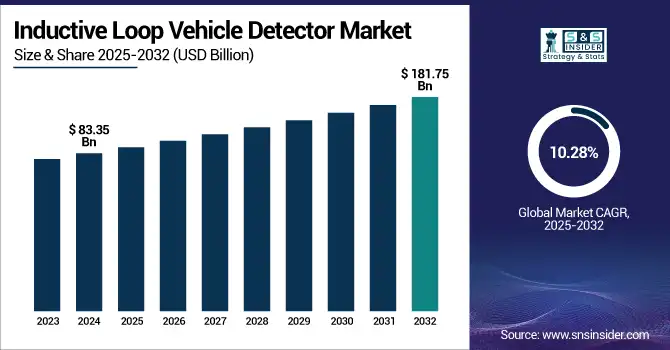
The Inductive Loop Vehicle Detector Market size was valued at USD 83.35 million in 2024 and is expected to reach USD 181.75 million by 2032, growing at a CAGR of 10.28% over the forecast period of 2025-2032.
The significant reasons for the growth of the market include the trend of urbanization, increased traffic congestion, high mobility and security demand, expansion in the smart parking infrastructure, and the government initiatives for intelligent traffic management, which are in turn propelling the need for the inductive loop vehicle detector market and at a large scale.
Inductive Loop Vehicle Detector Market Size and Forecast:
-
Market Size in 2024: USD 83.35 million
-
Market Size by 2032: USD 181.75 million
-
CAGR: 10.28% from 2025 to 2032
-
Base Year: 2024
-
Forecast Period: 2025–2032
-
Historical Data: 2020–2022
To Get more information on Inductive Loop Vehicle Detector Market - Request Free Sample Report
The inductive loop vehicle detector market growth is driven by the rise of toll collection systems becoming automated, increasing infrastructure modernization projects, and increasing preferences for real-time detection of vehicles in commercial facilities. The development of new loop detectors connected by wireless connectivity and using AI-powered tools to identify static and mobile traffic patterns further propels adoption. The market is also growing owing to the increasing requirement for improved perimeter security in the military and industrial sectors, along with the rising smart city projects.
-
Recent innovations in automated toll collection use YOLOv11 and ensemble OCR, achieving 98.5% license plate accuracy and 94.2% axle detection. The system's 0.895 mAP highlights its efficiency and cost-effectiveness in toll operations.
The U.S. inductive loop vehicle detector market size is estimated to be valued at USD 22.46 million in 2024 and is projected to grow at a CAGR of 10.39%, reaching USD 49.35 million by 2032. The U.S. inductive loop vehicle detector market is expanding, owing to the increasing investment in smart transportation, restoration of highway infrastructure, burgeoning automated toll systems, along with the growing need for real-time traffic data for congestion management and urban mobility planning.
Inductive Loop Vehicle Detector Market Trends:
-
Increasing adoption of intelligent transportation systems (ITS) is driving demand for inductive loop vehicle detectors for efficient traffic monitoring and management across urban infrastructure.
-
Growing need for real-time traffic data collection and congestion control is accelerating the deployment of loop detectors at intersections, highways, and toll plazas.
-
Advancements in sensor technology and integration with smart traffic signals are enhancing detection accuracy, reliability, and system responsiveness.
-
Rising investments in smart city projects and urban mobility solutions are expanding the use of vehicle detection systems, particularly in developing economies.
-
Integration with AI-based traffic analytics and automated traffic control systems is improving predictive traffic flow management and reducing delays.
-
Increasing focus on road safety and accident prevention is boosting the adoption of vehicle detection systems for better signal timing and incident detection.
-
Expansion of infrastructure projects, including highways and urban road networks, is creating opportunities for large-scale deployment of inductive loop vehicle detection systems.
Inductive Loop Vehicle Detector Market Dynamics:
Key Drivers:
-
Urbanization and Smart City Investments Drive the Growth and Innovation of Inductive Loop Vehicle Detectors
The growing urbanization and rise in vehicular congestion are some of the key market drivers influencing the growth of the global inductive loop vehicle detector market and propelling the growth of adoption of intelligent transportation systems (ITS). The modernization of roadway and parking systems and the expansion of automated toll collection infrastructure are all main factors bolstering growth. The requirement for real-time vehicle detection technologies is further augmented as governments from all over the world aggressively spend on smart city projects. In addition, AI traffic analysis and wireless loop detectors enable predictive analytics and traffic control including never before. inductive loop vehicle detector market trends indicate a shift toward more integrated, data-driven solutions that enhance traffic management and improve safety across urban areas.
-
Istanbul has emerged as the most congested city globally, with drivers losing an average of 105 hours annually to traffic delays, a 15% increase from 2023. New York City and Chicago follow closely, each with 102 hours lost per driver. This escalating congestion underscores the urgent need for advanced traffic management solutions, such as ILVDs to optimize traffic flow and reduce delays.
Restraints:
-
Challenges in Installation Accuracy and Maintenance Hinder Growth of Inductive Loop Vehicle Detectors
The biggest restraint is that the installations are complicated to do, and retrofitting existing roadways can be challenging and disruptive. Furthermore, technical constraints on detecting precision, especially in bad weather and or dense traffic, limit reliability. Inductive loops are also prone to maintenance issues since the performance of the loops can be affected by wear and tear, environmental conditions, or the proximity of other electronic devices.
Opportunities:
-
Inductive Loop Vehicle Detectors Unlock Opportunities Through IoT Integration and Security Demands
The inductive loop vehicle detector market has especially promising opportunities for scalable and data-driven solutions through integration with IoT platforms and cloud-based traffic management systems. The picture is similar in many other emerging economies across the Asia-Pacific, Latin America, and the Middle East regions, driven by a combination of growing urban population and a failure to meet the infrastructure development parameters of the past. Moreover, growing emphasis on perimeter security across industrial, military, and critical facilities is expected to fuel the demand for efficient vehicle detection technologies even more.
-
Cities are increasingly adopting AI-driven traffic management systems. For instance, Paris is testing AI-led video surveillance during the 2024 Olympics to monitor crowd density and detect abandoned objects, utilizing around 200 cameras equipped with AI software to enhance public safety.
Challenges:
-
Standardization Issues and Cybersecurity Risks Pose Challenges to Inductive Loop Vehicle Detectors
The main barrier is standardisation and the absence of consistent standards among regions and manufacturers makes it difficult to scale up and scale out. While growth also has a strong basis in emerging markets, in some regions, the adoption rates of ILVD technology remain low, and awareness is lacking. Finally, the risk of cybersecurity problems related to IoT-connected devices and vehicle detection systems being hacked and data compromised represents a serious risk to the stability and trust of the market.
Inductive Loop Vehicle Detector Market Segmentation Analysis:
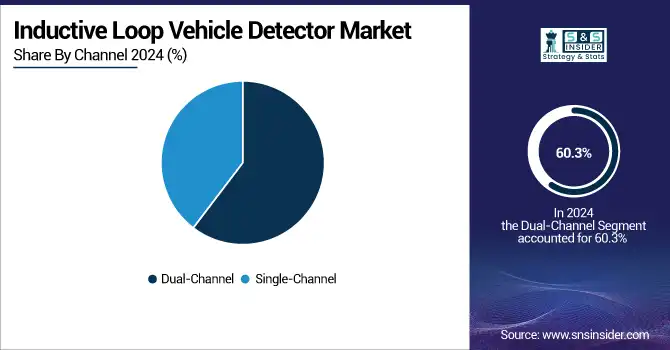
By Channel
The dual-channel inductive loop vehicle detector system is the leading product type in 2024, capturing 60.3% of the market share. In high-traffic places, the dual-channel systems are mostly used, as they give better detection by monitoring two separate lanes of traffic simultaneously. It makes the management of traffic flow more efficient, alleviating congestion and assisting vehicle classification in busy urban areas or toll stations, which is why it has become the preferred solution for many municipalities.
The single-channel ILVD system is projected to witness the fastest CAGR growth from 2025 to 2032. These have a cost advantage for low-traffic situations, managing parking, and smaller applications bus speeds in single-channel systems. Advances in technology, making gas leak detectors more accurate and reliable and easier to install and maintain, have driven their adoption. With the proliferation of smart city projects worldwide, the demand for cost-effective, scalable solutions is expected to grow dramatically, accelerating growth even faster.
By Installation Type
In 2024, the inductive loop vehicle detector market was led by preformed loop systems with a share of 56.0%. Such systems are extremely popular and allow for quick installation and little disruption to the home during setup. Preformed loops are especially useful in high-speed installations, such as in retrofitting roads and existing infrastructure. Additionally, they are preferred in high-traffic areas, such as toll booths, highways, and urban traffic management systems, given their lengthy lifespan and reduced maintenance needs.
The segment of saw cut loop system is anticipated to witness higher CAGR growth over 2025-2032. More traditionally, saw cut loops, which can be installed with minimal roadwork and downtime when the road doesn’t have constant routine maintenance or constructions in progress, are getting a lot of coal-like popularity. This trend is projected to contribute to the growth of saw cut loop systems, as demand for low-cost, mobile, and lower maintenance systems will grow in many of the areas where this technology is being deployed, especially in new urban areas and in developing countries.
By Application
The market was dominated by traffic management applications, which accounted for 41.1% revenue share in 2024. In conjunction with traffic light control, ILVD systems are vital in ensuring traffic flow efficiency and congestion reduction, and improvements in vehicle classification in hotspots such as at intersections & toll booths, on highways, etc. The capability of offering live information about the number of vehicles, their speed, and their type has made ILVDs an integral part of the urban and highway traffic management system. Demand for efficient traffic management tools, such as ILVDs, will remain as cities around the world continue to embrace smart transportation solutions.
During 2025-2032, the drive-thru restaurant segment is expected to register the fastest CAGR growth. Drive-thru restorations, which are the cost-effective alternatives to the rising quick service chains and demand for better, quicker service, are also gradually integrating ILVDs to monitor lines & streamline the workflow while elevating customer demand. The combination of convenience and automation is making this foodservice industry trend even more popular and will be a major acceleration in growth within this industry.
Inductive Loop Vehicle Detector Market Regional Analysis:
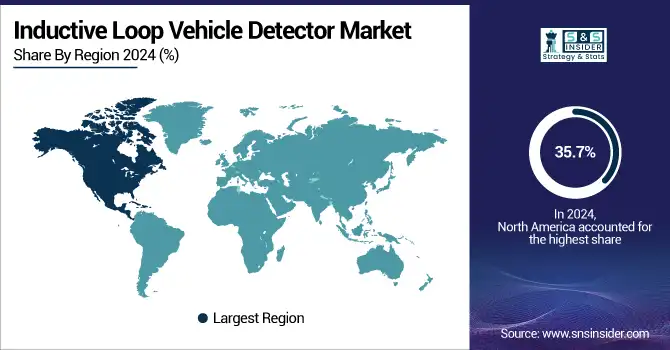
The inductive loop vehicle detector market share in 2024 was dominated by North America, which accounted for 35.7% of the total market due to strong investments in intelligent transportation systems and road infrastructure modernization. This is driven by high attention of the region on mitigating traffic congestion, especially in cities such as New York, and Los Angeles, among others. The market is also benefiting from the extensive deployment of automated toll collection systems, the rising implementation of smart parking solutions, and the increasing growth of connected and autonomous vehicle infrastructure. Also, the key technology providers based in this region, favorable government regulations, and increasing investments by private and public organizations on smart city projects in the U.S. and Canada are promoting the demand for traffic monitoring solution that tracks real-time traffic and vehicle classification.
The North America ILVD market is dominated by the U.S. on account of the country having a well-established transportation infrastructure, along with numerous smart city projects, high adoption of intelligent traffic management systems in the country, which is heavily funded by government institutions, and proliferation of major technology providers and integrators.
The Inductive loop vehicle detector market in Asia Pacific is anticipated to grow with the highest CAGR of 11.4% throughout the forecast period, owing to fast urbanization, rising traffic congestion, and rising smart city investments in countries such as China, India, Japan, and South Korea. From improved road safety, better traffic flow, and lower emissions, governments in the region are investing heavily in intelligent transportation infrastructure. The deployment of ILVD is due to the increasing use of automated toll collection systems, smart parking, and IoT-based traffic control platforms.
The Asia Pacific market is led by China, supported by its large investments in smart city development, deployment of intelligent transportation systems, and rapid urban infrastructure expansion driven by advanced traffic monitoring, automated tolling, and AI-powered vehicle detection technologies in large cities across the nation.
Europe is one of the leading regions in the ILVD market due to stringent road safety regulations, environmental sustainability policies, and increasing adoption of smart mobility. Countries, such as Germany, the U.K., and France have begun to deploy a growing number of intelligent transportation systems, which comprise ILVDs that assist in managing rising traffic congestion and reduced emissions. Smart city development is one of the areas that the EU has emphasized, which is contributing to the demand for real-time traffic monitoring technologies in the region, making Europe a strong market for growth.
Germany leads the ILVD market in Europe owing to its advanced automotive infrastructure, strong emphasis on smart mobility, extensive network of highways, and the government's favoring of intelligent transportation and traffic management technologies.
Inductive Loop Vehicle Detector market growth frontiers in Latin America and the Middle East & Africa (MEA) will be propelled by rapid urbanization, resultant demand from traffic congestion, and an increasing impetus on transport infrastructure modernization. There is also increasing focus on road safety, traffic management, and perimeter protection of important facilities in both regions. The trend towards intelligent mobility and the increasing number of automated tolling systems are also driving the implementation of ILVD in the developing traffic ecosystems.
Get Customized Report as per Your Business Requirement - Enquiry Now
Inductive Loop Vehicle Detector Companies:
Some of the major inductive loop vehicle detectors companies are Eberle Design Inc., SmartSensor Technologies, Sensys Networks Inc., Traffic Technology Ltd., Siemens Mobility, FLIR Systems, IAV GmbH, Swarco AG, ZKTeco Co., Ltd., and Iteris, Inc.
Recent Developments:
-
In April 2024, Sensys Networks unveiled the FlexMag3 EZ-Out, a next-generation traffic detection sensor designed for quick installation, easy removal, and enhanced durability. This innovative sensor improves flexibility in deployment and offers cost-effective solutions for modern traffic monitoring systems.
-
In September 2024, FLIR launched the TrafiBot Dual AI camera, designed to enhance interurban traffic flow and early fire detection using advanced thermal and visual AI. The system provides real-time alerts and reduces false alarms, improving safety and traffic management.
| Report Attributes | Details |
|---|---|
| Market Size in 2024 | USD 83.35 Million |
| Market Size by 2032 | USD 181.75 Million |
| CAGR | CAGR of 10.28% From 2025 to 2032 |
| Base Year | 2024 |
| Forecast Period | 2025-2032 |
| Historical Data | 2020-2022 |
| Report Scope & Coverage | Market Size, Segments Analysis, Competitive Landscape, Regional Analysis, DROC & SWOT Analysis, Forecast Outlook |
| Key Segments | • By Channel (Dual Channel and Single Channel) • By Installation Type (Preformed Loop and Saw Cut Loop) • By Application (Traffic Management, Parking Management, Security Gates, Drive-Thru Restaurants, Security Bollards, and Others) |
| Regional Analysis/Coverage | North America (US, Canada, Mexico), Europe (Eastern Europe [Poland, Romania, Hungary, Turkey, Rest of Eastern Europe] Western Europe] Germany, France, UK, Italy, Spain, Netherlands, Switzerland, Austria, Rest of Western Europe]), Asia Pacific (China, India, Japan, South Korea, Vietnam, Singapore, Australia, Taiwan, Rest of Asia Pacific), Middle East & Africa (Middle East [UAE, Egypt, Saudi Arabia, Qatar, Rest of Middle East], Africa [Nigeria, South Africa, Rest of Africa], Latin America (Brazil, Argentina, Colombia, Rest of Latin America) |
| Company Profiles | Eberle Design Inc., SmartSensor Technologies, Sensys Networks Inc., Traffic Technology Ltd., Siemens Mobility, FLIR Systems, IAV GmbH, Swarco AG, ZKTeco Co., Ltd., and Iteris, Inc. |
Get in Touch
