Ultraviolet (UV) Sensor Market Report Scope and Overview:
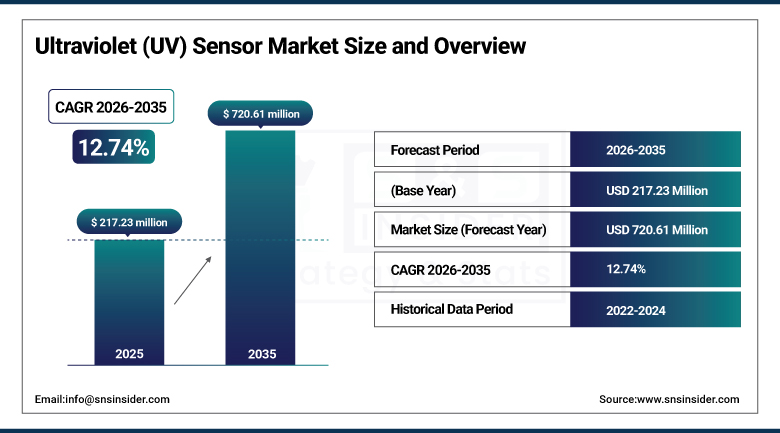
The Ultraviolet (UV) Sensor Market size was valued at USD 217.23 Million in 2025 and is expected to reach USD 720.61 Million by 2035, growing at a CAGR of 12.74% over the forecast period of 2026-2035.
The global UV Sensor Market is witnessing rapid expansion due to rising uses of UV monitoring in environmental, medical, and industrial domains. Increasing awareness regarding the hazards of UV radiation and the importance of protective measures is driving adoption in various industries. UV sensors have since become critical elements in air quality detection system, sterilization equipment and intelligent wear. Moreover, ongoing development of miniaturized sensors and their integration with IOT-supported platforms is also boosting deployment opportunities. As global sectors continue to move further towards intelligent, data driven solutions UV sensors are proving to be pivotal in providing safe and connected surroundings.
According to research, More than 100 smart city initiatives globally have incorporated UV sensor data into environmental dashboards for public health updates.
Ultraviolet (UV) Sensor Market Highlights:
Ultraviolet (UV) Sensor Market Size and Forecast:
-
Market Size in 2025: USD 217.23 Million
-
Market Size by 2035: USD 720.61 Million
-
CAGR: 12.74% from 2026 to 2035
-
Base Year: 2025
-
Forecast Period: 2026–2035
-
Historical Data: 2022–2024
To Get More Information On Ultraviolet (UV) Sensor Market - Request Free Sample Report
-
Researchers have developed a novel ultrafast UV‑C laser capable of producing and detecting pulses lasting less than a trillionth of a second, marking a major advancement in UV photonics.
-
The UV‑C laser system uses highly sensitive, atomically thin semiconductor sensors, enabling reliable detection at room temperature.
-
Demonstrations show that information can be transmitted via free‑space UV‑C laser communications, indicating potential for next‑generation optical wireless systems.
-
Advances in UV sensor design are appearing in wearable technology, with flexible sensors capable of real-time monitoring of sunlight exposure.
-
Wearable UV sensors use multi-junction oxide semiconductor heterostructures to achieve high responsiveness, stability under sunlight, and integration with personal health alerts.
-
Progress in both high-speed UV‑C lasers and wearable UV monitoring devices highlights expanding applications of UV sensors in communications, environmental monitoring, and personal health.
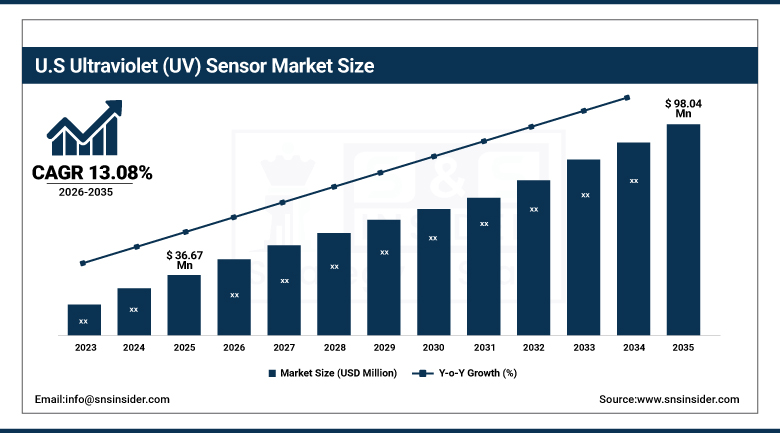
The U.S. Ultraviolet (UV) Sensor Market size was USD 36.67 million in 2025 and is expected to reach USD 98.04 million by 2035, growing at a CAGR of 13.08 % over the forecast period of 2026–2035.
The US UV sensor market growth is fueled by due to increasing demand in the healthcare and industrial safety sector, increasing investment in smart wearables, and increasing environmental regulations concerning monitoring. Key sensor vendors and increasing integration in IoT-supported architectures drive rapid adoption in the US, which lends a strong air to market prospects in it.
According to research, About 60% of U.S. healthcare providers use wearable devices for patient monitoring as of 2024, integrating sensors like UV, heart rate, and temperature.
Ultraviolet (UV) Sensor Market Drivers:
-
Increasing integration of UV sensors in wearables and consumer devices fuels market expansion across lifestyle and safety applications
Rising health awareness has immensely driven the need for wearable products embedded with UV sensors to track sun exposure and skin health. These sensors are currently featured in smartwatches, fitness bands, and phones, improving real-time user feedback. Furthermore, UV detection is also being incorporated into consumer electronics devices for promoting personal protection against sun exposure and outdoor risk assessment. Between increasing disposable incomes and the growing tendency toward urbanization, the market for smart devices that are equipped with environmental sensors are expected to boom. This development enables more widespread markets, most notably consumer health and electronics, where small, low-power sensors offer significant advantage.
According to research, More than 63% of global consumers in a 2024 survey reported using wearables to monitor personal health, including sun exposure and skin conditions.
Ultraviolet (UV) Sensor Market Restraints:
-
Performance limitations under extreme conditions reduce reliability in critical applications
UV detectors, especially inexpensive and small designed ones, generally experience a performance loss when subjected to severe environments containing high-temperatures, humidity, or rapid light intensities. This comes at the expense of their accuracy, lifespan and stability over time—rendering them inadequate for critical aerospace, defense and high-end industrial applications. Reliable in the long term In the sectors where long-term, stable monitoring is called for, reliability is a must. Thus, lacking ruggedness of present Ultraviolet Sensor technology in harsh environments may make the deployment of existing UV sensors unattractive while also causing them to be expensive to maintain, and/or requiring their replacement too often, weakening overall demand.
Ultraviolet (UV) Sensor Market Opportunities:
-
Integration of UV sensors in smart city infrastructure enhances environmental monitoring and public safety measures
The ultraviolet sensors are also being implemented into traffic systems, streetlights and public kiosks to track UV index levels as a part of smart city projects. These sensors can be used by town councils to monitor urban air quality as well as exposure to UV radiation for warnings to the public. It can also be combined with an IoT network to form a data center and makes it possible to perform data analysis in a centralized manner in an IoT system and is equipped with automatically control functions. Amid the increasing emphasis on sustainable urban residences and the monitoring of environmental patterns in real time, governments are investing more in sensor (device)-enabled infrastructures. This is a significant chance to ramp up UV-sensor locations throughout a city.
According to research, Over 68% of global municipalities implementing smart city solutions in 2024 are using real-time environmental monitoring for safety and planning.
Ultraviolet (UV) Sensor Market Segmentation Analysis:
By Product type
The UV Phototubes segment dominated the highest revenue share in the UV Sensor Market in 2025, capturing approximately 41.93%, This dominance is attributed to their widespread application in industrial and scientific domains where highly sensitive UV detection is essential. Their high dependability as well as demonstrated capabilities in harsh conditions, and cost-effective use for monitoring UV radiation in the industrial processes in addition to environmental testing and sterilization system also serves promote them as more niche or evolved niche sensor types in the market.
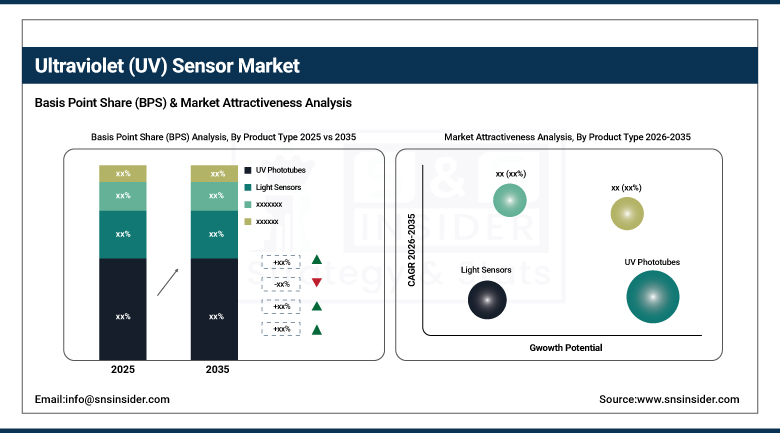
The UV Spectrum Sensors segment is projected to expand at the fastest CAGR of around 13.73% from 2026 to 2035. Their rapid growth is fueled by their ability to sense multiple UV bands (UVA, UVB and UVC) and to be used in advanced applications including wearables, smart homes and precision agriculture. Front-runners are, for example, companies like AMS-Osram AG, which already provide small, high-sensitivity UV spectral sensors to meet the increasing demand in consumer and environmental applications, and thus foster that rapid segment growth.
By Application
The Medical segment dominated the highest Ultraviolet (UV) Sensor Market share in 2025, accounting for approximately 32.18%. UV sensors in phototherapy, disinfecting appliances, and diagnostic equipment. This leadership is driven by the rising use of UV sensors are critical for monitoring the performance of UV-based sterilization systems and treatment methods, especially within hospitals and laboratories. Specialized UV sensors are also being offered by UV sensors companies like LAPIS Technology specifically for use in healthcare applications, so here the segment would be considered strong due to technological development and focus on precision.
The Consumer Electronics segment is anticipated to grow at the fastest CAGR of approximately 14.09% from 2026 to 2035. This growth is mainly due to the rising use of UV sensors in smartphones, wearables, and smart home devices. With the increasing market expectation for UV detection, UV sensors are being incorporated by electronic product manufacturers to provide additional health care value. For example, Silicon Labs’ cutting-edge UV sensor platforms for mobile and IoT products are enabling the growth of this market segment.
Ultraviolet (UV) Sensor Market Regional Analysis:
Asia-Pacific Ultraviolet (UV) Sensor Market Trends:
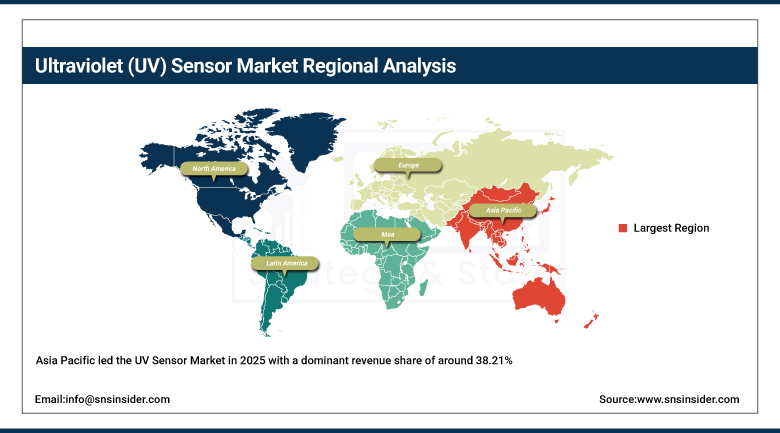
Asia Pacific led the UV Sensor Market in 2025 with a dominant revenue share of around 38.21%. That dominance has to do with a large concentration of electronics manufacturing in China, Japan, and South Korea. Furthermore, rapid industrialization, increasing environmental monitoring needs, and expanding application in the automotive, healthcare, and consumer goods segment are boosting the dominance across markets. A strong regional demand for UV sensors is further backed by government support in contamination monitoring and clean energy technologies.
-
China leads the Asia Pacific UV Sensor Market owing to the presence of vast electronics manufacturing industry, increasing industrial applications, and government-sponsored environmental monitoring projects. Furthermore, the nation's swift urbanisation and substantial R&D expenditure are also boosting the demand for UV sensing technologies.
Get Customized Report as Per Your Business Requirement - Enquiry Now
North America Ultraviolet (UV) Sensor Market Trends:
North America is projected to record the fastest CAGR of about 14.03% in the UV Sensor Market from 2026 to 2035. This rapid expansion is driven by increasing investment in smart technologies, environmental safety systems as well as medical innovation. The region’s intense concentration on industrial automation, high rate of wearable electronics adoption among the consumers, and extensive application of UV-C disinfection technologies in public infrastructure also drive the market. Furthermore, strong R&D and the availability of advanced sensor technology ecosystem is expected to encourage the development and adoption of UV sensors.
-
The U.S. leads the UV Sensor Market in North America owing to high presence of technology infrastructure, inclination towards adoption of smart devices and strict emphasis on health sector innovation. Further, substantial investments in industrial automation and environmental protection systems value keep them a major industry player.
Europe Ultraviolet (UV) Sensor Market Trends:
Europe holds a significant position in the global UV Sensor Market owing to the stringent environmental regulations, increasing health awareness and the presence of the automotive and industrial automation industries. Moreover, the nations such as Germany, France and United Kingdom are increasingly using UV sensors for air quality monitoring, disinfection systems, and consumer electronics applications. Market growth is also stimulated by constant innovation and sustainability targets.
-
Germany dominates the European UV Sensor Market due to its presence of large automotive and industrial base, enhanced manufacturing units, and pushes for green and clean environment. A surge in UV sensor adoption in industries such as automation, healthcare, and pollution monitoring also enhances its market dominance in the region.
Latin America andMiddle East & Africa Ultraviolet (UV) Sensor Market Trends:
Middle East & Africa, UAE is a market leader in UV Sensor Market owing to strong investment in smart infrastructure, healthcare innovation, and sustainability projects. The Latin American market is dominanted by Brazil, which can be attributed to burgeoning industrial sector, environmental laws, and increasing usage of UV-based disinfection & monitoring systems.
Ultraviolet (UV) Sensor Market Competitive Landscape:
ABB was founded in 1988 and is a global leader in electrification, automation, robotics, and industrial digital solutions. The company designs and delivers technologies for power grids, industrial automation, and motion products, including sensors and UV solutions, serving utilities, industry, and transport sectors worldwide with a focus on sustainability and innovation.
-
In 2024, ABB introduced the UviTec family at WEFTEC 2024—a UV/VIS‑based spectrophotometric water analyzer series, enabling real-time monitoring of water quality parameters via UV. This builds on ABB’s February 2024 acquisition of Real Tech’s optical sensor technology.
-
In 2023, ABB launched a next-generation flame detector equipped with UV/IR dual‑spectrum sensors. The UVISOR M3000 integrates an enhanced UV sensor covering 185–260 nm, combined with a 3.8 µm mid-IR channel.
Ultraviolet (UV) Sensor Market Key Players:
-
ABB AG
-
ARTECHE Group
-
AVX (Kyocera Group)
-
Block Transformatoren‑Elektronik
-
Captor
-
CD Automation UK
-
CIRCUTOR
-
Cosel Europe
-
DEM Spa
-
Microgate
-
STMicroelectronics N.V.
-
Silicon Labs
-
Vishay Intertechnology, Inc.
-
Broadcom Inc.
-
Panasonic Corporation
-
Texas Instruments Inc.
-
Analog Devices, Inc.
-
Hamamatsu Photonics K.K.
-
Solar Light Company, Inc.
-
Skye Instruments Ltd.
| Report Attributes | Details |
|---|---|
| Market Size in 2025 | USD 217.23 Million |
| Market Size by 2035 | USD 720.61 Million |
| CAGR | CAGR of 12.74% From 2026 to 2035 |
| Base Year | 2025 |
| Forecast Period | 2026-2035 |
| Historical Data | 2022-2024 |
| Report Scope & Coverage | Market Size, Segments Analysis, Competitive Landscape, Regional Analysis, DROC & SWOT Analysis, Forecast Outlook |
| Key Segments | • By Product type (UV Phototubes, Light Sensors, UV Spectrum Sensors) • By Application (Industrial, Automotive, Medical, Consumer Electronics, Others) |
| Regional Analysis/Coverage | North America (US, Canada), Europe (Germany, UK, France, Italy, Spain, Russia, Poland, Rest of Europe), Asia Pacific (China, India, Japan, South Korea, Australia, ASEAN Countries, Rest of Asia Pacific), Middle East & Africa (UAE, Saudi Arabia, Qatar, South Africa, Rest of Middle East & Africa), Latin America (Brazil, Argentina, Mexico, Colombia, Rest of Latin America). |
| Company Profiles | ABB AG, ARTECHE Group, AVX (Kyocera Group), Block Transformatoren‑Elektronik, Captor, CD Automation UK, CIRCUTOR, Cosel Europe, DEM Spa, Microgate, STMicroelectronics N.V., Silicon Labs, Vishay Intertechnology, Inc., Broadcom Inc., Panasonic Corporation, Texas Instruments Inc., Analog Devices, Inc., Hamamatsu Photonics K.K., Solar Light Company, Inc., Skye Instruments Ltd. |
Frequently Asked Questions
Asia Pacific dominated the UV Sensor Market in 2025.
UV Phototubes segment dominated the UV Sensor Market.
The major growth factor of the UV Sensor Market is the increasing demand for wearable UV monitoring, smart devices, and industrial safety systems.
The UV Sensor Market size was valued at USD 217.23 Million in 2025 and is expected to reach USD 720.61 Million by 2035
The UV Sensor Market is expected to grow at a CAGR of 12.74 % from 2026-2035.
Get in Touch
