Get more information on Ionic Liquids Marke - Request Sample Report
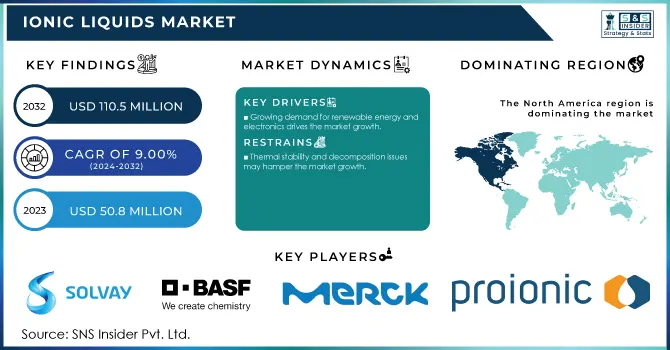
The Ionic Liquids Market size was valued at USD 50.8 Million in 2023. It is expected to grow to USD 110.5 Million by 2032 and grow at a CAGR of 9.00% over the forecast period of 2024-2032.
The ionic liquids market is gaining a lot of popularity in different chemical processing applications as they are used in different fields which is increasing their market. In particular, their unique characteristics like low vapor pressure, high thermal stability, and tunable viscosity enable them to behave as solvents, catalysts, electrolytes, and reaction media for various applications. ILs were reported to increase the efficiency and yield of organic synthesis reactions by up to 30% over traditional solvents, according to a U.S. Department of Energy report.
Ionic liquids are viewed as modern electrolytes in advanced battery systems, specifically in electrochemistry. With the U.S. Energy Information Administration (EIA) estimating that demand for advanced batteries will grow by 18% in 2030, these figures suggest a key role for ILs to help meet this burgeoning demand. In separation processes, ILs have proven to be particularly useful as extractive agents for target compounds.
Ionic liquids (ILs) have become popular in separation technology because of their great selectivity towards broad solutes and their extreme efficiency as solvents for a variety of separation and purification processes. These are ever more used for the extraction of precious metals mainly lithium and rare earth elements that obtained great importance for electronics and renewable energy technologies. For example, research shows an IL can recover over 90% of metal, which is a greener solution than traditional approaches. ILs also serve as effective desulfurization agents by more than 90%, thus meeting the strict environmental standards for reducing sulfur from fuels.
Such green strategies are essential in combating air pollution according to the U.S. Environmental Protection Agency (EPA). Additionally, ILs are also used to extract toxic substances from industrial waste streams thus improving waste management but with a lower environmental impact. The increasing industrial interest in ionic liquids for sustainable and efficient separation methods drives their development. With government-induced funding and handling of green technology projects, this trend is further solidified leading to innovation and adoption of ILs in multiple applications such as petrochemicals, mining, and wastewater treatment.
Drivers
Growing demand for renewable energy and electronics drives the market growth.
ionic liquids market is expected to see substantial growth owing to the increased use of renewables and improvements in electronics, particularly energy storage and electrochemical devices. The U.S. Department of Energy has ambitious goals to achieve a 100% clean electricity sector by 2035 as that is the course for global energy policies towards sustainability. Owing to their superior ionic conductivity and thermal stability, ionic liquids are being paid greater attention when used as electrolytes in batteries and supercapacitors which can improve the electrochemical performance of energy storage devices. One of the main causes of this increase is the incorporation of renewable energy, i.e., wind and solar power, that requires storage to balance intermittency on both sides of supply and demand.
Moreover, the electronics industry is also experiencing rapid growth the Consumer Technology Association projects that the global market for electronic devices will be USD 1.2 trillion by 2026. In electronics, the capability of ionic liquids from organic light-emitting diodes (OLEDs) to solar cells will continue to bolster their position in enabling the move towards a low-carbon economy.
Restraint
Thermal stability and decomposition issues may hamper the market growth.
Thermal stability is one of the key physical properties that can determine polymer ionic liquids (PILs) industrial feasibility, but the high-temperature thermal decomposition of some ILs limits this application. Although there are many ILs that can stand high temperatures, some formulations may decompose under thermal stress to emit VOC or other undesirable byproducts. Such decomposition can affect not only the stability of the ionic liquid but also an effective role in processes with massive temperature transportation as high-temperature reactions or energy storage systems. In catalysis or electrochemistry applications where temperature requires constant monitoring, the instability of certain ILs can adversely affect their application scope while also causing problems during operation. This means that parts of the industries that rely on high-temperature processing may take a more cautious approach toward the use of ionic liquids and will possibly seek more thermally stable alternatives.
By Application
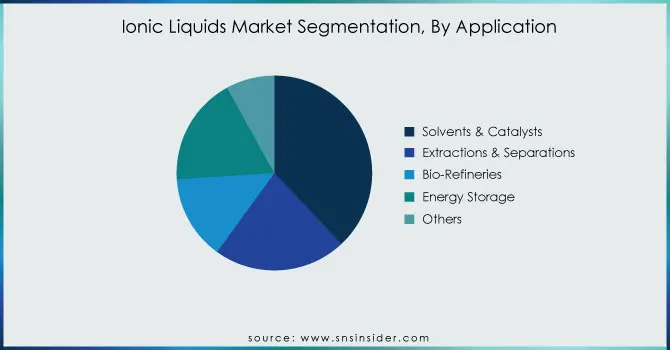
Solvents & Catalysts held the largest market share around 38% in 2023. This is due to the unique properties and versatile applications of ionic liquids to play such roles. Ionic liquids are particularly promising as solvents due to their near-zero vapor pressure, helping to mitigate emissions and improve safety in industrial processes. With tunable physicochemical properties, they can be engineered to serve a particular purpose; hence, formulating a solvent for miscellaneous organic/ inorganic compounds to dissolve in, as well as participating in or influencing the reactions and increasing yield. Ionic liquids function as effective mediums in catalysis, stabilizing reactive intermediates more selectively and often operating under milder conditions than standard solvents. These two factors, combined with their ability to solubilize both reactants and catalysts and provide a reaction environment that minimizes side reactions, make them fully dominate in this area.
Segment |
Description |
Key Applications |
---|---|---|
Solvents |
Ionic liquids are used in extraction, purification, and synthesis. |
Chemical manufacturing, pharmaceuticals |
Catalysts |
Ionic liquids are utilized to enhance reaction rates and selectivity. |
Petrochemical refining, organic synthesis |
Electrolytes |
Ionic liquids are employed in batteries and fuel cells. |
Energy storage, electrochemical devices |
Other Applications |
Other niche uses in fields like lubricants and separation processes. |
Specialty chemicals, environmental applications |
Do You Need any Customization Research on Ionic Liquids Market - Inquire Now
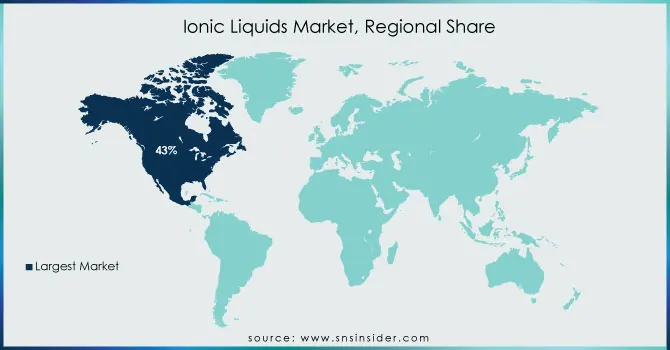
North America region held the highest market share around 43% in 2023. The region has a setup of chemical industry which is continuously evolving its promotional profile by implementing innovative solutions to make things more resource-efficient and eco-friendly. The presence of several prominent academic and research institutions facilitates the collaboration between industry and academia, supporting new formulations as well as applications of ionic liquids in pharmaceuticals, energy storage, or catalysis. In addition, strict U.S. regulations for volatile organic compounds (VOCs) by the Environmental Protection Agency (EPA) are pushing the industry toward greener alternatives such as ionic liquids to meet safety and environmental regulations. The Biden administration, via the U.S. Department of Energy (DOE), hopes to see the nation have a 100% clean electricity sector nationwide by 2035 the government is going big on alternative energy solutions. As such, we expect these ionic liquids to continue growing in the North American region as the innovation capabilities of companies are complemented by this offshore regulatory environment.
Get Customized Report as per your Business Requirement - Request For Customized Report
BASF SE (Basionic BC01, Basionic ST80)
Solvay S.A. (Cyphos IL 101, Cyphos IL 104)
Merck KGaA (EMIM BF4, BMIM PF6)
Ionic Liquids Technologies GmbH (IoLiTec) (IoLiLyte 101, IoLiLyte 110)
Proionic GmbH (Trihexyltetradecylphosphonium chloride, Ethylammonium nitrate)
Evonik Industries AG (TEGO IL X-101, TEGO IL K-102)
Strem Chemicals, Inc. (1-Butyl-3-methylimidazolium chloride, 1-Ethyl-3-methylimidazolium acetate)
The Chemours Company (Ionicool LTM-210, Ionicool LTM-300)
Tatva Chintan Pharma Chem Pvt. Ltd. (1-Butyl-3-methylimidazolium bis(trifluoromethylsulfonyl)imide, 1-Ethyl-3-methylimidazolium tetrafluoroborate)
Reinste Nano Ventures Pvt. Ltd. (1-Butyl-3-methylimidazolium bromide, 1-Ethyl-3-methylimidazolium trifluoromethanesulfonate)
Solvionic (EMIM OAc, BMIM Cl)
Scionix Ltd. (Choline Geranate, Choline Chloride)
Sigma-Aldrich Corporation (Merck Group) (1-Butyl-3-methylimidazolium tetrafluoroborate, 1-Hexyl-3-methylimidazolium hexafluorophosphate)
Tatvachintan Pharma Chem Pvt. Ltd. (1-Ethyl-3-methylimidazolium chloride, 1-Butyl-3-methylimidazolium methyl sulfate)
E-Ionic GmbH (Triethylammonium bis(trifluoromethylsulfonyl)imide, 1-Butyl-1-methylpyrrolidinium dicyanamide)
Emulsar Chemicals (BMIM BF4, BMIM Cl)
Zhejiang Lanke High-Purity Materials Co., Ltd. (LIPON IL-101, LIPON IL-103)
Green Performance Materials (GPM) Ltd. (BMIM TFSI, BMIM Ac)
Rhodia (Ammonium nitrate-based ILs, Phosphonium-based ILs)
Thermo Fisher Scientific (1-Ethyl-3-methylimidazolium ethyl sulfate, 1-Butyl-3-methylimidazolium hexafluorophosphate)
In 2023, BASF launched a new range of ionic liquids designed for use in sustainable and efficient processes, particularly in the field of green chemistry. This product line aims to provide solutions for chemical synthesis and separation processes, highlighting the company's commitment to sustainable innovation.
In 2022, Solvay introduced a novel ionic liquid platform that enhances the performance of lithium-ion batteries. This development focuses on improving the thermal stability and safety of electrolytes used in energy storage applications, addressing the growing demand for high-performance batteries in electric vehicles and renewable energy systems.
Report Attributes | Details |
---|---|
Market Size in 2023 | US$ 50.8 Million |
Market Size by 2032 | US$ 110.5 Million |
CAGR | CAGR of 9.00% From 2024 to 2032 |
Base Year | 2023 |
Forecast Period | 2024-2032 |
Historical Data | 2020-2022 |
Report Scope & Coverage | Market Size, Segments Analysis, Competitive Landscape, Regional Analysis, DROC & SWOT Analysis, Forecast Outlook |
Key Segments | • By Application (Solvents & Catalysts, Extractions & Separations, Bio-Refineries, Energy Storage, Others), |
Regional Analysis/Coverage | North America (US, Canada, Mexico), Europe (Eastern Europe [Poland, Romania, Hungary, Turkey, Rest of Eastern Europe] Western Europe] Germany, France, UK, Italy, Spain, Netherlands, Switzerland, Austria, Rest of Western Europe]), Asia Pacific (China, India, Japan, South Korea, Vietnam, Singapore, Australia, Rest of Asia Pacific), Middle East & Africa (Middle East [UAE, Egypt, Saudi Arabia, Qatar, Rest of Middle East], Africa [Nigeria, South Africa, Rest of Africa], Latin America (Brazil, Argentina, Colombia, Rest of Latin America) |
Company Profiles | BASF SE, Solvay S.A., Merck KGaA, Ionic Liquids Technologies GmbH (IoLiTec), Proionic GmbH, Evonik Industries AG, Strem Chemicals, Inc., The Chemours Company, Tatva Chintan Pharma Chem Pvt. Ltd., Reinste Nano Ventures Pvt. Ltd., Solvionic, Scionix Ltd., Sigma-Aldrich Corporation (Merck Group), Tatvachintan Pharma Chem Pvt. Ltd., E-Ionic GmbH, Emulsar Chemicals, Zhejiang Lanke High-Purity Materials Co., Ltd., Green Performance Materials (GPM) Ltd., Rhodia, Thermo Fisher Scientific. Others |
Key Drivers | •Growing demand in renewable energy and electronics drives the market growth. |
RESTRAINTS | •Thermal stability and decomposition issues may hamper the market growth. |
Ans: The Ionic Liquids Market was valued at USD 50.8 Million in 2023.
Ans: The expected CAGR of the global Ionic Liquids Market during the forecast period is 9.00%.
Ans: The Solvents & Catalysts segment product will grow rapidly in the Ionic Liquids Market from 2024-2032.
Ans: Growing demand in renewable energy and electronics drives the market growth.
Ans: The U.S. led the Ionic Liquids Market in the North America region with the highest revenue share in 2023.
Table of Contents
1. Introduction
1.1 Market Definition
1.2 Scope (Inclusion and Exclusions)
1.3 Research Assumptions
2. Executive Summary
2.1 Market Overview
2.2 Regional Synopsis
2.3 Competitive Summary
3. Research Methodology
3.1 Top-Down Approach
3.2 Bottom-up Approach
3.3. Data Validation
3.4 Primary Interviews
4. Market Dynamics Impact Analysis
4.1 Market Driving Factors Analysis
4.1.1 Drivers
4.1.2 Restraints
4.1.3 Opportunities
4.1.4 Challenges
4.2 PESTLE Analysis
4.3 Porter’s Five Forces Model
5. Statistical Insights and Trends Reporting
5.1 Production Capacity and Utilization, by Country, by Type, 2023
5.2 Feedstock Prices, by Country, by Type, 2023
5.3 Regulatory Impact, by Country, by Type, 2023.
5.4 Environmental Metrics: Emissions Data, Waste Management Practices, and Sustainability Initiatives, by Region
5.5 Innovation and R&D, by Type, 2023
6. Competitive Landscape
6.1 List of Major Companies, By Region
6.2 Market Share Analysis, By Region
6.3 Product Benchmarking
6.3.1 Product specifications and features
6.3.2 Pricing
6.4 Strategic Initiatives
6.4.1 Marketing and promotional activities
6.4.2 Distribution and supply chain strategies
6.4.3 Expansion plans and new product launches
6.4.4 Strategic partnerships and collaborations
6.5 Technological Advancements
6.6 Market Positioning and Branding
7. Ionic Liquids Market Segmentation, By Application
7.2 Solvents & Catalysts
7.2.1 Solvents & Catalysts Market Trends Analysis (2020-2032)
7.2.2 Solvents & Catalysts Market Size Estimates and Forecasts to 2032 (USD Million)
7.3 Extractions & Separations
7.3.1 Extractions & Separations Market Trends Analysis (2020-2032)
7.3.2 Extractions & Separations Market Size Estimates and Forecasts to 2032 (USD Million)
7.4 Bio-Refineries
7.4.1 Bio-Refineries Market Trends Analysis (2020-2032)
7.4.2 Bio-Refineries Market Size Estimates and Forecasts to 2032 (USD Million)
7.5 Energy Storage
7.5.1 Energy Storage Market Trends Analysis (2020-2032)
7.5.2 Energy Storage Market Size Estimates and Forecasts to 2032 (USD Million)
7.6 Others
7.6.1 Others Market Trends Analysis (2020-2032)
7.6.2 Others Market Size Estimates and Forecasts to 2032 (USD Million)
8. Regional Analysis
8.1 Chapter Overview
8.2 North America
8.2.1 Trends Analysis
8.2.2 North America Ionic Liquids Market Estimates and Forecasts, by Country (2020-2032) (USD Million)
8.2.3 North America Ionic Liquids Market Estimates and Forecasts, by Application (2020-2032) (USD Million)
8.2.2 USA
8.2.2.1 USA Ionic Liquids Market Estimates and Forecasts, by Application (2020-2032) (USD Million)
8.2.3 Canada
8.2.3.1 Canada Ionic Liquids Market Estimates and Forecasts, by Application (2020-2032) (USD Million)
8.2.4 Mexico
8.2.4.1 Mexico Ionic Liquids Market Estimates and Forecasts, by Application (2020-2032) (USD Million)
8.3 Europe
8.3.1 Eastern Europe
8.3.1.1 Trends Analysis
8.3.1.2 Eastern Europe Ionic Liquids Market Estimates and Forecasts, by Country (2020-2032) (USD Million)
8.3.1.3 Eastern Europe Ionic Liquids Market Estimates and Forecasts, by Application (2020-2032) (USD Million)
8.3.1.4 Poland
8.3.1.4.1 Poland Ionic Liquids Market Estimates and Forecasts, by Application (2020-2032) (USD Million)
8.3.1.5 Romania
8.3.1.5.1 Romania Ionic Liquids Market Estimates and Forecasts, by Application (2020-2032) (USD Million)
8.3.1.6 Hungary
10.3.1.8.1 Hungary Ionic Liquids Market Estimates and Forecasts, by Application (2020-2032) (USD Million)
8.3.1.7 Turkey
8.3.1.7.1 Turkey Ionic Liquids Market Estimates and Forecasts, by Application (2020-2032) (USD Million)
8.3.1.8 Rest of Eastern Europe
8.3.1.8.1 Rest of Eastern Europe Ionic Liquids Market Estimates and Forecasts, by Application (2020-2032) (USD Million)
8.3.2 Western Europe
8.3.2.1 Trends Analysis
8.3.2.2 Western Europe Ionic Liquids Market Estimates and Forecasts, by Country (2020-2032) (USD Million)
8.3.2.3 Western Europe Ionic Liquids Market Estimates and Forecasts, by Application (2020-2032) (USD Million)
8.3.2.4 Germany
8.3.2.4.1 Germany Ionic Liquids Market Estimates and Forecasts, by Application (2020-2032) (USD Million)
8.3.2.5 France
8.3.2.5.1 France Ionic Liquids Market Estimates and Forecasts, by Application (2020-2032) (USD Million)
8.3.2.6 UK
8.3.2.6.1 UK Ionic Liquids Market Estimates and Forecasts, by Application (2020-2032) (USD Million)
8.3.2.7 Italy
8.3.2.7.1 Italy Ionic Liquids Market Estimates and Forecasts, by Application (2020-2032) (USD Million)
8.3.2.8 Spain
8.3.2.8.1 Spain Ionic Liquids Market Estimates and Forecasts, by Application (2020-2032) (USD Million)
8.3.2.9 Netherlands
8.3.2.9.1 Netherlands Ionic Liquids Market Estimates and Forecasts, by Application (2020-2032) (USD Million)
8.3.2.10 Switzerland
8.3.2.10.1 Switzerland Ionic Liquids Market Estimates and Forecasts, by Application (2020-2032) (USD Million)
8.3.2.11 Austria
8.3.2.11.1 Austria Ionic Liquids Market Estimates and Forecasts, by Application (2020-2032) (USD Million)
8.3.2.12 Rest of Western Europe
8.3.2.12.1 Rest of Western Europe Ionic Liquids Market Estimates and Forecasts, by Application (2020-2032) (USD Million)
8.4 Asia-Pacific
8.4.1 Trends Analysis
8.4.2 Asia-Pacific Ionic Liquids Market Estimates and Forecasts, by Country (2020-2032) (USD Million)
8.4.3 Asia-Pacific Ionic Liquids Market Estimates and Forecasts, by Application (2020-2032) (USD Million)
8.4.4 China
8.4.4.1 China Ionic Liquids Market Estimates and Forecasts, by Application (2020-2032) (USD Million)
8.4.5 India
8.4.5.1 India Ionic Liquids Market Estimates and Forecasts, by Application (2020-2032) (USD Million)
8.4.6 Japan
8.4.6.1 Japan Ionic Liquids Market Estimates and Forecasts, by Application (2020-2032) (USD Million)
8.4.7 South Korea
8.4.7.1 South Korea Ionic Liquids Market Estimates and Forecasts, by Application (2020-2032) (USD Million)
8.4.8 Vietnam
8.4.8.1 Vietnam Ionic Liquids Market Estimates and Forecasts, by Application (2020-2032) (USD Million)
8.4.9 Singapore
8.4.9.1 Singapore Ionic Liquids Market Estimates and Forecasts, by Application (2020-2032) (USD Million)
8.4.10 Australia
8.4.10.1 Australia Ionic Liquids Market Estimates and Forecasts, by Application (2020-2032) (USD Million)
8.4.11 Rest of Asia-Pacific
8.4.11.1 Rest of Asia-Pacific Ionic Liquids Market Estimates and Forecasts, by Application (2020-2032) (USD Million)
8.5 Middle East and Africa
8.5.1 Middle East
8.5.1.1 Trends Analysis
8.5.1.2 Middle East Ionic Liquids Market Estimates and Forecasts, by Country (2020-2032) (USD Million)
10.5.1.3 Middle East Ionic Liquids Market Estimates and Forecasts, by Application (2020-2032) (USD Million)
8.5.1.4 UAE
8.5.1.4.1 UAE Ionic Liquids Market Estimates and Forecasts, by Application (2020-2032) (USD Million)
8.5.1.5 Egypt
8.5.1.5.1 Egypt Ionic Liquids Market Estimates and Forecasts, by Application (2020-2032) (USD Million)
8.5.1.6 Saudi Arabia
8.5.1.6.1 Saudi Arabia Ionic Liquids Market Estimates and Forecasts, by Application (2020-2032) (USD Million)
8.5.1.7 Qatar
8.5.1.7.1 Qatar Ionic Liquids Market Estimates and Forecasts, by Application (2020-2032) (USD Million)
8.5.1.8 Rest of Middle East
8.5.1.8.1 Rest of Middle East Ionic Liquids Market Estimates and Forecasts, by Application (2020-2032) (USD Million)
8.5.2 Africa
8.5.2.1 Trends Analysis
8.5.2.2 Africa Ionic Liquids Market Estimates and Forecasts, by Country (2020-2032) (USD Million)
8.5.2.3 Africa Ionic Liquids Market Estimates and Forecasts, by Application (2020-2032) (USD Million)
8.5.2.4 South Africa
8.5.2.4.1 South Africa Ionic Liquids Market Estimates and Forecasts, by Application (2020-2032) (USD Million)
8.5.2.5 Nigeria
8.5.2.5.1 Nigeria Ionic Liquids Market Estimates and Forecasts, by Application (2020-2032) (USD Million)
8.5.2.6 Rest of Africa
8.5.2.6.1 Rest of Africa Ionic Liquids Market Estimates and Forecasts, by Application (2020-2032) (USD Million)
8.6 Latin America
8.6.1 Trends Analysis
8.6.2 Latin America Ionic Liquids Market Estimates and Forecasts, by Country (2020-2032) (USD Million)
8.6.3 Latin America Ionic Liquids Market Estimates and Forecasts, by Application (2020-2032) (USD Million)
8.6.4 Brazil
8.6.4.1 Brazil Ionic Liquids Market Estimates and Forecasts, by Application (2020-2032) (USD Million)
8.6.5 Argentina
8.6.5.1 Argentina Ionic Liquids Market Estimates and Forecasts, by Application (2020-2032) (USD Million)
8.6.6 Colombia
8.6.6.1 Colombia Ionic Liquids Market Estimates and Forecasts, by Application (2020-2032) (USD Million)
8.6.7 Rest of Latin America
8.6.7.1 Rest of Latin America Ionic Liquids Market Estimates and Forecasts, by Application (2020-2032) (USD Million)
9. Company Profiles
9.1 BASF SE
9.1.1 Company Overview
9.1.2 Financial
9.1.3 Products/ Services Offered
9.1.4 SWOT Analysis
9.2 Solvay S.A.
9.2.1 Company Overview
9.2.2 Financial
9.2.3 Products/ Services Offered
9.2.4 SWOT Analysis
9.3 Merck KGaA
9.3.1 Company Overview
9.3.2 Financial
9.3.3 Products/ Services Offered
9.3.4 SWOT Analysis
9.4 Ionic Liquids Technologies GmbH
9.4.1 Company Overview
9.4.2 Financial
9.4.3 Products/ Services Offered
9.4.4 SWOT Analysis
9.5 Evonik Industries AG
9.5.1 Company Overview
9.5.2 Financial
9.5.3 Products/ Services Offered
9.5.4 SWOT Analysis
9.6 Strem Chemicals, Inc.
9.6.1 Company Overview
9.6.2 Financial
9.6.3 Products/ Services Offered
9.6.4 SWOT Analysis
9.7 The Chemours Company
9.7.1 Company Overview
9.7.2 Financial
9.7.3 Products/ Services Offered
9.7.4 SWOT Analysis
9.8 Tatva Chintan Pharma Chem Pvt. Ltd.
9.8.1 Company Overview
9.8.2 Financial
9.8.3 Products/ Services Offered
9.8.4 SWOT Analysis
9.9 Reinste Nano Ventures Pvt. Ltd.
9.9.1 Company Overview
9.9.2 Financial
9.9.3 Products/ Services Offered
9.9.4 SWOT Analysis
9.10 E-Ionic GmbH
9.10.1 Company Overview
9.10.2 Financial
9.10.3 Products/ Services Offered
9.10.4 SWOT Analysis
10. Use Cases and Best Practices
11. Conclusion
An accurate research report requires proper strategizing as well as implementation. There are multiple factors involved in the completion of good and accurate research report and selecting the best methodology to compete the research is the toughest part. Since the research reports we provide play a crucial role in any company’s decision-making process, therefore we at SNS Insider always believe that we should choose the best method which gives us results closer to reality. This allows us to reach at a stage wherein we can provide our clients best and accurate investment to output ratio.
Each report that we prepare takes a timeframe of 350-400 business hours for production. Starting from the selection of titles through a couple of in-depth brain storming session to the final QC process before uploading our titles on our website we dedicate around 350 working hours. The titles are selected based on their current market cap and the foreseen CAGR and growth.
The 5 steps process:
Step 1: Secondary Research:
Secondary Research or Desk Research is as the name suggests is a research process wherein, we collect data through the readily available information. In this process we use various paid and unpaid databases which our team has access to and gather data through the same. This includes examining of listed companies’ annual reports, Journals, SEC filling etc. Apart from this our team has access to various associations across the globe across different industries. Lastly, we have exchange relationships with various university as well as individual libraries.
Step 2: Primary Research
When we talk about primary research, it is a type of study in which the researchers collect relevant data samples directly, rather than relying on previously collected data. This type of research is focused on gaining content specific facts that can be sued to solve specific problems. Since the collected data is fresh and first hand therefore it makes the study more accurate and genuine.
We at SNS Insider have divided Primary Research into 2 parts.
Part 1 wherein we interview the KOLs of major players as well as the upcoming ones across various geographic regions. This allows us to have their view over the market scenario and acts as an important tool to come closer to the accurate market numbers. As many as 45 paid and unpaid primary interviews are taken from both the demand and supply side of the industry to make sure we land at an accurate judgement and analysis of the market.
This step involves the triangulation of data wherein our team analyses the interview transcripts, online survey responses and observation of on filed participants. The below mentioned chart should give a better understanding of the part 1 of the primary interview.
Part 2: In this part of primary research the data collected via secondary research and the part 1 of the primary research is validated with the interviews from individual consultants and subject matter experts.
Consultants are those set of people who have at least 12 years of experience and expertise within the industry whereas Subject Matter Experts are those with at least 15 years of experience behind their back within the same space. The data with the help of two main processes i.e., FGDs (Focused Group Discussions) and IDs (Individual Discussions). This gives us a 3rd party nonbiased primary view of the market scenario making it a more dependable one while collation of the data pointers.
Step 3: Data Bank Validation
Once all the information is collected via primary and secondary sources, we run that information for data validation. At our intelligence centre our research heads track a lot of information related to the market which includes the quarterly reports, the daily stock prices, and other relevant information. Our data bank server gets updated every fortnight and that is how the information which we collected using our primary and secondary information is revalidated in real time.
Step 4: QA/QC Process
After all the data collection and validation our team does a final level of quality check and quality assurance to get rid of any unwanted or undesired mistakes. This might include but not limited to getting rid of the any typos, duplication of numbers or missing of any important information. The people involved in this process include technical content writers, research heads and graphics people. Once this process is completed the title gets uploader on our platform for our clients to read it.
Step 5: Final QC/QA Process:
This is the last process and comes when the client has ordered the study. In this process a final QA/QC is done before the study is emailed to the client. Since we believe in giving our clients a good experience of our research studies, therefore, to make sure that we do not lack at our end in any way humanly possible we do a final round of quality check and then dispatch the study to the client.
Key Segments:
By Application
Solvents & Catalysts
Extractions & Separations
Bio-Refineries
Energy Storage
Others
Request for Segment Customization as per your Business Requirement: Segment Customization Request
Regional Coverage:
North America
US
Canada
Mexico
Europe
Eastern Europe
Poland
Romania
Hungary
Turkey
Rest of Eastern Europe
Western Europe
Germany
France
UK
Italy
Spain
Netherlands
Switzerland
Austria
Rest of Western Europe
Asia Pacific
China
India
Japan
South Korea
Vietnam
Singapore
Australia
Rest of Asia Pacific
Middle East & Africa
Middle East
UAE
Egypt
Saudi Arabia
Qatar
Rest of Middle East
Africa
Nigeria
South Africa
Rest of Africa
Latin America
Brazil
Argentina
Colombia
Rest of Latin America
Request for Country Level Research Report: Country Level Customization Request
Available Customization
With the given market data, SNS Insider offers customization as per the company’s specific needs. The following customization options are available for the report:
Product Analysis
Criss-Cross segment analysis (e.g. Product X Application)
Product Matrix which gives a detailed comparison of product portfolio of each company
Geographic Analysis
Additional countries in any of the regions
Company Information
Detailed analysis and profiling of additional market players (Up to five)
The Chitosan Market Size was valued at USD 12.7 billion in 2023 and is expected to reach USD 71.5 billion by 2032 and grow at a CAGR of 21.2% by 2024-2032.
The CNG, RNG, and Hydrogen Tanks Market size was valued at USD 2.65 billion in 2023 & is expected to reach USD 6.56 billion by 2032 & grow at a CAGR of 10.6% by 2024-2032.
The Lignin Market Size was valued at USD 1.10 billion in 2023, and is expected to reach USD 1.60 billion by 2032, and grow at a CAGR of 4.3% over the forecast period 2024-2032.
The Semiconductor gases market size was USD 10.26 billion in 2023 and is expected to Reach USD 18.08 billion by 2031 and grow at a CAGR of 7.3% over the forecast period of 2024-2031.
The Lubricant Additives Market size was valued at USD 17.58 Billion in 2023 & will grow to USD 25.01 Billion by 2032 and grow at a CAGR of 4% by 2024-2032.
Enzyme Substrates Market Size was valued at USD 14.3 Billion in 2023 and is expected to reach USD 26.1 Billion by 2032 and grow at a CAGR of 6.9% over the forecast period 2024-2032.
Hi! Click one of our member below to chat on Phone