Get more information on LED Chip Market - Request Sample Report
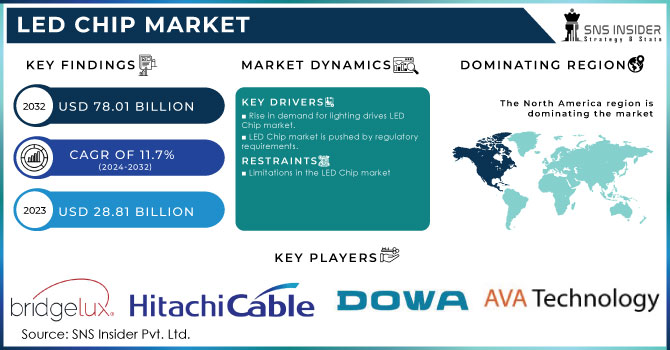
The LED Chip Market Size was valued at USD 28.81 billion in 2023. It is expected to grow to USD 78.01 billion by 2032 and grow at a CAGR of 11.7% over the forecast period of 2024-2032.
Rapid growth in the LED Chip market is being fueled by a higher need for energy-efficient and durable lighting options. These chips are leading the lighting revolution as a fundamental part of LED bulbs. LED chips are in high demand in the United States due to the widespread use of LED lighting, which is expected to result in significant energy conservation. In 2035, LED technology is expected to take over the lighting sector, saving an estimated 569 terawatt-hours of energy per year, which is equal to the power produced by over 92 1,000 MW power plants. This impressive number highlights the huge possibility of LED chips in aiding a sustainable energy future. Homeowners are at the forefront of the trend towards using LED bulbs, specifically those that are ENERGY STAR approved and use 75% less energy while lasting 25 times longer than standard incandescent bulbs. The growth of the LED Chip market is being driven directly by this increase in demand. With advancements in technology leading to better light quality, efficiency, and durability, the LED Chip is projected to become a cornerstone in the lighting industry as the market continues to grow.
Government policies are driving the surge in the LED Chip market. Nations such as China and India have put in place strong measures to encourage the use of LED lights, such as tax benefits, requirements for government purchases, and standards for energy efficiency. The US is playing a proactive role by updating lighting regulations and encouraging the use of LEDs in federal purchases. International initiatives such as the IEA's 4E SSL Annex and SEAD Initiative are establishing worldwide standards for LED quality and performance. These measures, along with the growing focus on energy saving and environmental responsibility, are establishing a conducive atmosphere for the LED sector. With energy conservation as a top priority for governments globally, and a decrease in reliance on traditional lighting technologies, the market for LED chips is predicted to experience a significant increase in demand, leading to overall market growth.
Market Dynamics
Drivers
Rise in demand for lighting drives LED Chip market.
The increasing need for lighting solutions is a key factor driving the LED chips market. The rise in the world's population is causing a growth in both residential and commercial constructions. Furthermore, the shift towards bigger residential and commercial areas has greatly increased the overall space in need of lighting. Over the last twenty years, the amount of space to be illuminated has increased by around 60%, and it is expected to rise by a further 20% in the next decade, adding another 45 billion square meters of space. The growing wealth, particularly in developing economies, has also led to a rise in the need for lighting. Consumers are spending more on lighting services and purchasing higher-quality products as their disposable income increases. The increase in population, urbanization, and improving living conditions is fueling a strong need for lighting options, which in turn is boosting the LED Chip industry.
LED Chip market is pushed by regulatory requirements.
The global regulatory push for energy-efficient lighting is providing strong support for the LED Chip market. The quick shift to LEDs, with sales increasing from 5% in 2013 to around 50% in 2022, proves this pattern. Governments globally are enacting strict measures to eliminate outdated lighting technologies such as incandescent and fluorescent bulbs. An example is the European Union taking the lead by implementing the Eco design regulation and RoHS Directive, which require the elimination of mercury-containing fluorescent lamps by 2023. In the same vein, Africa is suggesting a worldwide prohibition on fluorescent lamps, with countries such as South Africa, the United Kingdom, and the East African Community implementing rigorous efficiency requirements for lighting goods. These regulatory efforts, along with the growing energy efficiency of LEDs, which have improved by 4 lm/W each year since 2010, are pushing a significant move towards LED technology. Therefore, there is anticipation that the need for LED chips will increase significantly as producers work to satisfy the rising demand for energy-saving lighting options.
Efficiency and policy drive a promising future for the LED chip market.
The LED chip market is set to experience significant growth due to the worldwide move towards energy-saving lighting options. Despite an increase in overall electricity usage for lighting in 2022, the continued adoption of LEDs and enhancements in lighting efficiency are helping to reduce the effects on CO2 emissions. The trend is speeding up due to the replacement of incandescent and fluorescent lamps by LEDs. Around 50% of all residential lighting sales on a global scale currently make use of LED technology, showing a substantial presence in the market. In order to reach Net Zero Emissions by 2050, the rapid adoption of LED technology needs to be sustained. Governments around the globe are implementing measures to aid in this shift. As an example, the United Kingdom has set strict energy efficiency guidelines for lighting, with a minimum requirement of 120 Lumens per Watt (lm/W) by 2023 and 140 lm/W by 2027. In the same way, the East African Community has implemented a regional standard for discontinuing traditional and fluorescent light bulbs. In South Africa, General Service Lamps must be at least 90 lm/W efficient. The combination of regulatory measures and growing consumer demand for energy-efficient lighting is leading to a strong market for LED chips. With the increasing need for better efficiency and performance, the LED Chip market is projected to experience substantial growth in the future.
Restraints
Limitations in the LED Chip market
The LED Chip market is growing substantially but is dealing with various obstacles. Intense competition and industry overcapacity serve as a major limitation. With 142 LED fabs globally, as reported by SEMI, the industry has reached a point of saturation, resulting in price competitions and lower profit margins for producers. Meeting the DOE's goal of USD 2 per thousand lumens will be challenging, necessitating significant investments in research and development and enhancements in operational efficiency, leading to heightened competition. Manufacturers outside of Asia face obstacles due to the high concentration of LED die and package production in the region. This concentrated geography may affect the stability of the supply chain, lead times, and expenses. Although the United States is strong in manufacturing LED luminaires, it will need to make substantial investments in domestic LED Chip and package production to increase its share of the value-added supply chain. Global supply chains have been disrupted by the COVID-19 pandemic and current geopolitical tensions, resulting in higher costs, lack of components, and delays in production. These conditions have caused doubts for manufacturers of LED chips and slowed down the expansion of the market.
Dependency on rare earths poses a barrier to growth in the LED Chip market
The LED Chip market is challenged by scarcity and political risks linked to rare earth materials. China, which dominates more than 80% of the worldwide supply, is the main source of crucial elements such as gallium, indium, and yttrium needed for optimal LED functioning. This excessive dependence leads to weaknesses in the supply chain and fluctuations in prices, affecting the total cost and stability of LED Chip manufacturing. Competition for rare earth elements is growing due to the increasing demand in the clean energy sector, including electric vehicles and renewable energy technologies. The need for these materials is expected to increase in the future, possibly worsening supply limitations and raising costs for manufacturers of LED chips. The industry is facing a significant challenge due to the growing scarcity and expense of rare earth elements, requiring creative solutions to decrease dependence on these crucial resources.
Segment Analysis
By Product
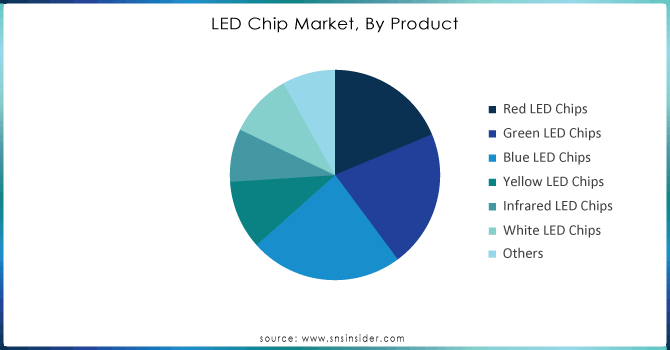
Based On Product, Blue LED Chips dominated the LED Chip Market with 29% of share in 2023. Their crucial function in producing white light via phosphor conversion has led to their extensive use in various lighting purposes. The superior performance of blue LEDs in creating white light has played a key role in pushing the transition to energy-saving lighting options. The upcoming change is expected to bring significant advantages, potentially leading to a saving of 6.9 trillion kWh of electricity by 2035 with the use of advanced lighting systems, as estimated by the DOE. These energy savings result in important economic and environmental benefits, such as decreased energy expenses and carbon emissions. As advancements are made in the industry to enhance LED efficiency, the opportunity for increased energy savings and a more sustainable future becomes more evident.
Need any customization research on LED Chip Market - Enquiry Now
By Application
Based on Application, Automotive dominated the LED Chip Market with 32% of share in 2023.High-quality diodes have a sizeable metal plate that enables improved heat regulation. The diode can carry more current due to better heat dissipation, resulting in increased light emission area and higher light output. The heat resistance of a basic 5 mm LED is one-tenth less compared to a simple 5 mm LED. Practically speaking, this indicates that a high-performance diode like the Luxeon Rebel has an emission area of around 1 mm squared and an efficiency of approximately. 40-100 units of luminous flux. The strength of this far exceeds that of a regular 5 mm standard LED. Measuring 0.25 mm and with power under 0.1 W and 20-30 mA, the efficiency of only 1-2 Lumen is achieved by LEDs. Their compact and flat structure allows for innovative product designs, such as the "LEDayFlex" daytime running light module for vehicles.
Regional Analysis
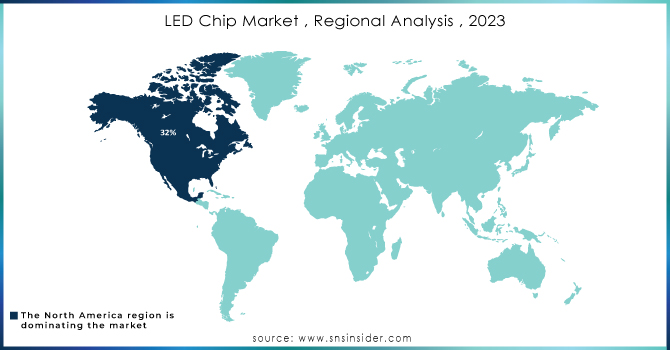
In 2023, North America, particularly the United States, has emerged as a dominant player in the LED Chip market, holding a notable 32% market share. This leadership role is credited to a mix of strong manufacturing abilities, advances in technology, and increasing demand. The United States has a strong network of LED Chip makers such as Cree, Lumileds, and Bridgelux, which contribute to innovation and quality products.Advancements in technology, like the progress made with GaN on silicon substrates, have improved the efficiency of LEDs and lowered expenses, firmly establishing the United States as a leader in technology. Additionally, the growing automotive industry in the United States, along with a high vehicle ownership rate of 73%, has increased the need for LED lighting parts. The market has expanded even more due to factors such as rising energy costs and environmental worries, which have prompted a move towards energy-efficient lighting in both commercial and residential areas. For example, LED lights can decrease energy usage by as much as 80% when compared to incandescent bulbs, leading to significant energy conservation of 28.2 billion kWh per year thanks to utility efficiency initiatives. The combination of technological skill, production capabilities, and consumer need has strengthened North America's leadership in the LED Chip sector.
Asia Pacific is the fastest growing in LED Chip Market with 28% of share in 2023, due to strong growth in consumer electronics and automotive industries. The demand for medium and high-power LEDs in this area is being driven by rising disposable incomes, fast urbanization, and a move towards more advanced technology. In India, the consumer electronics market is currently worth almost USD 10 billion in 2022 and is expected to grow twofold by 2025, showcasing this trend. Government efforts continue to speed up the adoption of LED technology. These initiatives generate a hopeful perspective for the local market. Nevertheless, the Chinese LED Chip manufacturing industry has been disturbed by the trade tensions between the US and China. Exporting semiconductor equipment has been hindered by restrictions, leading to a slowdown in production. In spite of these obstacles, a few Chinese chip makers are progressing in enhancing their abilities, indicating a possible recovery for the Chinese industry in the near future. In its entirety, the Asia-Pacific region's robust consumer electronics demand, expanding automotive industry, and government-supported programs establish it as a key growth driver for the LED Chip market.
The major key players are Bright LED Electronics Corporation, AVA Technologies, Inc., Bridgelux, Inc., Hitachi Cable, Ltd., Dowa Electronics Materials Co., Ltd., Optek Technology, Cree LED., Nichia Corporation, Epistar Corporation, Huga Optech, Inc., and other key players mentioned in the final report.
In Oct 2020, Cree Inc. made a significant announcement regarding a business deal. The company revealed its decision to divest its LED business unit to Smart Global Holdings for a substantial amount exceeding $300 million.
In April 2023, Sharp NEC introduces the LED FC Series featuring COB technology for long-lasting, high-contrast screens.
In January 2023, Nichia and Infineon release the first fully integrated micro-LED light engine for HD adaptive driving beams in the industry.
In May 2022, AMS OSRAM introduces OSLON Optimal LEDs for horticulture lighting, offering top efficiency and dependability.
Report Attributes | Details |
Market Size in 2023 | USD 25.8 Billion |
Market Size by 2032 | USD 78.01 Billion |
CAGR | CAGR of 11.7% From 2024 to 2032 |
Base Year | 2023 |
Forecast Period | 2024-2032 |
Historical Data | 2020-2022 |
Report Scope & Coverage | Market Size, Segments Analysis, Competitive Landscape, Regional Analysis, DROC & SWOT Analysis, Forecast Outlook |
Key Segments | • By Product (Red LED Chips, Green LED Chips, Blue LED Chips, Yellow LED Chips, Infrared LED Chips, White LED Chips, and Others) • By Application (Signs and Signal, Backlighting, Automotive, Illumination, and Others) |
Regional Analysis/Coverage | North America (US, Canada, Mexico), Europe (Eastern Europe [Poland, Romania, Hungary, Turkey, Rest of Eastern Europe] Western Europe] Germany, France, UK, Italy, Spain, Netherlands, Switzerland, Austria, Rest of Western Europe]), Asia Pacific (China, India, Japan, South Korea, Vietnam, Singapore, Australia, Rest of Asia Pacific), Middle East & Africa (Middle East [UAE, Egypt, Saudi Arabia, Qatar, Rest of Middle East], Africa [Nigeria, South Africa, Rest of Africa], Latin America (Brazil, Argentina, Colombia, Rest of Latin America) |
Company Profiles |
Bright LED Electronics Corporation, AVA Technologies, Inc., Bridgelux, Inc., Hitachi Cable, Ltd., Dowa Electronics Materials Co., Ltd., Optek Technology, Cree LED., Nichia Corporation, Epistar Corporation, Huga Optech, Inc., and other key players mentioned in the final report. |
Key Drivers | • Rise in demand for lighting drives LED Chip market. • LED Chip market is pushed by regulatory requirements. • Efficiency and policy drive a promising future for the LED chip market. |
RESTRAINTS | • Limitations in the LED Chip market • Dependency on rare earths poses a barrier to growth in the LED Chip market |
Ans. The Compound Annual Growth rate for LED Chip Market over the forecast period is 11.7%.
Ans. The projected market size for the LED Chip Market is USD 78.01 billion by 2032
Ans: Limitations in the LED Chip market & Dependency on rare earths poses a barrier to growth in the LED Chip market
Ans: The Blue LED Chip product demand will grow at a CAGR of about 8.6% during the forecast period.
Ans: The consumer Electronics and Automotive are the prominent sectors who used LED chips in large proportion.
Table of Content
1. Introduction
1.1 Market Definition
1.2 Scope (Inclusion and Exclusions)
1.3 Research Assumptions
2. Executive Summary
2.1 Market Overview
2.2 Regional Synopsis
2.3 Competitive Summary
3. Research Methodology
3.1 Top-Down Approach
3.2 Bottom-up Approach
3.3. Data Validation
3.4 Primary Interviews
4. Market Dynamics Impact Analysis
4.1 Market Driving Factors Analysis
4.1.2 Drivers
4.1.2 Restraints
4.1.3 Opportunities
4.1.4 Challenges
4.2 PESTLE Analysis
4.3 Porter’s Five Forces Model
5. Statistical Insights and Trends Reporting
5.1 Wafer Production Volumes, by Region (2023)
5.2 Chip Design Trends (Historic and Future)
5.3 Fab Capacity Utilization (2023)
5.4 Supply Chain Metrics
6. Competitive Landscape
6.1 List of Major Companies, By Region
6.2 Market Share Analysis, By Region
6.3 Product Benchmarking
6.3.1 Product specifications and features
6.3.2 Pricing
6.4 Strategic Initiatives
6.4.1 Marketing and promotional activities
6.4.2 Distribution and supply chain strategies
6.4.3 Expansion plans and new product launches
6.4.4 Strategic partnerships and collaborations
6.5 Technological Advancements
6.6 Market Positioning and Branding
7. LED Chip Market Segmentation, by Product
7.1 Chapter Overview
7.2 Red LED Chips
7.2.1 Red LED Chips Market Trends Analysis (2020-2032)
7.2.2 Red LED Chips Market Size Estimates and Forecasts to 2032 (USD Billion)
7.3 Green LED Chips
7.3.1 Green LED Chips Market Trends Analysis (2020-2032)
7.3.2 Green LED Chips Market Size Estimates and Forecasts to 2032 (USD Billion)
7.4 Blue LED Chips
7.4.1 Blue LED Chips Market Trends Analysis (2020-2032)
7.4.2 Blue LED Chips Market Size Estimates and Forecasts to 2032 (USD Billion)
7.5 Yellow LED Chips
7.5.1 Yellow LED Chips Market Trends Analysis (2020-2032)
7.5.2 Yellow LED Chips Market Size Estimates and Forecasts to 2032 (USD Billion)
7.6 Infrared LED Chips
7.6.1 Infrared LED Chips Market Trends Analysis (2020-2032)
7.6.2 Infrared LED Chips Market Size Estimates and Forecasts to 2032 (USD Billion)
7.6 White LED Chips
7.6.1 White LED Chips Market Trends Analysis (2020-2032)
7.6.2 White LED Chips Market Size Estimates and Forecasts to 2032 (USD Billion)
7.6 Others LED Chips
7.6.1 Others LED Chips Market Trends Analysis (2020-2032)
7.6.2 Others LED Chips Market Size Estimates and Forecasts to 2032 (USD Billion)
8. Led Chip Market Segmentation, by Application
8.1 Chapter Overview
8.2 Signs and Signal
8.2.1 Signs and Signal Market Trends Analysis (2020-2032)
8.2.2 Signs and Signal Market Size Estimates and Forecasts to 2032 (USD Billion)
8.3 Backlighting
8.3.1 Backlighting Market Trends Analysis (2020-2032)
8.3.2 Backlighting Market Size Estimates and Forecasts to 2032 (USD Billion)
8.4 Automotive
8.4.1 Automotive Market Trends Analysis (2020-2032)
8.4.2 Automotive Market Size Estimates and Forecasts to 2032 (USD Billion)
8.5 Illumination
8.5.1 Illumination Market Trends Analysis (2020-2032)
8.5.2 Illumination Market Size Estimates and Forecasts to 2032 (USD Billion)
8.6 Others
8.6.1 Others Market Trends Analysis (2020-2032)
8.6.2 Others Market Size Estimates and Forecasts to 2032 (USD Billion)
9. Regional Analysis
9.1 Chapter Overview
9.2 North America
9.2.1 Trends Analysis
9.2.2 North America Led Chip Market Estimates and Forecasts, by Country (2020-2032) (USD Billion)
9.2.3 North America Led Chip Market Estimates and Forecasts, by Product (2020-2032) (USD Billion)
9.2.4 North America Led Chip Market Estimates and Forecasts, by Application (2020-2032) (USD Billion)
9.2.5 USA
9.2.5.1 USA Led Chip Market Estimates and Forecasts, by Product (2020-2032) (USD Billion)
9.2.5.2 USA Led Chip Market Estimates and Forecasts, by Application (2020-2032) (USD Billion)
9.2.6 Canada
9.2.6.1 Canada Led Chip Market Estimates and Forecasts, by Product (2020-2032) (USD Billion)
9.2.6.2 Canada Led Chip Market Estimates and Forecasts, by Application (2020-2032) (USD Billion)
9.2.7 Mexico
9.2.7.1 Mexico Led Chip Market Estimates and Forecasts, by Product (2020-2032) (USD Billion)
9.2.7.2 Mexico Led Chip Market Estimates and Forecasts, by Application (2020-2032) (USD Billion)
9.3 Europe
9.3.1 Eastern Europe
9.3.1.1 Trends Analysis
9.3.1.2 Eastern Europe Led Chip Market Estimates and Forecasts, by Country (2020-2032) (USD Billion)
9.3.1.3 Eastern Europe Led Chip Market Estimates and Forecasts, by Product (2020-2032) (USD Billion)
9.3.1.4 Eastern Europe Led Chip Market Estimates and Forecasts, by Application (2020-2032) (USD Billion)
9.3.1.5 Poland
9.3.1.5.1 Poland Led Chip Market Estimates and Forecasts, by Product (2020-2032) (USD Billion)
9.3.1.5.2 Poland Led Chip Market Estimates and Forecasts, by Application (2020-2032) (USD Billion)
9.3.1.6 Romania
9.3.1.6.1 Romania Led Chip Market Estimates and Forecasts, by Product (2020-2032) (USD Billion)
9.3.1.6.2 Romania Led Chip Market Estimates and Forecasts, by Application (2020-2032) (USD Billion)
9.3.1.7 Hungary
9.3.1.7.1 Hungary Led Chip Market Estimates and Forecasts, by Product (2020-2032) (USD Billion)
9.3.1.7.2 Hungary Led Chip Market Estimates and Forecasts, by Application (2020-2032) (USD Billion)
9.3.1.8 Turkey
9.3.1.8.1 Turkey Led Chip Market Estimates and Forecasts, by Product (2020-2032) (USD Billion)
9.3.1.8.2 Turkey Led Chip Market Estimates and Forecasts, by Application (2020-2032) (USD Billion)
9.3.1.9 Rest of Eastern Europe
9.3.1.9.1 Rest of Eastern Europe Led Chip Market Estimates and Forecasts, by Product (2020-2032) (USD Billion)
9.3.1.9.2 Rest of Eastern Europe Led Chip Market Estimates and Forecasts, by Application (2020-2032) (USD Billion)
9.3.2 Western Europe
9.3.2.1 Trends Analysis
9.3.2.2 Western Europe Led Chip Market Estimates and Forecasts, by Country (2020-2032) (USD Billion)
9.3.2.3 Western Europe Led Chip Market Estimates and Forecasts, by Product (2020-2032) (USD Billion)
9.3.2.4 Western Europe Led Chip Market Estimates and Forecasts, by Application (2020-2032) (USD Billion)
9.3.2.5 Germany
9.3.2.5.1 Germany Led Chip Market Estimates and Forecasts, by Product (2020-2032) (USD Billion)
9.3.2.5.2 Germany Led Chip Market Estimates and Forecasts, by Application (2020-2032) (USD Billion)
9.3.2.6 France
9.3.2.6.1 France Led Chip Market Estimates and Forecasts, by Product (2020-2032) (USD Billion)
9.3.2.6.2 France Led Chip Market Estimates and Forecasts, by Application (2020-2032) (USD Billion)
9.3.2.7 UK
9.3.2.7.1 UK Led Chip Market Estimates and Forecasts, by Product (2020-2032) (USD Billion)
9.3.2.7.2 UK Led Chip Market Estimates and Forecasts, by Application (2020-2032) (USD Billion)
9.3.2.8 Italy
9.3.2.8.1 Italy Led Chip Market Estimates and Forecasts, by Product (2020-2032) (USD Billion)
9.3.2.8.2 Italy Led Chip Market Estimates and Forecasts, by Application (2020-2032) (USD Billion)
9.3.2.9 Spain
9.3.2.9.1 Spain Led Chip Market Estimates and Forecasts, by Product (2020-2032) (USD Billion)
9.3.2.9.2 Spain Led Chip Market Estimates and Forecasts, by Application (2020-2032) (USD Billion)
9.3.2.10 Netherlands
9.3.2.10.1 Netherlands Led Chip Market Estimates and Forecasts, by Product (2020-2032) (USD Billion)
9.3.2.10.2 Netherlands Led Chip Market Estimates and Forecasts, by Application (2020-2032) (USD Billion)
9.3.2.11 Switzerland
9.3.2.11.1 Switzerland Led Chip Market Estimates and Forecasts, by Product (2020-2032) (USD Billion)
9.3.2.11.2 Switzerland Led Chip Market Estimates and Forecasts, by Application (2020-2032) (USD Billion)
9.3.2.12 Austria
9.3.2.12.1 Austria Led Chip Market Estimates and Forecasts, by Product (2020-2032) (USD Billion)
9.3.2.12.2 Austria Led Chip Market Estimates and Forecasts, by Application (2020-2032) (USD Billion)
9.3.2.13 Rest of Western Europe
9.3.2.13.1 Rest of Western Europe Led Chip Market Estimates and Forecasts, by Product (2020-2032) (USD Billion)
9.3.2.13.2 Rest of Western Europe Led Chip Market Estimates and Forecasts, by Application (2020-2032) (USD Billion)
9.4 Asia Pacific
9.4.1 Trends Analysis
9.4.2 Asia Pacific Led Chip Market Estimates and Forecasts, by Country (2020-2032) (USD Billion)
9.4.3 Asia Pacific Led Chip Market Estimates and Forecasts, by Product (2020-2032) (USD Billion)
9.4.4 Asia Pacific Led Chip Market Estimates and Forecasts, by Application (2020-2032) (USD Billion)
9.4.5 China
9.4.5.1 China Led Chip Market Estimates and Forecasts, by Product (2020-2032) (USD Billion)
9.4.5.2 China Led Chip Market Estimates and Forecasts, by Application (2020-2032) (USD Billion)
9.4.6 India
9.4.5.1 India Led Chip Market Estimates and Forecasts, by Product (2020-2032) (USD Billion)
9.4.5.2 India Led Chip Market Estimates and Forecasts, by Application (2020-2032) (USD Billion)
9.4.5 Japan
9.4.5.1 Japan Led Chip Market Estimates and Forecasts, by Product (2020-2032) (USD Billion)
9.4.5.2 Japan Led Chip Market Estimates and Forecasts, by Application (2020-2032) (USD Billion)
9.4.6 South Korea
9.4.6.1 South Korea Led Chip Market Estimates and Forecasts, by Product (2020-2032) (USD Billion)
9.4.6.2 South Korea Led Chip Market Estimates and Forecasts, by Application (2020-2032) (USD Billion)
9.4.7 Vietnam
9.4.7.1 Vietnam Led Chip Market Estimates and Forecasts, by Product (2020-2032) (USD Billion)
9.2.7.2 Vietnam Led Chip Market Estimates and Forecasts, by Application (2020-2032) (USD Billion)
9.4.8 Singapore
9.4.8.1 Singapore Led Chip Market Estimates and Forecasts, by Product (2020-2032) (USD Billion)
9.4.8.2 Singapore Led Chip Market Estimates and Forecasts, by Application (2020-2032) (USD Billion)
9.4.9 Australia
9.4.9.1 Australia Led Chip Market Estimates and Forecasts, by Product (2020-2032) (USD Billion)
9.4.9.2 Australia Led Chip Market Estimates and Forecasts, by Application (2020-2032) (USD Billion)
9.4.10 Rest of Asia Pacific
9.4.10.1 Rest of Asia Pacific Led Chip Market Estimates and Forecasts, by Product (2020-2032) (USD Billion)
9.4.10.2 Rest of Asia Pacific Led Chip Market Estimates and Forecasts, by Application (2020-2032) (USD Billion)
9.5 Middle East and Africa
9.5.1 Middle East
9.5.1.1 Trends Analysis
9.5.1.2 Middle East Led Chip Market Estimates and Forecasts, by Country (2020-2032) (USD Billion)
9.5.1.3 Middle East Led Chip Market Estimates and Forecasts, by Product (2020-2032) (USD Billion)
9.5.1.4 Middle East Led Chip Market Estimates and Forecasts, by Application (2020-2032) (USD Billion)
9.5.1.5 UAE
9.5.1.5.1 UAE Led Chip Market Estimates and Forecasts, by Product (2020-2032) (USD Billion)
9.5.1.5.2 UAE Led Chip Market Estimates and Forecasts, by Application (2020-2032) (USD Billion)
9.5.1.6 Egypt
9.5.1.6.1 Egypt Led Chip Market Estimates and Forecasts, by Product (2020-2032) (USD Billion)
9.5.1.6.2 Egypt Led Chip Market Estimates and Forecasts, by Application (2020-2032) (USD Billion)
9.5.1.7 Saudi Arabia
9.5.1.7.1 Saudi Arabia Led Chip Market Estimates and Forecasts, by Product (2020-2032) (USD Billion)
9.5.1.7.2 Saudi Arabia Led Chip Market Estimates and Forecasts, by Application (2020-2032) (USD Billion)
9.5.1.8 Qatar
9.5.1.8.1 Qatar Led Chip Market Estimates and Forecasts, by Product (2020-2032) (USD Billion)
9.5.1.8.2 Qatar Led Chip Market Estimates and Forecasts, by Application (2020-2032) (USD Billion)
9.5.1.9 Rest of Middle East
9.5.1.9.1 Rest of Middle East Led Chip Market Estimates and Forecasts, by Product (2020-2032) (USD Billion)
9.5.1.9.2 Rest of Middle East Led Chip Market Estimates and Forecasts, by Application (2020-2032) (USD Billion)
9.5.2 Africa
9.5.2.1 Trends Analysis
9.5.2.2 Africa Led Chip Market Estimates and Forecasts, by Country (2020-2032) (USD Billion)
9.5.2.3 Africa Led Chip Market Estimates and Forecasts, by Product (2020-2032) (USD Billion)
9.5.2.4 Africa Led Chip Market Estimates and Forecasts, by Application (2020-2032) (USD Billion)
9.5.2.5 South Africa
9.5.2.5.1 South Africa Led Chip Market Estimates and Forecasts, by Product (2020-2032) (USD Billion)
9.5.2.5.2 South Africa Led Chip Market Estimates and Forecasts, by Application (2020-2032) (USD Billion)
9.5.2.6 Nigeria
9.5.2.6.1 Nigeria Led Chip Market Estimates and Forecasts, by Product (2020-2032) (USD Billion)
9.5.2.6.2 Nigeria Led Chip Market Estimates and Forecasts, by Application (2020-2032) (USD Billion)
9.5.2.7 Rest of Africa
9.5.2.7.1 Rest of Africa Led Chip Market Estimates and Forecasts, by Product (2020-2032) (USD Billion)
9.5.2.7.2 Rest of Africa Led Chip Market Estimates and Forecasts, by Application (2020-2032) (USD Billion)
9.6 Latin America
9.6.1 Trends Analysis
9.6.2 Latin America Led Chip Market Estimates and Forecasts, by Country (2020-2032) (USD Billion)
9.6.3 Latin America Led Chip Market Estimates and Forecasts, by Product (2020-2032) (USD Billion)
9.6.4 Latin America Led Chip Market Estimates and Forecasts, by Application (2020-2032) (USD Billion)
9.6.5 Brazil
9.6.5.1 Brazil Led Chip Market Estimates and Forecasts, by Product (2020-2032) (USD Billion)
9.6.5.2 Brazil Led Chip Market Estimates and Forecasts, by Application (2020-2032) (USD Billion)
9.6.6 Argentina
9.6.6.1 Argentina Led Chip Market Estimates and Forecasts, by Product (2020-2032) (USD Billion)
9.6.6.2 Argentina Led Chip Market Estimates and Forecasts, by Application (2020-2032) (USD Billion)
9.6.7 Colombia
9.6.7.1 Colombia Led Chip Market Estimates and Forecasts, by Product (2020-2032) (USD Billion)
9.6.7.2 Colombia Led Chip Market Estimates and Forecasts, by Application (2020-2032) (USD Billion)
9.6.8 Rest of Latin America
9.6.8.1 Rest of Latin America Led Chip Market Estimates and Forecasts, by Product (2020-2032) (USD Billion)
9.6.8.2 Rest of Latin America Led Chip Market Estimates and Forecasts, by Application (2020-2032) (USD Billion)
10. Company Profiles
10.1 Bright LED Electronics Corporation
10.1.1 Company Overview
10.1.2 Financial
10.1.3 Products/ Services Offered
10.1.4 SWOT Analysis
10.2 AVA Technologies
10.2.1 Company Overview
10.2.2 Financial
10.2.3 Products/ Services Offered
10.2.4 SWOT Analysis
10.3 Bridgelux, Inc.
10.3.1 Company Overview
10.3.2 Financial
10.3.3 Products/ Services Offered
10.3.4 SWOT Analysis
10.4 Hitachi Cable, Ltd.
10.4.1 Company Overview
10.4.2 Financial
10.4.3 Products/ Services Offered
10.4.4 SWOT Analysis
10.5 Dowa Electronics Materials Co., Ltd.
10.5.1 Company Overview
10.5.2 Financial
10.5.3 Products/ Services Offered
10.5.4 SWOT Analysis
10.6 Optek Technology
10.6.1 Company Overview
10.6.2 Financial
10.6.3 Products/ Services Offered
10.6.4 SWOT Analysis
10.7 Cree LED
10.7.1 Company Overview
10.7.2 Financial
10.7.3 Products/ Services Offered
10.7.4 SWOT Analysis
10.8 Nichia Corporation
10.8.1 Company Overview
10.8.2 Financial
10.8.3 Products/ Services Offered
10.8.4 SWOT Analysis
10.9 Epistar Corporation
10.9.1 Company Overview
10.9.2 Financial
10.9.3 Products/ Services Offered
10.9.4 SWOT Analysis
10.10 Huga Optech, Inc.
10.9.1 Company Overview
10.9.2 Financial
10.9.3 Products/ Services Offered
10.9.4 SWOT Analysis
11. Use Cases and Best Practices
12. Conclusion
An accurate research report requires proper strategizing as well as implementation. There are multiple factors involved in the completion of good and accurate research report and selecting the best methodology to compete the research is the toughest part. Since the research reports we provide play a crucial role in any company’s decision-making process, therefore we at SNS Insider always believe that we should choose the best method which gives us results closer to reality. This allows us to reach at a stage wherein we can provide our clients best and accurate investment to output ratio.
Each report that we prepare takes a timeframe of 350-400 business hours for production. Starting from the selection of titles through a couple of in-depth brain storming session to the final QC process before uploading our titles on our website we dedicate around 350 working hours. The titles are selected based on their current market cap and the foreseen CAGR and growth.
The 5 steps process:
Step 1: Secondary Research:
Secondary Research or Desk Research is as the name suggests is a research process wherein, we collect data through the readily available information. In this process we use various paid and unpaid databases which our team has access to and gather data through the same. This includes examining of listed companies’ annual reports, Journals, SEC filling etc. Apart from this our team has access to various associations across the globe across different industries. Lastly, we have exchange relationships with various university as well as individual libraries.
Step 2: Primary Research
When we talk about primary research, it is a type of study in which the researchers collect relevant data samples directly, rather than relying on previously collected data. This type of research is focused on gaining content specific facts that can be sued to solve specific problems. Since the collected data is fresh and first hand therefore it makes the study more accurate and genuine.
We at SNS Insider have divided Primary Research into 2 parts.
Part 1 wherein we interview the KOLs of major players as well as the upcoming ones across various geographic regions. This allows us to have their view over the market scenario and acts as an important tool to come closer to the accurate market numbers. As many as 45 paid and unpaid primary interviews are taken from both the demand and supply side of the industry to make sure we land at an accurate judgement and analysis of the market.
This step involves the triangulation of data wherein our team analyses the interview transcripts, online survey responses and observation of on filed participants. The below mentioned chart should give a better understanding of the part 1 of the primary interview.
Part 2: In this part of primary research the data collected via secondary research and the part 1 of the primary research is validated with the interviews from individual consultants and subject matter experts.
Consultants are those set of people who have at least 12 years of experience and expertise within the industry whereas Subject Matter Experts are those with at least 15 years of experience behind their back within the same space. The data with the help of two main processes i.e., FGDs (Focused Group Discussions) and IDs (Individual Discussions). This gives us a 3rd party nonbiased primary view of the market scenario making it a more dependable one while collation of the data pointers.
Step 3: Data Bank Validation
Once all the information is collected via primary and secondary sources, we run that information for data validation. At our intelligence centre our research heads track a lot of information related to the market which includes the quarterly reports, the daily stock prices, and other relevant information. Our data bank server gets updated every fortnight and that is how the information which we collected using our primary and secondary information is revalidated in real time.
Step 4: QA/QC Process
After all the data collection and validation our team does a final level of quality check and quality assurance to get rid of any unwanted or undesired mistakes. This might include but not limited to getting rid of the any typos, duplication of numbers or missing of any important information. The people involved in this process include technical content writers, research heads and graphics people. Once this process is completed the title gets uploader on our platform for our clients to read it.
Step 5: Final QC/QA Process:
This is the last process and comes when the client has ordered the study. In this process a final QA/QC is done before the study is emailed to the client. Since we believe in giving our clients a good experience of our research studies, therefore, to make sure that we do not lack at our end in any way humanly possible we do a final round of quality check and then dispatch the study to the client.
Key Segments:
By Product
Red LED Chips
Green LED Chips
Blue LED Chips
Yellow LED Chips
Infrared LED Chips
White LED Chips
Others
By Application
Signs and Signal
Backlighting
Automotive
Illumination
Others
Request for Segment Customization as per your Business Requirement: Segment Customization Request
REGIONAL COVERAGE:
North America
US
Canada
Mexico
Europe
Eastern Europe
Poland
Romania
Hungary
Turkey
Rest of Eastern Europe
Western Europe
Germany
France
UK
Italy
Spain
Netherlands
Switzerland
Austria
Rest of Western Europe
Asia Pacific
China
India
Japan
South Korea
Vietnam
Singapore
Australia
Rest of Asia Pacific
Middle East & Africa
Middle East
UAE
Egypt
Saudi Arabia
Qatar
Rest of the Middle East
Africa
Nigeria
South Africa
Rest of Africa
Latin America
Brazil
Argentina
Colombia
Request for Country Level Research Report: Country Level Customization Request
Available Customization
With the given market data, SNS Insider offers customization as per the company’s specific needs. The following customization options are available for the report:
Product Analysis
Criss-Cross segment analysis (e.g. Product X Application)
Product Matrix which gives a detailed comparison of product portfolio of each company
Geographic Analysis
Additional countries in any of the regions
Company Information
Detailed analysis and profiling of additional market players (Up to five)
The Submarine Cable Systems Market Size was valued at USD 27.02 billion in 2022 and is expected to reach USD 43.73 billion by 2030, growing at a CAGR of 6.2% over the forecast period 2023-2030.
The Battery-free Sensors Market Size was valued at USD 40.8 Million in 2023 and will reach $291.02 Million by 2031 and grow at a CAGR of 27.8% by 2024-2031
The Automated Optical Inspection Market Size was valued at USD 942.3 million in 2023 and is expected to reach USD 5085.28 million by 2032 and grow at a CAGR of 20.6% over the forecast period 2024-2032.
The Embedded Antenna Systems Market Size was valued at USD 3.32 billion in 2023 and is expected to reach USD 10.97 billion by 2032, growing at a CAGR of 14.2% over the forecast period 2024-2032.
The Wide Bandgap Semiconductor Market size was valued at USD 1.2 billion in 2022 and is expected to grow to USD 7.01 billion by 2030 and grow at a CAGR of 24.7% over the forecast period of 2023-2030
The Thyristor Protectors Market size was Valued at USD 0.7 billion in 2023 and is estimated to Reach USD 1.006 billion by 2032 and grow at a CAGR of 4.11% over the forecast period of 2024-2032.
Hi! Click one of our member below to chat on Phone