Human Augmentation Market Size & Trends:
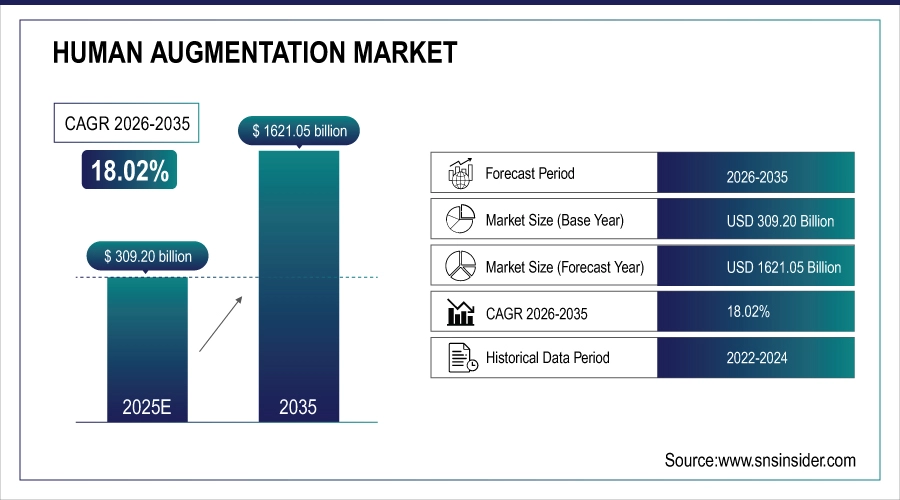
The Human Augmentation Market Size was valued at USD 309.20 Billion in 2025, It is estimated to grow at 18.02% CAGR to reach USD 1621.05 Billion by 2035.
The Human Augmentation Market is rapidly emerging as a transformative force across various industries, driven by advancements in technology that are expanding the boundaries of human potential. This market encompasses a wide range of applications, from enhancing physical abilities to cognitive functions, by integrating human capabilities with cutting-edge technologies. Technologies like prosthetics and exoskeletons are revolutionizing patient rehabilitation, offering new hope to individuals with mobility impairments.
For instance, robotic exoskeletons are enabling paraplegic patients to walk again, providing not just physical benefits but also psychological upliftment. Wearable devices that monitor vital signs in real time are becoming increasingly sophisticated, allowing for more personalized and proactive healthcare management.
Market Size and Growth Projection:
-
Market Size in 2025 USD 309.20 Billion
-
Market Size by 2035 USD 1621.05 Billion
-
CAGR of 18.02% From 2026 to 2033
-
Base Year 2025
-
Forecast Period 2026-2035
-
Historical Data 2022-2024
Get More Information on Human Augmentation Market - Request Sample Report
Human Augmentation Market Trends Highlights:
-
Adoption of wearable augmentation devices is rising, growing at ~18% CAGR across healthcare and industry.
-
Investment in BCI and neuroprosthetics is increasing, with research funding up 25%+ annually for rehabilitation use.
-
Use of AR/VR augmentation in training and defense is expanding, with 40%+ of industrial programs integrating AR tools.
-
Demand for bionic limbs and smart implants is growing, with prosthetics adoption up ~30% in advanced healthcare markets.
-
AI and biosensor integration is advancing, with 55%+ of new devices enabling real-time, cloud-based analytics.
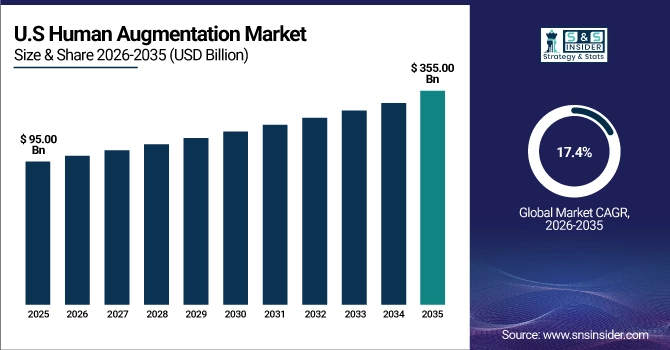
U.S. Human Augmentation Market Size Outlook
The U.S. Human Augmentation market size was valued at an estimated USD 95.00 billion in 2025 and is projected to reach USD 355.00 billion by 2035, growing at a CAGR of 17.4% over the forecast period 2026–2035. Market growth is driven by increasing adoption of wearable devices, exoskeletons, and neurotechnology across healthcare, defense, industrial, and consumer applications. Rising demand for enhanced physical and cognitive capabilities, rehabilitation solutions, and workforce productivity improvements is accelerating market expansion. Additionally, advancements in robotics, artificial intelligence, human-machine interfaces, and sensor technologies, along with growing investments from key technology providers, further strengthen the growth outlook of the U.S. human augmentation market during the forecast period.
Human Augmentation Market Growth Drivers:
-
Integrating VR/AR, robotics, and AI creates a demand for human augmentation possibilities.
Virtual Reality and Augmented Reality, robotics, and Artificial Intelligence are together revolutionizing the Human Augmentation Market. These technologies, when integrated, expanded the horizons of possible ways to augment human capabilities. In the case of visual and interactive technologies such as VR and AR, these are mostly other systems that are created thanks to the synergy of the three technologies. For example, VR or AR training or simulation systems give the possibility to have an immersive experience that is known to be highly effective in learning or practicing new abilities. AI can personalize the experience and, as a result, make the learning curve faster and produce more proficient specialists. These technologies are used in medicine, the military, and education where they can augment any human sense as well as cognition and physical capabilities. These devices are becoming more flexible and intelligent and can perform more and more tasks that are impossible or very hard for human beings to perform. AI seems to be the most appropriate technology to analyze and find patterns in large amounts of data which is vital in medicine, where human augmentation is used to analyze biological data, predict and prevent the appearance of diseases in early stages, and regulate and control body functions.
Human Augmentation Market Restraints:
-
The ethical implications of human augmentation need careful consideration.
Ethical implications of human augmentation are likely to be among the most serious challenges that might potentially encourage the development of the human augmentation market. As long as technologies such as wearable devices, implants, and genetic modifications are becoming increasingly sophisticated, they cannot but raise controversial issues associated with such aspects as humanity, fairness, and social inequality. One can argue that the potential rise of the phenomenon in the form of a new type of inequality between the augmented and the un-augmented might be a major concern. As a result, those who can afford and decide to implement various enhancements into their body and mind may enjoy a range of advantages related to health, intellect, and physical functioning.
Human Augmentation Market Segment Analysis:
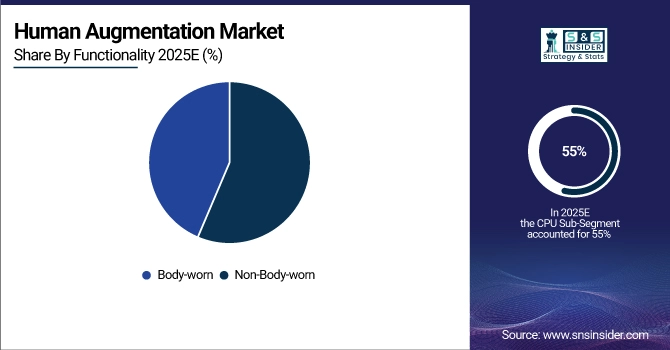
By Functionality
The body-worn segment led the market with a major market share of over 55% in 2025. The widespread convergence of fields such as AI, neuroscience, robotics, and others is creating new opportunities for better, more advanced, and integrated human augmentation solutions. Precisely, customers are now increasingly interested in self-improvement, health optimization, performance enhancement, and other processes, which are driving demand for the given segment. Furthermore, many existing augmentation equipment devices are now increasingly being integrated with more advanced health trackers, and biosensors that enable users to have real-time access to data about their vitals, sleep patterns, physical activity levels, and many others.
The non-body-worn segment is likely to grow at a faster CAGR during the forecast period 2026-2035. Overall, the primary difference between body-worn and non-body-worn human augmentation products is the fact that the latter enhances human capabilities without the use of wearables or other types of devices that are either worn or implemented inside of a given person’s body. In the realm of Neuroscience, the high level of attention to non-invasive ways of integration with various technologies and systems is expected to foster the development of advanced systems that allow the use of BCIs, for example, without actual physical implants.
By Product
The wearable devices segment held the major market share of over 35% in 2025. The rise in using wearable equipment for monitoring health and fitness measurements is one of the major factors that contributes to market growth. Additionally, the development of low-frequency low-performance ICs and sophisticated sensor technology has enabled producing cheap wearable devices for virtually any customer use. Various forms of sensors may be installed in wearable equipment such as clothes, hats, wristbands, socks, shoes, glasses, and wristwatches for the monitoring of continuous health.
Human biometric system is accounted to have the fastest growth rate during the forecast period. The demand for strong authentication and confirmation methods increases as security issues have been increasing throughout the finance, healthcare, and public administration industries. Biometric systems provide secure and trustworthy ways to authenticate and confirm an individual’s identity. The increasingly accurate, easy-to-use, and affordable systems for biometric technology, including robust face recognition and fingerprint or iris scanning, have improved, obtaining improved use in a wide range of applications.
By Technology
The AI Integration segment captured a market share of 42% in 2025 and dominated the market. AI can examine data generated by sensors in augmentation products, customize configurations, and enhance performance immediately. For instance, an exoskeleton can adjust the amount of power it generates according to how much the wearer is exerting, while a prosthetic limb can study the user's movement habits to provide a more authentic experience. In addition, AI can examine data from both body sensors and environmental conditions to offer instant suggestions and implement necessary measures.
The biohacking & bio-augmentation segment is going to be the fastest-growing during the forecast period. Biohacking often employs low-cost, readily available tools that are more accessible than advanced medical-grade bio-augmentation technologies. Additionally, medical advancement is rapidly developing new tools for treating diseases, restoring lost functions, and augmenting people in well-researched and tested ways, such as gene editing, tissue engineering, and implantable devices.
Human Augmentation Market Regional Analysis:
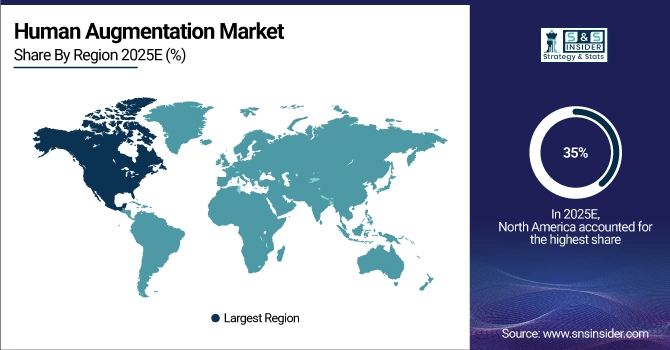
North America Human Augmentation Market Insights
North America dominated the market in 2025 with a market share of over 35%. Human augmentation industry growth is supported by the rapid development of artificial intelligence technology. Technological advances, as well as the rising demand for platforms that can measure system performance in all specific business segments found in the region, support the growing demand for the human augmentation market.
Get Customized Report as per your Business Requirement - Request For Customized Report
Asia Pacific Human Augmentation Market Insights
Asia Pacific is going to be the fastest-growing region during 2026-2035. The region covers countries such as China, Japan, and South Korea, which are known for their rapid technological development. China and Japan also invest in research and development. Healthcare services have seen an increase in demand in the Asia Pacific. As a result, several supplements, wearable medical devices, and surgical robotics have been developed. These have all contributed to growth in the human augmentation market.
Europe Human Augmentation Market Insights
The European human augmentation market is growing steadily, driven by increased adoption of AR/VR, robotics, and AI technologies in healthcare, defense, and industrial applications. Governments and private institutions are investing in research and development to enhance workforce efficiency and improve patient outcomes. Rising demand for immersive training, rehabilitation solutions, and wearable devices further fuels market expansion across the region.
Latin America (LATAM) and Middle East & Africa (MEA) Human Augmentation Market Insights
The LATAM and MEA human augmentation markets are witnessing growth due to rising adoption of wearable robotics, AR/VR systems, and AI-driven solutions in healthcare, defense, and industrial sectors. Increasing government initiatives, funding for technological advancements, and awareness of human augmentation benefits are driving adoption. Demand for rehabilitation, mobility assistance, and immersive training solutions is expected to further propel market growth.
Human Augmentation Companies are:
-
Samsung Electronics (South Korea) – Smart wearable devices (Galaxy Watch, AR/VR headsets)
-
Google LLC (USA) – Google Glass (AR smart glasses), AI-powered virtual assistants
-
Ekso Bionics (USA) – Exoskeletons for mobility assistance and rehabilitation
-
Vuzix Corporation (USA) – AR smart glasses (Vuzix Blade, Vuzix Shield)
-
Garmin Ltd. (Switzerland) – Smart wearables (Garmin fitness trackers, aviation head-up displays)
-
Fossil Group, Inc. (USA) – Smartwatches with biometric tracking features
-
B-Temia Inc. (Canada) – Dermoskeleton™ mobility assistive exoskeletons
-
Casio (Japan) – Wearable fitness and smartwatches with biometric sensors
-
Magic Leap (USA) – AR headsets for enhanced human-computer interaction
-
ReWalk Robotics (Israel) – Wearable robotic exoskeletons for paraplegic individuals
-
Cyberdyne Inc. (Japan) – Hybrid Assistive Limb (HAL) exoskeleton for rehabilitation
Competitive Landscape for Human Augmentation Market:
Neuralink is at the forefront of the human augmentation market, developing advanced brain-machine interface (BMI) technologies to enhance cognitive and physical capabilities. The company focuses on creating implantable neural devices that enable direct communication between the brain and external devices. Neuralink’s innovations aim to revolutionize healthcare, assist individuals with neurological disorders, and expand possibilities in human-computer interaction.
-
In July 2024, Neuralink unveiled its N1 brain implant designed to enable direct communication between the human brain and computers. The device aims to enhance cognitive abilities and assist individuals with neurological disorders.
Cochlear is a leading company in the human augmentation market, specializing in implantable hearing solutions that restore and enhance auditory capabilities. Its innovative cochlear implant systems help individuals with hearing loss perceive sound, improving communication and quality of life. Cochlear continues to advance technology integration, supporting personalized hearing experiences and contributing to the broader adoption of neural and sensory augmentation solutions.
-
In June 2024, Cochlear Limited introduced the Nucleus Profile Plus Series, an advanced cochlear implant system featuring improved sound processing and connectivity options for better hearing experiences.
| Report Attributes | Details |
|---|---|
| Market Size in 2025 | USD 309.20 Billion |
| Market Size by 2035 | USD 1621.05 Billion |
| CAGR | CAGR of 18.02% From 2026 to 2035 |
| Base Year | 2025 |
| Forecast Period | 2026-2035 |
| Historical Data | 2022-2024 |
| Report Scope & Coverage | Market Size, Segments Analysis, Competitive Landscape, Regional Analysis, DROC & SWOT Analysis, Forecast Outlook |
| Key Segments | • By Product (Wearable Devices, Virtual Reality Devices, Augmented Reality Devices, Exoskeletons, Biometric Systems, Intelligent Virtual Assistants) • By Functionality (Body-worn, Non-Body-worn, Modulators) • By Technology (Artificial Intelligence (AI) Integration, Quantum Computing Augmentation, Biohacking, and Bio-Augmentation) • By End User (Consumer, Commercial, Medical, Aerospace & Defense, Industrial, Others) |
| Regional Analysis/Coverage | North America (US, Canada), Europe (Germany, UK, France, Italy, Spain, Russia, Poland, Rest of Europe), Asia Pacific (China, India, Japan, South Korea, Australia, ASEAN Countries, Rest of Asia Pacific), Middle East & Africa (UAE, Saudi Arabia, Qatar, South Africa, Rest of Middle East & Africa), Latin America (Brazil, Argentina, Mexico, Colombia, Rest of Latin America). |
| Company Profiles | Samsung Electronics, Google LLC, Ekso Bionics, Vuzix Corporation, Garmin Ltd, Fossil Group, Inc., B-Temia Inc., Casio, Magic Leap, ReWalk Robotics, Cyberdyne Inc. |
Get in Touch
