Legal Cannabis Market Report Scope & Overview:
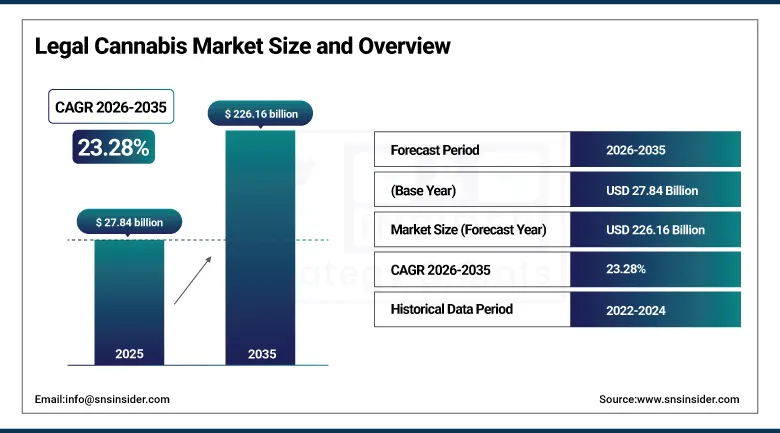
The Legal Cannabis Market was valued at USD 27.84 Billion in 2025 and is expected to reach USD 226.16 Billion by 2035, growing at a CAGR of 23.28% from 2026 to 2035.
Few industries have undergone as dramatic a transformation in such a compressed timeframe as legal cannabis. What was an entirely prohibited substance in most of the world just fifteen years ago has become a regulated commercial market spanning cultivation, manufacturing, retail, and pharmaceutical channels across dozens of jurisdictions. The shift has been driven by a combination of factors that are self-reinforcing: mounting clinical evidence supporting therapeutic applications, growing public comfort with cannabis as both a wellness product and an adult-use option, and government recognition that regulated markets generate tax revenue, create jobs, and reduce the social costs of prohibition. North America established the commercial blueprint, with Canada's federal legalization in 2018 and the progressive state-by-state expansion of adult-use programs in the United States creating the infrastructure, talent, and investor base that the global industry is now drawing from as legalization spreads to Europe, Latin America, and parts of Asia Pacific.
Germany's 2024 partial legalization and the progressive liberalization of cannabis policy across the Netherlands, Czech Republic, Malta, and Luxembourg signal that Europe is moving from isolated medical programs toward more comprehensive regulated frameworks that will add very substantial new legal market volume through the forecast period. Combined with the ongoing maturation of North American markets and the emerging legalization wave in Latin America and select Asia Pacific jurisdictions, the structural growth trajectory for the global legal cannabis market is among the most compelling of any consumer goods category through 2035.
Market Size and Forecast:
-
Market Size in 2025: USD 27.84 Billion
-
Market Size by 2035: USD 226.16 Billion
-
CAGR: 23.28% from 2026 to 2035
-
Base Year: 2025
-
Forecast Period: 2026 to 2035
-
Historical Data: 2022 to 2024
To Get more information on Legal Cannabis Market - Request Free Sample Report
Legal Cannabis Market Trends
-
Fast growth of the edible cannabis sector and cannabis beverages as consumer packaged goods, with food & beverages companies as well as alcohol brands entering the market through acquisitions, licensing, and developing their own cannabis products for wellness-focused adult consumers.
-
Increasing interest from the pharmaceutical industry in cannabis-based medicines outside of the existing CBD pathway, as the clinical research on minor cannabinoids such as CBG, CBN, CBC, and THCV uncovers new medical uses in neurology, oncology, and metabolism.
-
Increasing use of precision agriculture technologies such as AI-based growing systems, automatic fertigation, and optimizing the light spectrum to enhance cannabinoid consistency and yield efficiency while bridging the cost difference per gram between indoor and outdoor growing.
-
The progressive destigmatization of cannabis consumption leading to first-time usage of cannabis by previously unengaged demographic groups, especially adults over 50 years old suffering from chronic pain, insomnia, and anxiety as the fastest growing new consumer segment.
-
Consumer preference for lab-tested and branded cannabis products over unbranded dispensary products, driving further premiumization of the cannabis retail experience and encouraging operators who focus on the quality of their products and packaging.
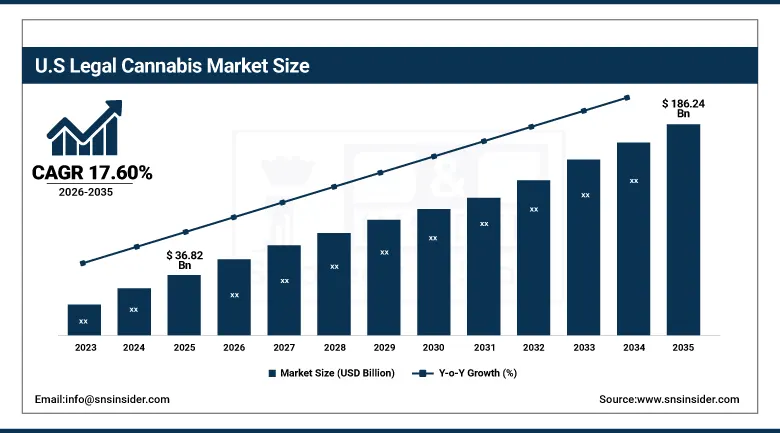
U.S. Legal Cannabis Market was valued at USD 36.82 Billion in 2025 and is expected to reach USD 186.24 Billion by 2035, registering a CAGR of 17.60% during 2026 to 2035.
The United States is by a considerable distance the world's largest legal cannabis market, combining the commercial scale of the world's wealthiest consumer economy with an active patchwork of state-level legalization programs that now cover the majority of the U.S. population. Over 40 states have established some form of legal cannabis framework, with adult-use programs generating the bulk of commercial revenue in leading markets including California, Colorado, Illinois, Michigan, New York, and Massachusetts. The American market is distinguished by its product innovation intensity, competitive retail sophistication, and the depth of capital available to fund cultivation expansion, brand building, and technology integration across every segment of the cannabis value chain.
The rescheduling process has become an integral part of cannabis policy discussions in the United States, where the DEA’s decision on the classification of cannabis has attracted considerable attention among investors and cannabis companies. Any step toward a classification in Schedule III and below would create a favorable operational environment for cannabis firms by addressing the Section 280E problem that does not allow cannabis firms to deduct their regular expenses, thereby opening up the possibility of hundreds of millions of dollars’ worth of savings for the cannabis industry. A combination of the expansion of state programs and the prospect of federal reforms continues to drive investment interest in the cannabis industry in the United States despite price pressures and industry maturity challenges faced by public cannabis companies.
Legal Cannabis Market Segment Insights
-
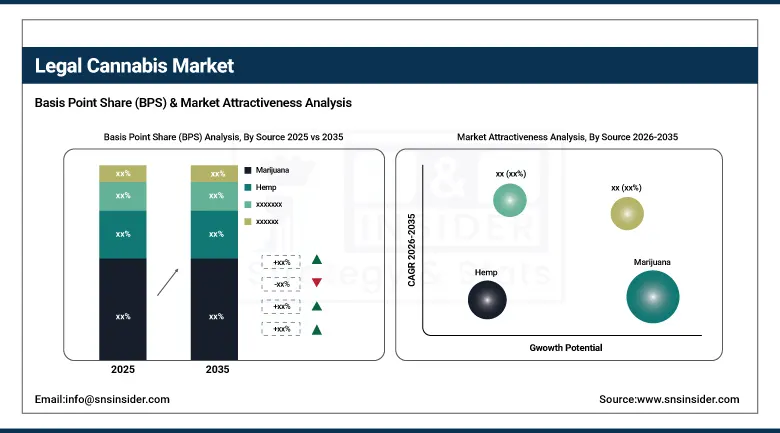
Based on Source, Marijuana accounted for the largest market share of 76.4% in 2025; Hemp segment is expected to be the fastest growing source through the forecast period.
-
Based on Product Type, Flowers and Buds accounted for the largest market share in 2025; Edibles segment is expected to record the fastest growth through the forecast period.
-
Based on Compound, CBD accounted for the largest market share in 2025; THC segment is expected to be the fastest growing compound segment through 2035.
-
Based on Application, Medical Use accounted for the largest market share in 2025; Recreational Use is expected to be the fastest growing application through the forecast period.
-
Based on Distribution Channel, Pharmacies and Dispensaries accounted for the largest market share in 2025; Online Retail is expected to be the fastest growing channel through 2035.
Legal Cannabis Market Segment Analysis
By Source, Marijuana dominates, Hemp expected to grow fastest
Marijuana retained the dominant source segment position with approximately 76.4% of global market revenue in 2025, driven by its central role across both licensed medical cannabis programs and adult-use retail markets in North America and the growing number of European jurisdictions with regulated access frameworks. Marijuana-derived products command premium retail pricing relative to hemp-derived alternatives, and their broader range of cannabinoid profiles including varied THC concentrations, terpene combinations, and cultivar-specific effects create the product differentiation that drives consumer loyalty and repeat purchase behavior in mature markets. The continuous expansion of legal dispensary infrastructure across U.S. states, combined with the growing availability of refined marijuana-derived concentrates, vaporizer cartridges, and extract-based products in multiple consumption formats, is sustaining marijuana's revenue leadership across all developed cannabis markets.
The hemp segment is projected to record the fastest growth rate through 2035, propelled by the rapidly expanding global demand for CBD-enriched wellness and health products that are accessible without the regulatory restrictions governing marijuana-derived goods. Hemp-derived CBD products occupy a unique commercial position: they provide therapeutic and wellness benefit without psychoactive effect, they can be sold through conventional retail channels including pharmacies, health food stores, and online platforms in many jurisdictions where marijuana remains restricted, and they benefit from the progressive global normalization of cannabinoid-based wellness products among mainstream consumers who are not necessarily cannabis users. The growing body of clinical evidence supporting CBD applications in pain management, anxiety, sleep quality, and inflammation is expanding the addressable healthcare consumer market for hemp-derived products well beyond traditional cannabis demographics.
By Product Type, Flowers and Buds dominate, Edibles expected to grow fastest
The category of flowers and buds continued to be the leading product type segment in 2025 due to the consistent preference of consumers for the traditional method of cannabis use and the versatility of flower-based products for both smoking and vaporization. The format of dried flowers gives consumers an opportunity to directly experience the cannabinoid and terpene profiles of the cannabis strain, which allows for more knowledgeable selection of the right product depending on individual preferences, effect and flavor. At dispensaries, the premium flower produced by well-known brands enjoys price premiums and generates strong customer loyalty. Craft cannabis production has become a quality segment of the market, similar to the craft beer and spirits segments in consumer-packaged goods.
Edibles are set to witness the highest CAGR till 2035 owing to the changing trend of consumers preferring smokeless means of consuming cannabis, increasing acceptance for precisely dosed cannabis products by medical patients and health-conscious consumers who are not acquainted with traditional methods of consumption, and innovative development of products across the entire spectrum of edibles. Cannabis-infused gummies, chocolates, baked products, mints, capsules, and beverages now exist within the same price and quality scale as conventional candies and food products with big cannabis brands making huge investments in formulation, precise dosing, and packaging that reflects the value of their products to the consumer market. Fast-acting edible products using nanotechnology have been developed to provide onset times similar to inhalation, thus overcoming the traditional weakness associated with edibles of delayed and inconsistent effects and eliminating the hurdle to consumption among first-time consumers.
By Compound, CBD dominates, THC expected to grow fastest
The CBD compound segment maintained its position as the largest contributor to global legal cannabis market revenue in 2025, reflecting CBD's broad application across medical cannabis programs, wellness and nutraceutical products, cosmetics and topicals, and pharmaceutical formulations including Epidiolex, the FDA-approved CBD-based epilepsy treatment that established clinical legitimacy for cannabinoid-based medicines. CBD's non-intoxicating profile makes it commercially accessible across a much wider range of retail and healthcare channels than THC-dominant products, and its inclusion as an ingredient in a growing range of food, beverage, personal care, and dietary supplement products is continuously expanding the consumer base well beyond dedicated cannabis market participants. The regulatory normalization of hemp-derived CBD in the United States, European Union, and a growing number of international markets has enabled mainstream retail distribution at a scale that THC-dominant products cannot yet access in most jurisdictions.
The THC category is projected to have the highest CAGR through 2035 owing to the increasing legalization of recreational cannabis in major international markets, which are increasingly establishing a legal retail framework for THC products. The historic legalization of THC in Germany in 2024, the evolving regulations in the Netherlands, Czech Republic, and other EU member countries, and the continued growth of adult-use cannabis programs in the United States and Canada will contribute to the expansion of the addressable commercial market for THC products at a rate which is expected to far exceed the already mature CBD category. In addition, the growing premiumization of THC concentrates and extracts, including live resin, rosin, distillates, and solventless products that command high retail prices and strong consumer interest in North America, contributes to the rising revenue of the THC category.
By Application, Medical Use dominates, Recreational Use expected to grow fastest
Medical use applications held the largest application segment share in 2025 due to the early adoption of medical cannabis programs compared to recreational programs on a global level, proven medicinal needs among patients suffering from conditions such as chronic pain, epilepsy, multiple sclerosis, cancer-related symptoms, PTSD, and anxiety disorders, and the prescription pathway by physicians as a high-value patient acquisition strategy. Over 55 countries across the globe have implemented medical cannabis programs, which are characterized by physician recommendations and prescription pathways leading to a regular demand for products among patients with medicinal requirements. The increasing involvement of pharmaceutical companies in the research and development of cannabis-based drugs is anticipated to drive medical application revenues during the forecast period.
Recreational usage is anticipated to have the highest rate of application CAGR over the period until 2035 because of the ongoing legalization trend of the adult-use of cannabis moving beyond North America into other parts of Europe, Latin America, and the Asia-Pacific region, which have very large and untapped consumer populations. The partial legalization of Germany in 2024 paved way for further reforms regarding adult-use of cannabis in Europe, while the economic success of legal adult-use cannabis markets in generating taxes, employment, and taking away from the black market provides the necessary evidence that is gradually overcoming the political opposition against legalization in other jurisdictions. The sheer size of the global illicit cannabis market, which is estimated to be consumed by hundreds of millions of people, presents an immense opportunity for the legal cannabis market.
By Distribution Channel, Pharmacies and Dispensaries dominate, Online Retail expected to grow fastest
Pharmacies and dispensaries accounted for the dominant distribution channel share in 2025, a position anchored in the regulatory requirement for licensed retail points of sale across most legal cannabis jurisdictions and the consumer preference for in-person consultation, product sampling, and expert guidance when selecting cannabis products. Mature cannabis dispensary retailers, such as those in California, Colorado, and Canada, have become advanced retail operations with trained personnel, curated product offerings, and digital loyalty programs to enhance customer retention and average basket size. Medical cannabis pharmacies, working under prescription and registration systems in European and Australian markets, offer the adjacent healthcare distribution legitimacy required by medical cannabis users and pharmaceutical-grade cannabis products.
Online retail will experience the highest CAGR through 2035, as more jurisdictions allow legal e-commerce for cannabis products. Online purchasing convenience, broader product offerings in the digital catalog versus physical retail outlets, and discretion afforded by ordering cannabis products online with home delivery are all key consumer pull factors that will help drive adoption as the legal framework evolves. Canadian online cannabis retail, conducted via licensed provincial and private e-commerce platforms, offers a successful example of regulated online cannabis retailing, and will be replicated across more jurisdictions as their legal framework matures.
Regional Insights:
|
Region |
Major Country |
Share within Region (%) |
|---|---|---|
|
North America |
United States |
87% |
|
Europe |
Germany |
31% |
|
Asia Pacific |
Australia |
38% |
|
Middle East and Africa |
South Africa |
32% |
|
Latin America |
Brazil |
48% |
North America Legal Cannabis Market Insights
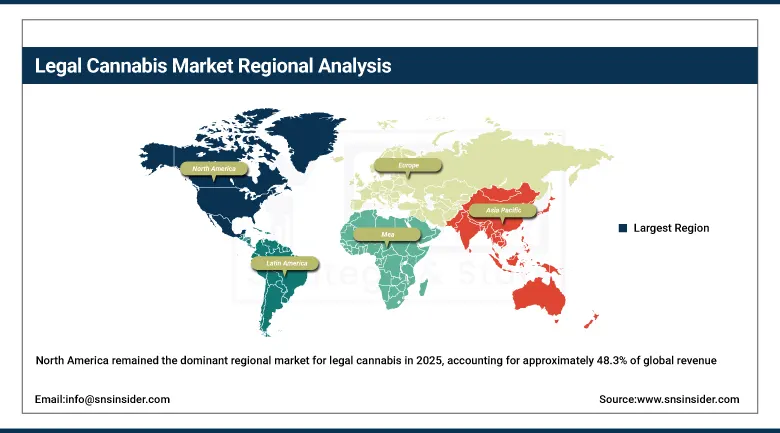
North America remained the dominant regional market for legal cannabis in 2025, accounting for approximately 48.3% of global revenue, built on the combined commercial strength of the United States and Canada where legal frameworks, retail infrastructure, consumer awareness, and capital availability have reached a level of maturity that is unmatched globally. The United States drives the overwhelming majority of North American market revenue through its large state-level adult-use markets and expansive medical programs, with California, Colorado, Michigan, Illinois, and New York representing the highest revenue states. Canada's nationwide adult-use program continues to mature with improving product quality, price normalization, and growing export capability serving international medical markets. Mexico's ongoing implementation of its cannabis regulatory framework adds another significant market to the regional landscape through the forecast period.
Get Customized Report as per Your Business Requirement - Enquiry Now
Asia Pacific Legal Cannabis Market Insights
Asia Pacific is the fastest growing regional market for legal cannabis, projected to record a CAGR of approximately 26.34% during the forecast period, driven by progressive medical cannabis legalization across Australia, South Korea, Thailand, and the Philippines, combined with the extraordinary scale of the consumer population that will become addressable as regulatory frameworks develop. Australia has established one of the most sophisticated medical cannabis frameworks outside North America, with a well-developed cultivation, processing, and dispensing ecosystem serving a rapidly growing patient population. Thailand's 2022 decriminalization opened a significant new market before regulatory adjustments in 2025 reestablished medical-only access, illustrating the fluid and evolving nature of the region's cannabis policy landscape. South Korea's progressive opening of its medical cannabis framework and Japan's early-stage policy discussions signal the progressive direction of Asian cannabis regulation.
Europe Legal Cannabis Market Insights
Europe had an increasing share of the global legal cannabis market in 2025 due to the well-developed medical market in Germany, the Netherlands, Italy, Portugal, Poland, and the Czech Republic, as well as the ongoing reform of the recreational cannabis market due to partial legalization in Germany, which came into force in 2024. The decision by Germany to legalize personal consumption and regulated cannabis clubs was the most important development in the field of European cannabis policy in recent years, as it indicates the trend towards a more liberal approach by the largest economy in Europe that can be followed by other EU countries. The United Kingdom still has a medical-only market but with a steadily increasing number of prescriptions, while Switzerland is running regulated recreational cannabis trials in a number of its cities that can help in future legalization. The trend among European cannabis companies is to gain EU-GMP certification for their medical cannabis products.
Middle East and Africa and Latin America Legal Cannabis Market Insights
The Middle East and Africa and Latin America are considered some of the emerging high growth areas for the cannabis industry. This is due to changes in regulations, high agricultural production capacity, and increased demand from consumers and patients for cannabis products. In South Africa, the country has made regulations that allow the use of cannabis in homes and personal consumption of the drug. Commercialization of cannabis is also under discussion. Lesotho, Zimbabwe, and Zambia have allowed cultivation licenses mainly for the purpose of exporting medical cannabis. As such, the continent of Africa can be considered an alternative location to produce cannabis for the international market at relatively lower costs. The Latin American countries have taken the lead in terms of cannabis policy reforms, where Uruguay has led the way with its national legalization initiative.
Market Dynamics:
Growth Drivers: Accelerating global legalization wave and growing clinical recognition of therapeutic applications creating structural demand across medical and recreational channels
The most powerful and sustained driver of the legal cannabis market is the progressive global expansion of legal frameworks covering both medical and adult-use cannabis, which is systematically converting existing illicit market consumption into regulated commercial revenue and creating entirely new consumer cohorts among populations who would not engage with unregulated cannabis but are willing to use legal, tested, and properly labeled products. The pace of legalization has accelerated meaningfully in recent years, with Germany's 2024 partial legalization representing the single most significant European policy development to date, and a growing pipeline of countries in Europe, Latin America, and Asia Pacific actively advancing their own regulatory frameworks. Each new legalization creates immediate commercial opportunity and provides additional policy evidence to governments still deliberating, reinforcing the global legalization trend with demonstrated tax revenue, employment creation, and public health management outcomes from established markets.
Clinical research into cannabinoid therapeutics has expanded substantially over the past decade, generating evidence across an increasingly wide range of medical conditions and moving cannabis-based medicines progressively closer to mainstream pharmaceutical practice. The approval of Epidiolex for pediatric epilepsy syndromes by the FDA established that cannabis-derived compounds can meet the regulatory standard for prescription medicines, opening a pathway that additional cannabinoid compounds are now following through clinical development. Growing physician comfort with recommending and prescribing cannabis-based treatments, combined with expanding medical education and patient awareness, is driving consistent growth in medical cannabis patient populations across every jurisdiction with an established program.
Restraints: Regulatory fragmentation, federal prohibition in key markets, and illicit market competition creating persistent commercial and operational constraints
A significant restraint on legal cannabis market growth is the profound regulatory fragmentation that creates complexity, cost, and competitive disadvantage for cannabis businesses operating across multiple jurisdictions. In the United States, the coexistence of state-level legalization with federal prohibition creates a unique set of operational challenges including restricted banking access, the Section 280E tax code treatment that denies normal business expense deductions, limitations on interstate commerce even between legal states, and the inability to access capital markets on the same terms as other publicly traded consumer goods companies. These federal prohibition constraints add meaningful operational costs that reduce profitability and limit the capital available for brand building, market expansion, and technology investment. Internationally, the wide variation in legal frameworks across countries creates barriers to cross-border product sales and capital flows that prevent the formation of global cannabis businesses analogous to multinational consumer goods companies in adjacent categories. The persistent scale of illicit cannabis markets, which continue to undercut legal prices through tax avoidance and regulatory non-compliance, represents an additional restraint on legal market revenue growth across most jurisdictions.
Opportunities: Pharmaceutical-grade cannabinoid medicines, international medical export markets, and mainstream consumer goods integration creating high-value growth pathways
The legal cannabis market stands at the intersection of multiple high-value growth opportunities that extend well beyond the dispensary and direct-to-consumer retail channels that have defined the industry's first commercial decade. The pharmaceutical pathway for cannabinoid-based medicines represents perhaps the highest-value long-term opportunity, as the clinical development pipeline for cannabis-derived compounds addressing epilepsy, multiple sclerosis spasticity, cancer-related symptoms, PTSD, and chronic pain produces regulatory approvals that open prescription medicine distribution channels, insurance reimbursement coverage, and physician-led patient populations that cannot be reached through conventional cannabis retail. The international medical cannabis export market is creating substantial opportunities for Canadian, Dutch, Israeli, and increasingly Latin American and African producers who can meet EU-GMP certification requirements and supply the growing patient populations in Germany, the United Kingdom, Australia, and other countries where domestic cultivation capacity is insufficient to meet demand. The progressive entry of mainstream consumer packaged goods companies into the cannabis-adjacent wellness space through CBD-infused food, beverage, and personal care products is expanding the consumer surface area of the cannabis market to encompass categories with combined global revenues that dwarf the current dedicated cannabis market.
Recent Developments:
-
2026: Aurora Cannabis Inc. acquired Safari Flower Company, an EU-GMP certified cannabis cultivator and manufacturer, for aggregate consideration of approximately USD 26.5 million, strengthening its licensed production capacity and international medical cannabis supply capability across European markets at a time of growing demand from German and other European medical programs.
-
2025 (November): Curaleaf Holdings announced a strategic review of its European operations with a focus on optimizing its UK and EU medical cannabis business for profitable growth, while simultaneously expanding dispensary operations in the United States as the company prioritized capital allocation toward its strongest market opportunities across the evolving North American landscape.
-
2025 (April): Aurora Cannabis Inc. completed a multi-year investment to modernize its production facility in Pemberton, British Columbia, enhancing its EU-GMP certified production capabilities and positioning the facility to increase supply to its growing European medical cannabis distribution network across Germany, the UK, and other international markets.
-
2025 (February): Trulieve Cannabis Corp. continued its U.S. market expansion strategy with additional dispensary openings in key states and investments in branded product lines targeting the premium adult-use segment, reinforcing its position as one of the largest multi-state operators by retail footprint and revenue in the United States.
-
2024 (October): Canopy Growth Corporation completed the restructuring of its business model following its strategic acquisition agreements with Acreage Holdings and Wana Brands, focusing its operations on high-margin medical and premium recreational cannabis products and positioning the company for improved financial performance as Canadian and international market conditions evolved.
Legal Cannabis Market Key Players
-
Canopy Growth Corporation
-
Aurora Cannabis Inc.
-
Curaleaf Holdings, Inc.
-
Trulieve Cannabis Corp.
-
Green Thumb Industries Inc.
-
Cresco Labs Inc.
-
Verano Holdings Corp.
-
Tilray Brands, Inc.
-
TerrAscend Corp.
-
Organigram Holdings Inc.
-
Cronos Group Inc.
-
Acreage Holdings, Inc.
-
Columbia Care Inc.
-
Harvest Health and Recreation Inc.
-
iAnthus Capital Holdings, Inc.
-
Sundial Growers Inc.
-
Aphria Inc.
-
MedReleaf Corp.
-
Jushi Holdings Inc.
-
HEXO Corp.
Legal Cannabis Market Report Scope:
| Report Attributes | Details |
|---|---|
| Market Size in 2025 | USD 226.16 Billion |
| Market Size by 2035 | USD 1280.9 Billion |
| CAGR | CAGR of 23.28% From 2026 to 2035 |
| Base Year | 2025 |
| Forecast Period | 2026-2035 |
| Historical Data | 2022-2024 |
| Report Scope & Coverage | Market Size, Segments Analysis, Competitive Landscape, Regional Analysis, DROC & SWOT Analysis, Forecast Outlook |
| Key Segments | • By Source (Marijuana, Hemp) • By Product Type (Flowers and Buds, Concentrates, Edibles, Tinctures and Oils, Topicals, Others) • By Compound (CBD, THC, Others) • By Application (Medical Use, Recreational Use, Industrial Use) • By Distribution Channel (Pharmacies and Dispensaries, Online Retail, Others) |
| Regional Analysis/Coverage | North America (US, Canada, Mexico), Europe (Eastern Europe [Poland, Romania, Hungary, Turkey, Rest of Eastern Europe] Western Europe] Germany, France, UK, Italy, Spain, Netherlands, Switzerland, Austria, Rest of Western Europe]), Asia Pacific (China, India, Japan, South Korea, Vietnam, Singapore, Australia, Rest of Asia Pacific), Middle East & Africa (Middle East [UAE, Egypt, Saudi Arabia, Qatar, Rest of Middle East], Africa [Nigeria, South Africa, Rest of Africa], Latin America (Brazil, Argentina, Colombia, Rest of Latin America) |
| Company Profiles | Canopy Growth Corporation, Aurora Cannabis Inc., Curaleaf Holdings, Inc., Trulieve Cannabis Corp., Green Thumb Industries Inc., Cresco Labs Inc., Verano Holdings Corp., Tilray Brands, Inc., TerrAscend Corp., Organigram Holdings Inc., Cronos Group Inc., Acreage Holdings, Inc., Columbia Care Inc., Harvest Health and Recreation Inc., iAnthus Capital Holdings, Inc., Sundial Growers Inc., Aphria Inc., MedReleaf Corp., Jushi Holdings Inc., HEXO Corp. |
Frequently Asked Questions
Ans: North America dominated the Legal Cannabis Market in 2025 with approximately 48.3% of global revenue, anchored by the United States as the world's largest single cannabis market through its expansive network of state-level adult-use and medical programs, and supported by Canada's nationwide adult-use framework that established the first comprehensive national legal cannabis model globally.
Ans: The Medical Use segment dominated the Legal Cannabis Market in 2025, reflecting the global head start of medical cannabis programs over recreational frameworks, the well-documented therapeutic demand from patients managing chronic conditions, and the physician-led patient acquisition model that creates consistent, repeat-purchase demand across the more than 55 countries with established medical cannabis frameworks.
Ans: The Marijuana segment dominated the Legal Cannabis Market in 2025 with approximately 76.4% of global revenue, driven by its central role across licensed medical cannabis programs, adult-use retail markets in North America, and growing European medical frameworks where marijuana-derived products command significant consumer and patient demand across flower, concentrate, and extract formats.
Ans: The progressive global expansion of legal frameworks covering both medical and adult-use cannabis, combined with growing clinical recognition of cannabinoid therapeutic applications, increasing consumer acceptance of cannabis as a mainstream wellness and recreational product, and the ongoing conversion of illicit market consumption into regulated commercial revenue as legal access expands across new geographies.
Ans: The Legal Cannabis Market was valued at USD 27.84 billion in 2025.
Ans: The Legal Cannabis Market is expected to grow at a CAGR of 23.28% from 2026 to 2035.
Get in Touch
