Cable Connector Market Size:
Get more information on Cable Connector Market - Request Sample Report
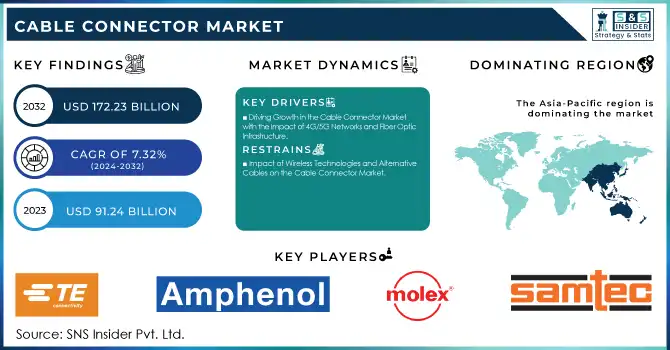
The Cable Connector Market Size was valued at USD 91.24 Billion in 2023 and is expected to reach USD 172.23Billion by 2032 and grow at a CAGR of 7.32% over the forecast period 2024-2032.
The cable connector market is witnessing robust growth, largely driven by the expanding automotive industry, particularly the rise of electric vehicles (EVs), connected cars, and autonomous vehicles. With the automotive sector’s rapid evolution, there is an increasing demand for high-quality automotive connectors that ensure safety, high power efficiency, and secure data transmission. The shift towards electric vehicles (EVs) and autonomous driving systems necessitates advanced connector solutions that can handle complex integration of data, signal, and power. Companies like Molex, with their innovative MX Dash connectors, are leading this transition, providing multi-functional connectors that simplify packaging and reduce time in harness installations, offering up to 30% fewer components, which is critical for next-gen automotive applications.
The adoption of electric vehicles is also driving the need for connectors capable of handling high-voltage systems essential for battery management and charging infrastructure
The adoption of electric vehicles is driving a surge in demand for high-voltage connectors, crucial for managing power systems in EV batteries, ensuring efficient charging, and safe energy transfer. In the United States, which accounts for 60% of global car sales, EV sales are set to rapidly grow following the USD 62 billion investment in EVs spurred by the Inflation Reduction Act. This growth is directly influencing the cable connector market, as advanced connectors are increasingly essential to support high-voltage systems in EV battery management and charging infrastructure.
As wireless communication technologies evolve, the demand for automotive connectors facilitating data transfer continues to rise, especially in autonomous vehicles. Innovations in connectors, like the 31+1-Way connector system, are streamlining operations by combining multiple functionalities into a single connector. This demand for high-performance connectors is expected to drive the cable connector market growth, making the automotive sector the dominant and fastest-growing segment. by 2032, technological advancements in automotive connectivity will position this market as a crucial area for growth, with connectors for EVs and autonomous vehicles playing a leading role.
Cable Connector Market Dynamics
Drivers
-
Driving Growth in the Cable Connector Market with the Impact of 4G/5G Networks and Fiber Optic Infrastructure
The cable connector market is experiencing substantial growth, driven by the rapid expansion of 4G/5G networks and the increasing deployment of fiber optic communication systems. As the global demand for high-speed internet and connected devices continues to rise, telecom companies are investing heavily in upgrading cellular towers, fiber optic networks, and backhaul systems. This creates a surge in the need for advanced connectors that can support high bandwidth and data transmission speeds. Fiber optic cables, which handle 90% of internet traffic in the USA, are the backbone of macro cell towers, which cover vast areas and are integral to maintaining seamless connectivity across the country. With over 400,000 macro cell tower installations in the U.S., these towers rely heavily on fiber optic cables to ensure efficient and uninterrupted communication, especially as the world moves toward 5G technology. As the telecommunications infrastructure market grows, the complexity of structured cabling systems increases, incorporating data, voice, and video services. This trend fuels the demand for high-performance connectors that are capable of meeting the rigorous demands of modern communication networks. For instance, fiber optic cables are not just integral to the U.S. telecom sector but are also crucial in other regions like Africa, where Google emphasizes their importance to improve connectivity and internet access.
Additionally, the push for fiber-to-the-home deployments and data centers further accelerates the need for reliable and scalable cabling solutions. The rising number of undersea cables, with 98% of global internet traffic traveling through them, further highlights the vital role connectors play in facilitating global communication. As telecom companies continue to invest in fiber optic networks to support the shift to 5G, the demand for advanced cable connectors will remain a significant driver of growth in the market.
Restraints
-
Impact of Wireless Technologies and Alternative Cables on the Cable Connector Market
One of the significant market restraints for the cable connector industry is the rising competition from alternative technologies, particularly the increasing adoption of wireless communication systems and emerging cable alternatives. As industries, including telecommunications, automotive, and data centers, shift toward wireless technologies such as Wi-Fi 6, 5G, and Bluetooth, the demand for traditional wired connectors may decline. These advancements in wireless communication offer enhanced flexibility, faster speeds, and reduced physical infrastructure requirements, making them increasingly attractive for sectors that historically relied heavily on cable connectors. Furthermore, developments in alternative cable technologies, such as e-tube cables and undersea cables, are gaining traction as they offer advantages like higher power capacity, lighter weight, and better energy efficiency. For example, as reported by research, 98% of global internet traffic is now carried through submarine fiber-optic cables, which play a vital role in data transmission across continents, yet new materials and innovations in the cable space are pushing for more sustainable and efficient solutions that may reduce reliance on traditional connectors. Additionally, the drive for sustainability and energy efficiency has led to the development of new power cable technologies in Europe, further promoting the shift towards these alternatives. As market players such as Google and telecom operators continue to embrace wireless and alternative solutions to support the rollout of 5G and fiber optic networks, the traditional cable connector market could face challenges in maintaining its growth trajectory. With competition from alternative technologies, the need for traditional wired connectors might be overshadowed, creating a restraint on the market's expansion. Therefore, the industry must adapt by innovating to remain relevant in an increasingly wireless-driven world.
Cable Connector Market Segment Outlook
by Type
by Type, The PCB connectors segment captured the largest revenue share in the cable connector market, holding 35% in 2023. These connectors are widely used in various applications, especially in electronics and telecommunications, due to their compact design, reliability, and versatility. PCB connectors enable secure electrical connections on printed circuit boards, which are crucial for devices like smartphones, computers, automotive electronics, and industrial machinery. The growth of industries such as consumer electronics, automotive, and telecommunications, along with the increasing demand for high-speed data transmission, significantly contributes to the dominance of PCB connectors. Their ability to support a broad range of signals, from low to high frequency, further drives their adoption, ensuring their continued leadership in the cable connector market.
by End User Vertical
The IT and telecom segment captured the largest revenue share of 38% in the cable connector market in 2023. This sector is driven by the increasing demand for high-speed internet, mobile data, and reliable communication infrastructure. The rapid expansion of 4G/5G networks, fiber optic systems, and data centers contributes significantly to the growth of cable connectors in this vertical. Telecom companies require durable, high-performance connectors to ensure seamless data transmission and connectivity, especially as they deploy advanced technologies like fiber-to-the-home (FTTH) and build extensive cellular tower networks. Additionally, the growing adoption of connected devices, such as smartphones, IoT systems, and cloud services, further fuels the need for efficient and scalable connectivity solutions. The IT and telecom segment’s continued growth is expected to drive the sustained demand for cable connectors in the coming years.
Cable Connector Market Regional Analysis
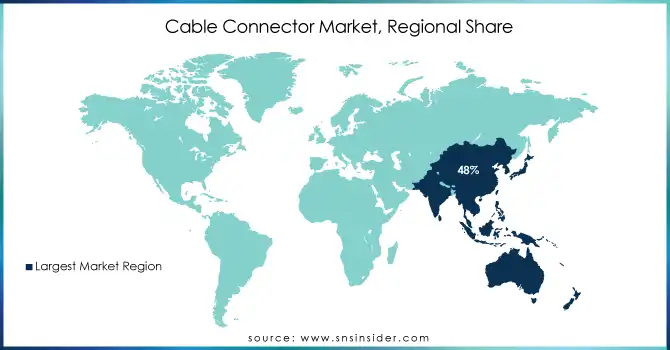
Asia-Pacific dominated the cable connector market in 2023, capturing around 48% of the total revenue. The region’s growth is driven by rapid technological advancements, a surge in infrastructure development, and a booming telecommunications sector. Countries like China, India, Japan, and South Korea are leading the way in cable connector demand, with significant investments in 5G networks, data centers, and fiber optic systems. China’s ongoing expansion of its telecommunications infrastructure and India’s growing adoption of high-speed internet and mobile technology are major contributors to the market’s growth.
Additionally, the rise of smart cities, urbanization, and increasing smartphone penetration in emerging markets like Indonesia and Vietnam are further propelling the demand for reliable and efficient connectivity solutions. The Asia-Pacific region is also a hub for manufacturing and innovation in cable connectors, making it a critical center for global supply chains. As the region continues to modernize its infrastructure and expand digital networks, the cable connector market is poised for sustained growth.
North America is expected to be the fastest-growing region in the cable connector market over the forecast period from 2024 to 2032. The U.S. and Canada are the primary drivers of this growth, fueled by the rapid expansion of 5G networks, increasing investments in data centers, and the growing demand for high-speed broadband connectivity. The U.S. has been at the forefront of adopting fiber optic infrastructure, with initiatives to improve broadband access in rural areas and enhance mobile network capabilities. Additionally, the expansion of smart cities and the integration of IoT devices in North America is propelling the need for advanced cable connectors to support robust and scalable networks. The rise in electric vehicles and autonomous driving technologies also contributes to the demand for reliable, high-performance connectors for charging stations and in-vehicle systems. With a strong focus on technological innovation, infrastructure development, and government-backed initiatives like the Infrastructure Investment and Jobs Act, North America’s cable connector market is poised for significant growth in the coming years.
Get Customized Report as per your Business Requirement - Request For Customized Report
Key Players
Some of the Major Players in Cable Connector Market along with their product:
-
TE Connectivity (Fiber Optic Connectors, Circular Connectors, PCB Connectors)
-
Amphenol Corporation (RF Coaxial Connectors, Rectangular Connectors, Automotive Connectors)
-
Molex LLC (Industrial Automation Connectors, Power Connectors, High-Speed Input/Output Connectors)
-
Samtec, Inc. (High-Speed Cable Assemblies, Optical Connectors, Micro Connectors)
-
Hirose Electric Co., Ltd. (RF Connectors, Circular Connectors, Automotive Solutions)
-
Delphi Technologies (Automotive Connectors, Electric Vehicle Connectors)
-
3M (Mini-Clamp Connectors, Wiremount Connectors, IDC Connectors)
-
Luxshare Precision Industry Co., Ltd. (High-Speed Interconnects, Consumer Electronics Connectors)
-
Foxconn Interconnect Technology (FIT) (Data Center Interconnects, PCB Connectors, Consumer Electronics Solutions)
-
JAE Electronics (Board-to-Board Connectors, Fiber Optic Connectors, Industrial Connectors)
-
ITT Cannon (Circular Connectors, High-Temperature Connectors, Mil-Spec Connectors)
-
Yazaki Corporation (Automotive Wire Harnesses, High-Voltage EV Connectors)
-
Belden Inc. (Industrial Ethernet Cables, Fiber Optic Connectors, Industrial Automation Solutions)
-
Lapp Group (Industrial Connectors, Cable Assemblies, Fiber Optic Solutions)
-
Huber+Suhner (RF Coaxial Connectors, Fiber Optic Connectors, High-Density Solutions)
-
Radiall SA (RF Connectors, Space and Defense Connectors, Fiber Optic Interconnects)
-
Phoenix Contact (PCB Terminal Blocks, Industrial Ethernet Connectors)
-
Harting Technology Group (Industrial Connectivity Solutions, Han Modular Connectors)
-
AVX Corporation (Power Connectors, Automotive Connectors, Miniature Connectors)
-
Rosenberger Group (RF and High-Frequency Connectors, Automotive Connectivity Solutions)
List suppliers provide the essential raw materials needed for the fabrication of high-quality connectors across various industries.
-
Copper Development Association (CDA)
-
Sumitomo Metal Mining Co., Ltd.
-
Korea Zinc Co., Ltd.
-
BASF
-
Sabic
-
DuPont
-
Precision Castparts Corp.
-
Thyssenkrupp
-
Mitsubishi Materials Corporation
-
Reliance Steel & Aluminum Co.
Recent Development
-
July 31, 2024 – TE Connectivity has integrated its GEMnet connector system with Texas Instruments’ FPD-Link IV SerDes devices to support high-resolution, uncompressed video transmission in automotive infotainment systems. This collaboration enables seamless data transfer for 4K, 5K, and 8K displays with near-zero latency, enhancing automotive display and control applications.
-
July 6, 2024 – Molex has introduced its Inception portfolio, featuring high-speed backplanes, cable assemblies, and connectors capable of reaching up to 224 Gb/s speeds. Designed for the AI era, the system enhances chip-to-chip connectivity with optimal signal integrity, reducing degradation and interference in data centers and server architectures.
| Report Attributes | Details |
|---|---|
| Market Size in 2023 | USD 91.24 Billion |
| Market Size by 2032 | USD 172.23 Billion |
| CAGR | CAGR of 7.32% From 2024 to 2032 |
| Base Year | 2023 |
| Forecast Period | 2024-2032 |
| Historical Data | 2020-2022 |
| Report Scope & Coverage | Market Size, Segments Analysis, Competitive Landscape, Regional Analysis, DROC & SWOT Analysis, Forecast Outlook |
| Key Segments | • By Type (PCB Connectors, Circular/Rectangular Connectors, Fiber Optic Connectors, IO Connectors, Types) • By End-User Vertical (IT and Telecom, Automotive/Transportation, Consumer Electronics (Including Computer, Peripherals, and Business Equipment), Industrial, Others (Submarine, Aerospace, Energy and Power, and Medical)), |
| Regional Analysis/Coverage | North America (US, Canada, Mexico), Europe (Eastern Europe [Poland, Romania, Hungary, Turkey, Rest of Eastern Europe] Western Europe] Germany, France, UK, Italy, Spain, Netherlands, Switzerland, Austria, Rest of Western Europe]), Asia Pacific (China, India, Japan, South Korea, Vietnam, Singapore, Australia, Rest of Asia Pacific), Middle East & Africa (Middle East [UAE, Egypt, Saudi Arabia, Qatar, Rest of Middle East], Africa [Nigeria, South Africa, Rest of Africa], Latin America (Brazil, Argentina, Colombia, Rest of Latin America) |
| Company Profiles | TE Connectivity, Amphenol Corporation, Molex LLC, Samtec, Inc., Hirose Electric Co., Ltd., Delphi Technologies, 3M, Luxshare Precision Industry Co., Ltd., Foxconn Interconnect Technology (FIT), JAE Electronics, ITT Cannon, Yazaki Corporation, Belden Inc., Lapp Group, Huber+Suhner, Radiall SA, Phoenix Contact, Harting Technology Group, AVX Corporation, and Rosenberger Group. |
| Key Drivers | • Driving Growth in the Cable Connector Market with the Impact of 4G/5G Networks and Fiber Optic Infrastructure. |
| Restraints | • Impact of Wireless Technologies and Alternative Cables on the Cable Connector Market. |
Frequently Asked Questions
PCB Connectors segment is dominating in Cable Connector Market.
The growing demand for high-speed data transmission, driven by advancements in 5G networks, IoT, and telecommunications infrastructure, is a key driver for the cable connector market.
The Asia-Pacific region is dominating region in the Cable Connector Market.
The expected CAGR of the global Cable Connector Market during the forecast period is 7.32%.
The Cable Connector Market was valued at USD 91.24 Billion in 2023.
Get in Touch
