Power to Gas Market Report Scope & Overview:
Get more information on Power to Gas Market - Request Sample Report
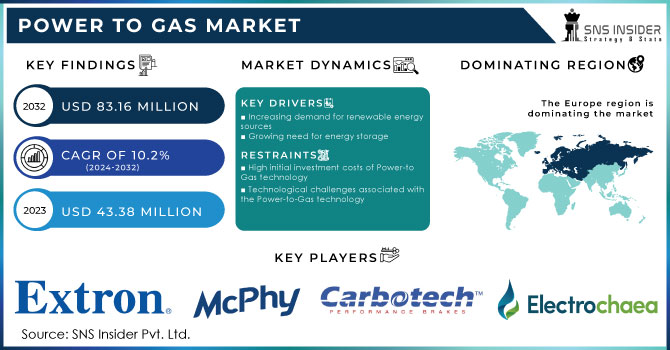
The Power to Gas Market size was valued at USD 43.38million in 2023 and is expected to reach USD 83.16 million by 2032 with a growing CAGR of 10.2% over the forecast period of 2024-2032.
The advantages of Power-to-Gas are numerous. Firstly, it provides a solution to the intermittent nature of renewable energy sources by enabling the storage of excess electricity in the form of hydrogen or methane. During periods of high demand for energy, this stored energy can then be used. Additionally, Power-to-Gas offers a means to decarbonize various sectors, such as transportation and heating, by providing a clean alternative to fossil fuels. The utilization of hydrogen or methane as energy carriers can significantly reduce greenhouse gas emissions and contribute to the mitigation of climate change. Furthermore, Power-to-Gas technology promotes the efficient use of existing infrastructure. By injecting methane produced through methanation into the natural gas grid, it becomes possible to utilize the existing gas infrastructure for the storage and distribution of renewable energy.
The concept of "Power-to-Gas" refers to technology that enables the conversion of surplus electricity into hydrogen or methane gas. This innovative process holds immense potential for the integration of renewable energy sources into our existing energy systems. Excess electricity generated from renewable sources, such as wind or solar power, is utilized to produce green hydrogen gas through electrolysis. This process involves splitting water molecules into hydrogen and oxygen using an electric current. The hydrogen produced can then be stored and utilized as a clean energy source in various applications. Moreover, Power-to-Gas technology also allows for the conversion of hydrogen into methane gas through a process called methanation. This step involves combining hydrogen with carbon dioxide, typically sourced from industrial emissions or biogas production, to produce methane. The resulting methane can be injected into the natural gas grid, stored for later use, or utilized as fuel for transportation.
One of the key drivers behind the expansion of the power-to-gas market is the increasing penetration of renewable energy sources, such as wind and solar power. These sources often generate more electricity than is immediately required, leading to curtailment or wastage. Power-to-gas technology provides a solution by converting this excess electricity into hydrogen or methane gas, which can be stored for later use or injected into the natural gas grid. The power-to-gas market also plays a crucial role in addressing the challenge of energy storage. As renewable energy sources become more prevalent, the need for efficient and scalable energy storage solutions becomes paramount. Power-to-gas technology offers a viable option by converting surplus electricity into a storable form, allowing for a flexible and on-demand energy supply. Furthermore, power-to-gas systems have the potential to contribute to the decarbonization of various sectors. Hydrogen produced through power-to-gas can be used as a fuel for transportation, heating, and industrial processes, offering a clean alternative to fossil fuels. Methane produced through this process, known as synthetic natural gas, can be injected into the existing natural gas infrastructure, reducing the carbon footprint of the gas grid. The power-to-gas market is witnessing significant growth globally, with several countries investing in research and development and implementing pilot projects. Germany, in particular, has emerged as a leader in this field, with numerous power-to-gas facilities already in operation. The European Union has also recognized the potential of power-to-gas technology and has included it in its strategic energy plans.
Market Dynamics
Drivers
-
Increasing demand for renewable energy sources
-
Growing need for energy storage
With the intermittent nature of renewable energy sources, efficient energy storage solutions are becoming crucial. Power-to-gas technology enables the storage of excess energy in the form of hydrogen or methane, which can be converted back into electricity when required, addressing the need for reliable energy storage.
Restrain
-
High initial investment costs of Power-to-Gas technology
-
Technological challenges associated with the Power-to-Gas technology
Power-to-gas technology is still in its early stages, and there are ongoing challenges in terms of efficiency, scalability, and cost-effectiveness. Overcoming these technological hurdles is essential for the widespread adoption of this technology.
Opportunities
-
Expansion of hydrogen economy
-
Rising demand from the transportation sector
Power-to-gas technology can play a crucial role in decarbonizing various sectors, such as transportation and heating. Hydrogen produced through power-to-gas can be used as a clean fuel for vehicles, reducing greenhouse gas emissions and improving air quality. Additionally, injecting renewable methane into existing natural gas pipelines can help reduce the carbon footprint of heating systems.
Challenges
-
Scalability of power-to-gas technology
While small-scale pilot projects have demonstrated the feasibility of the concept, scaling up to meet the energy demands of entire regions or countries remains a significant hurdle. Adequate infrastructure, such as pipelines and storage facilities, must be developed to accommodate the large-scale deployment of power-to-gas systems.
Impact of Russia-Ukraine War:
Russia- Ukraine war has resulted in a decrease in gas supplies from Russia to Ukraine, which has had a direct effect on the availability and pricing of natural gas. As a result, countries heavily reliant on Russian gas imports, such as Ukraine and some European nations, have been forced to seek alternative energy sources. Germany, in particular, depends on Russia for about 50% of its natural gas needs. In August 2022, European gas prices reached a record high of 345 euros/MWh. This surge was primarily caused by Russia's strategic manipulation of its natural gas exports in response to punitive EU sanctions. Additionally, the high temperatures experienced during the summer further exacerbated the situation by increasing demand and limiting supply.
One of the key alternatives that have gained prominence is Power-to-Gas technology. The Russia-Ukraine war has accelerated the adoption of Power-to-Gas technology, as countries strive to reduce their dependence on Russian gas imports. This shift has created a significant market opportunity for companies involved in the development and implementation of Power-to-Gas solutions. As a result, the industry has witnessed a surge in investments, research, and development activities. Furthermore, the conflict has also highlighted the importance of energy security and diversification. Countries that were previously reliant on Russian gas have recognized the need to diversify their energy sources to mitigate the risks associated with geopolitical tensions. This has led to increased investments in renewable energy infrastructure, including Power-to-Gas projects.
Impact of Recession:
One of the major challenges faced by the Power-to-Gas market during the recession is the limited availability of funding. Investors are more cautious and hesitant to allocate resources to projects that may have uncertain returns. This lack of financial support has impeded the development and expansion of Power-to-Gas technologies. Furthermore, the recession has also affected the regulatory environment. Governments, grappling with economic instability, have shifted their focus away from renewable energy initiatives. This has resulted in a decrease in policy support and incentives for the Power-to-Gas sector, further hindering its growth.
Key Market Segmentation
By Technology
-
Methanation
-
Electrolysis
By Capacity
-
Less than 100 kW
-
100–999 kW
-
1000 kW
-
More than 1000 kW
By End-user
-
Commercial
-
Residential
-
Utility
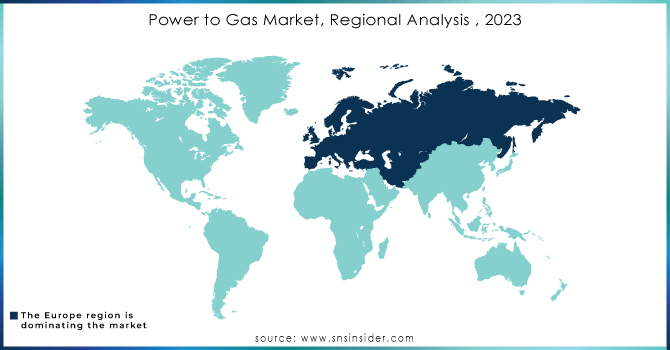
Regional Analysis
Europe dominated the Power-to-Gas market and is expected to grow with a significant CAGR during the forecast period. The reason behind this dominance is significant investments in renewable energy sources, such as wind and solar power. These sources often generate excess electricity during periods of low demand. By converting this surplus energy into gas, Europe has found an effective way to store and utilize it efficiently, thereby reducing wastage. In addition, Europe's well-established infrastructure and interconnected energy grids have facilitated the integration of Power-to-Gas systems. The continent's extensive pipeline network enables the transportation and distribution of hydrogen and methane gas to various end-users, including industries, households, and transportation sectors. This seamless integration has further propelled Europe's dominance in the Power-to-Gas market. Moreover, Europe's commitment to reducing greenhouse gas emissions and transitioning towards a sustainable energy future has been a driving force behind the growth of the Power-to-Gas market. By utilizing hydrogen and methane gas as clean energy alternatives, Europe has been able to reduce its reliance on fossil fuels and mitigate the environmental impact of traditional energy sources.
Get Customized Report as per your Business Requirement - Request For Customized Report
REGIONAL COVERAGE:
North America
-
US
-
Canada
-
Mexico
Europe
-
Eastern Europe
-
Poland
-
Romania
-
Hungary
-
Turkey
-
Rest of Eastern Europe
-
-
Western Europe
-
Germany
-
France
-
UK
-
Italy
-
Spain
-
Netherlands
-
Switzerland
-
Austria
-
Rest of Western Europe
-
Asia Pacific
-
China
-
India
-
Japan
-
South Korea
-
Vietnam
-
Singapore
-
Australia
-
Rest of Asia Pacific
Middle East & Africa
-
Middle East
-
UAE
-
Egypt
-
Saudi Arabia
-
Qatar
-
Rest of the Middle East
-
-
Africa
-
Nigeria
-
South Africa
-
Rest of Africa
-
Latin America
-
Brazil
-
Argentina
-
Colombia
-
Rest of Latin America
Key Players
The major key players are Electrochaea, Carbotech, McPhy Energy, Exytron, Avacon, ITM Power, Aquahydrex, MAN Energy Solutions, Nel Hydrogen, Fuel Cell Energy, Hydrogenic, Green Hydrogen, Siemens AG, ThyssenKrupp, and other key players mentioned in the final report.
Recent Developments:
-
In January 2023, Energie 360° partnered with the German company Electrochaea GmbH to accelerate the advancement of the power-to-gas technology concept.
-
In March 2022, the grid operator Avacon successfully integrated 20% hydrogen into a sub-grid as part of the European distribution grid initiative Ready4H2, which was conducting a trial to blend hydrogen into the natural gas grid.
-
In June 2023, MAN Energy Solutions made a significant announcement by selling its gas turbine business to China's CSIC Longjiang GH Gas Turbine Co Ltd (GHGT).
| Report Attributes | Details |
| Market Size in 2023 | US$ 43.38 Mn |
| Market Size by 2032 | US$ 83.16 Mn |
| CAGR | CAGR of 10.2% From 2024 to 2032 |
| Base Year | 2023 |
| Forecast Period | 2024-2032 |
| Historical Data | 2020-2022 |
| Report Scope & Coverage | Market Size, Segments Analysis, Competitive Landscape, Regional Analysis, DROC & SWOT Analysis, Forecast Outlook |
| Key Segments | • By Technology (Methanation and Electrolysis) • By Capacity (Less than 100 kW, 100–999 kW, 1000 kW, and More than 1000 kW) • By End-user (Commercial, Residential, and Utility) |
| Regional Analysis/Coverage | North America (US, Canada, Mexico), Europe (Eastern Europe [Poland, Romania, Hungary, Turkey, Rest of Eastern Europe] Western Europe] Germany, France, UK, Italy, Spain, Netherlands, Switzerland, Austria, Rest of Western Europe]). Asia Pacific (China, India, Japan, South Korea, Vietnam, Singapore, Australia, Rest of Asia Pacific), Middle East & Africa (Middle East [UAE, Egypt, Saudi Arabia, Qatar, Rest of Middle East], Africa [Nigeria, South Africa, Rest of Africa], Latin America (Brazil, Argentina, Colombia Rest of Latin America) |
| Company Profiles | Electrochaea, Carbotech, McPhy Energy, Exytron, Avacon, ITM Power, Aquahydrex, MAN Energy Solutions, Nel Hydrogen, Fuel Cell Energy, Hydrogenic, Green Hydrogen, Siemens AG, ThyssenKrupp |
| Key Drivers | • Increasing demand for renewable energy sources • Growing need for energy storage |
| Market Restraints | • High initial investment costs of Power-to-Gas technology • Technological challenges associated with the Power-to-Gas technology |
Frequently Asked Questions
Ans: The Power to Gas Market is bifurcated into 3 major segments: 1. By Technology 2. By Capacity 3. By End-user.
Ans: Europe is the dominating region of the Power to Gas Market.
Ans: The major key players in the Power to Gas Market are Electrochaea, Carbotech, McPhy Energy, Exytron, Avacon, ITM Power, Aquahydrex, MAN Energy Solutions, Nel Hydrogen, Fuelcell Energy, Hydrogenic, Green Hydrogen, Siemens AG, and ThyssenKrupp.
Ans: The expected CAGR of the Power to Gas Market during the forecast period is 10.2%.
Ans: The market size of the Power to Gas Market is valued at USD 43.38 million in 2023.
Get in Touch
