Electrical Conduit Market Report Scope & Overview:
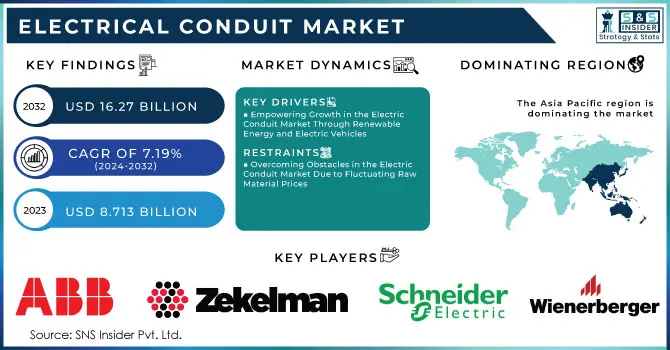
The Electrical Conduit Market Size was valued at USD 8.713 billion in 2023 and is expected to reach USD 16.27 billion by 2032 and grow at a CAGR of 7.19 % over the forecast period 2024-2032.
The electric conduit market is witnessing significant growth, propelled by rapid urbanization and the expansion of smart cities, leading to increased investments in infrastructure projects globally. This surge in infrastructure development has heightened the demand for reliable electrical systems, including electric conduits, which are essential for safely and efficiently powering urban infrastructure such as transportation, telecommunications, and renewable energy sources. According to the International Energy Agency, passenger electric vehicles (EVs) are expected to grow by 23% annually from 2023 to 2035, while electrified fleet applications are projected to increase by 27% per year during the same timeframe.
Electrical Conduit Market Size and Forecast:
-
Market Size in 2023: USD 8.713 billion
-
Market Size by 2032: USD 16.27 billion
-
CAGR: 7.19% from 2024 to 2032
-
Base Year: 2023
-
Forecast Period: 2024–2032
-
Historical Data: 2021–2022
Get More Information on Electrical Conduit Market - Request Sample Report
Government initiatives further underscore the emphasis on upgrading electrical systems to support new technologies, including artificial intelligence and renewable energy sources. For instance, the U.S. Department of Energy has awarded $35 billion to expand and bolster the U.S. electric grid, highlighting the critical role of electric conduits in this infrastructure. The focus on sustainable growth, exemplified by initiatives to enhance EV charging infrastructure and improve energy efficiency, presents additional opportunities for conduit manufacturers. Innovations in conduit materials, such as PVC and fiberglass, are being adopted to meet the evolving needs of smart city projects, thereby enhancing the resilience and reliability of electrical installations. The electric conduit market stands at a pivotal juncture, with its growth intricately linked to broader trends in urban development, renewable energy integration, and technological advancements defining the future of infrastructure.
Electrical Conduit Market Trends
-
Rising investments in infrastructure development, smart cities, and commercial construction projects are significantly driving demand for electrical conduit systems to ensure safe and organized wiring solutions.
-
Rapid urbanization and industrialization across emerging economies are increasing the installation of power distribution networks, boosting the adoption of PVC, steel, and flexible conduits.
-
Growing emphasis on fire safety regulations and electrical safety standards is encouraging the use of high-quality, flame-retardant, and corrosion-resistant conduit materials.
-
Expansion of renewable energy projects, including solar and wind farms, is contributing to higher demand for durable conduit systems to protect cabling in harsh outdoor environments.
-
Technological advancements in lightweight, non-metallic, and corrosion-resistant conduits are improving ease of installation and long-term cost efficiency.
-
Increasing retrofitting and renovation activities in residential and commercial buildings are further supporting steady market growth.
-
Adoption of underground cabling systems and data center expansion is driving the need for advanced conduit solutions that ensure protection, flexibility, and long-term performance.
Electrical Conduit Market Drivers
-
Empowering Growth in the Electric Conduit Market Through Renewable Energy and Electric Vehicles
The electric conduit market is experiencing robust growth, significantly driven by the increasing integration of renewable energy sources such as solar and wind power. As the world shifts towards sustainable energy solutions, the need for efficient and reliable electrical systems has never been more critical. According to a report by the International Renewable Energy Agency (IRENA), the global renewable energy capacity reached 3,064 gigawatts (GW) in 2023, with solar and wind accounting for a substantial share. This surge necessitates the installation of durable electric conduits to manage the complexities of renewable energy systems, ensuring safe and efficient energy distribution.
Moreover, the transition to electric vehicles (EVs) is further supporting this demand. As highlighted in various studies, the integration of EVs into the renewable energy grid can enhance energy storage and distribution, making the electrical infrastructure more resilient. A smart grid, as mentioned in TDWorld, is essential for the successful decarbonization of power systems, requiring advanced wiring solutions like electric conduits to facilitate seamless connections between renewable energy sources and the grid. Government initiatives and policies also play a significant role in promoting renewable energy adoption. As of 2024, numerous countries have set ambitious targets for carbon neutrality, driving investments in renewable infrastructure and, consequently, increasing the demand for electric conduits. For instance, the upcoming U.S. elections have placed a strong emphasis on clean energy policies, with stakeholders advocating for substantial investments in renewable technologies. In summary, the electric conduit market is being propelled by the dual forces of renewable energy integration and the growing electric vehicle ecosystem.
Electrical Conduit Market Restraints
-
Overcoming Obstacles in the Electric Conduit Market Due to Fluctuating Raw Material Prices
The electric conduit market faces considerable challenges due to fluctuating raw material prices, which directly affect production costs and profit margins. Reports indicate that construction material prices are approximately 39% higher than pre-COVID levels, with PVC, fiberglass, and metals being essential components for conduit manufacturing. This price volatility is influenced by geopolitical tensions, such as the ongoing sanctions against Russia, which threaten the stability of raw material supplies. Furthermore, the increasing costs of essential materials have compelled manufacturers across various sectors, including electric vehicle producers, to raise their prices, highlighting a broader trend impacting multiple industries. Market dynamics and supply chain disruptions also contribute to uncertainty in pricing, making it crucial for companies in the electric conduit sector to carefully manage their procurement strategies. Effective management can help mitigate the effects of these fluctuations and maintain competitiveness in the marketplace. Companies like Atkore are well-positioned to benefit from rebounds in construction; however, they must navigate the challenges posed by raw material pricing effectively to capitalize on emerging opportunities in the industry.
Electrical Conduit Market Segment Analysis
By Type
The electric conduit market is primarily divided into rigid and flexible conduits, with rigid conduits dominating the landscape, accounting for approximately 70% of total revenue in 2023. This significant market presence can be attributed to various advantages that rigid conduits offer across multiple applications.
Rigid conduits, typically constructed from materials such as PVC, metal (including steel and aluminum), and fiberglass, provide exceptional durability and strength, making them resistant to impacts, corrosion, and environmental factors. This resilience is particularly beneficial in industrial, commercial, and residential settings where reliable electrical protection is crucial. Furthermore, the use of rigid conduits is often mandated by safety regulations in sectors like construction and manufacturing, ensuring a secure pathway for electrical wiring that minimizes damage risks and enhances installation safety. Their straightforward installation process reduces labour costs and time, making them a favourite among electricians and contractors. The rising demand for electrical infrastructure in construction, manufacturing, and energy sectors, driven by urbanization and smart city initiatives, further bolsters the adoption of rigid conduits. While their initial cost may be higher than flexible options, their longevity and lower replacement frequency make them economically viable for long-term projects, solidifying their market position.
By Material
The electric conduit market is primarily divided into metallic and non-metallic conduits, with metallic options holding a substantial revenue share of approximately 65% in 2023. This strong market presence is attributed to several advantages that metallic conduits provide for various applications. Notably, metallic conduits are typically composed of robust materials like steel and Aluminum, which contribute to their exceptional strength and durability. This makes them ideal for industrial and commercial environments where electrical installations often face harsh conditions and heavy loads. Furthermore, metallic conduits offer enhanced protection against electromagnetic interference (EMI) and radio frequency interference (RFI), making them particularly suitable for sensitive electrical applications in environments with significant electrical noise, such as factories and data centers. Additionally, metallic conduits possess superior fire resistance compared to their non-metallic counterparts, a crucial safety feature that aligns with stringent building codes and regulations. Many metallic conduits are also treated or coated to improve their corrosion resistance, with options like galvanized steel conduits capable of enduring moisture and chemical exposure, thereby extending their lifespan and reducing maintenance costs. The growing investments in infrastructure and smart city initiatives worldwide further amplify the demand for metallic conduits, as urbanization creates a need for reliable electrical systems. Companies like Atkore International and Southwire are actively enhancing their product lines with innovative, corrosion-resistant metallic conduits and solutions designed for flexibility and easy installation, ensuring they meet the evolving needs of the industry and solidifying the market position of metallic conduits.
Electrical Conduit Market Regional Outlook
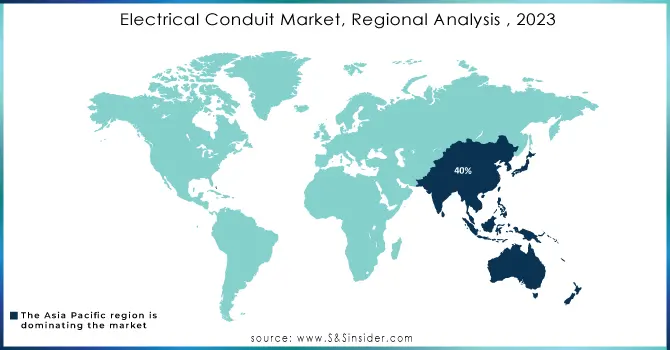
The Asia-Pacific region commands a substantial share of the electric conduit market, accounting for approximately 40% of total revenue in 2023. This dominance is primarily due to rapid urbanization, significant infrastructure development, and extensive investments in renewable energy initiatives. Key players such as China, India, and Japan are leading this growth, spurred by their expanding industrial sectors and urban infrastructure requirements. The ongoing urbanization in these countries drives the demand for electric conduits as new construction projects and infrastructure upgrades necessitate dependable electrical systems, particularly in fast-growing cities. Furthermore, government initiatives promoting renewable energy and smart city projects are bolstering the need for durable electrical solutions. The region's numerous manufacturing hubs, especially in China and India, also fuel the demand for robust electrical installations. In response to this growing market, companies like Schneider Electric have launched innovative modular conduit systems tailored for the Asian market, emphasizing ease of installation and safety. Atkore International has introduced eco-friendly metallic conduits to support sustainable construction practices, while Havells India Limited has unveiled flexible conduits designed to improve installation efficiency. These developments underscore the region's robust market dynamics and companies' commitment to meeting evolving demands.
In 2023, North America distinguished itself as the fastest-growing region in the electric conduit market, driven by several key factors reflecting its strong demand and evolving infrastructure. The growth is primarily cantered in the United States and Canada, spurred by technological advancements, substantial investments in renewable energy, and the urgent need to upgrade aging electrical infrastructure. Aging systems have necessitated extensive upgrades, leading to increased demand for reliable electric conduits, which are essential for modernizing the grid and enhancing electrical safety and efficiency. Innovations in conduit materials and designs have improved performance and installation ease, making them more attractive to electricians and contractors. The shift towards renewable energy sources, such as solar and wind, further propels the need for durable electrical systems that support these initiatives. Additionally, government policies in both countries are promoting renewable energy and sustainable construction, which fosters investment in clean energy projects and drives demand for compliant electrical systems. In the U.S., companies like Southwire and Atkore International are expanding their product offerings to address these market needs, while in Canada, Imperial Manufacturing Group is launching eco-friendly conduit solutions. Knipex Tools LP is also contributing by developing specialized tools that enhance conduit installation efficiency, reflecting the region's dynamic market landscape.
Get Customized Report as per your Business Requirement - Request For Customized Report
Electrical Conduit Market Key Players
Some of the major key players in Electric Conduit Market with product:
-
Atkore International (Electrical Metallic Tubing, Flexible Conduit)
-
ABB Ltd. (Rigid Conduit, Cable Protection Systems)
-
Schneider Electric SE (PVC Conduits, Wiring Ducts)
-
Eaton Corporation (Flexible Metal Conduit, Liquidtight Conduit)
-
Thomas & Betts Corporation (Rigid PVC Conduit, Fittings)
-
Legrand S.A. (Metallic and Non-Metallic Conduits, Cable Management)
-
Aliaxis Group S.A. (PVC Conduits, Polyethylene Conduits)
-
HellermannTyton Group PLC (Wire and Cable Protection, Non-Metallic Conduit)
-
Champion Fiberglass, Inc. (Fiberglass Conduits)
-
Dura-Line Corporation (HDPE Conduits, MicroDucts)
-
Niedax Group (Cable Tray Systems, Conduit Systems)
-
JM Eagle, Inc. (PVC and CPVC Conduits)
-
Panasonic Corporation (Flexible Conduit, Wiring Duct)
-
Prime Conduit, Inc. (High-Density Polyethylene (HDPE) Conduits)
-
SEPCO Industries (Liquidtight Flexible Metal Conduit)
-
Robroy Industries, Inc. (Corrosion-Resistant Conduits, PVC-Coated Conduits)
-
Pipelife International GmbH (Electrical PVC Conduits)
-
King Innovation (Non-Metallic Conduit, Fittings)
-
Electri-Flex Company (Flexible Electrical Conduit, Shielded Conduits)
List of key suppliers of raw materials for electric conduit products:
-
U.S. Steel Corporation
-
ArcelorMittal
-
Nucor Corporation
-
Alcoa Corporation
-
Rio Tinto
-
Reliance Steel & Aluminum Co.
-
BASF SE
-
Dow Chemical Company
-
SABIC (Saudi Basic Industries Corporation)
-
Formosa Plastics Corporation
-
INEOS Group
-
LyondellBasell Industries
-
ExxonMobil Chemical
-
Mitsui Chemicals
-
Shin-Etsu Chemical Co., Ltd.
-
Celanese Corporation
-
Evonik Industries AG
-
Kraton Corporation
-
Covestro AG
-
Arkema Group
Recent Development
-
On October 28, 2024, Caparo Middle East inaugurated a fully-integrated manufacturing plant in Dammam, Saudi Arabia, in partnership with Engineer Sinan Ali Ahmed Bukamseen. This 30,000-sq-ft facility, built with an investment of SAR25 million, aims to produce half a million electrical conduits monthly to meet regional demand and support Saudi Arabia's goal of self-sufficiency in industrial products.
-
In May 2023, ABB opened a $4 million distribution center in Pennsylvania to meet the electrical needs of the U.S. Northeast. The facility, with a $15 million electrical product inventory, aims to strengthen ABB's regional presence and enhance customer service.
| Report Attributes | Details |
|---|---|
| Market Size in 2023 | USD 8.713 Billion |
| Market Size by 2032 | USD 16.27 Billion |
| CAGR | CAGR of 7.19% From 2024 to 2032 |
| Base Year | 2023 |
| Forecast Period | 2024-2032 |
| Historical Data | 2020-2022 |
| Report Scope & Coverage | Market Size, Segments Analysis, Competitive Landscape, Regional Analysis, DROC & SWOT Analysis, Forecast Outlook |
| Key Segments | •By Type (Rigid, Flexible) •By Material (Metallic, Non-Metallic) •By End-Use Industry (Building & Construction, Industrial Manufacturing, IT & Telecommunication, Oil & Gas, Energy & Utility, Others, Healthcare, Marine) |
| Regional Analysis/Coverage | North America (US, Canada, Mexico), Europe (Eastern Europe [Poland, Romania, Hungary, Turkey, Rest of Eastern Europe] Western Europe] Germany, France, UK, Italy, Spain, Netherlands, Switzerland, Austria, Rest of Western Europe]), Asia-Pacific (China, India, Japan, South Korea, Vietnam, Singapore, Australia, Rest of Asia-Pacific), Middle East & Africa (Middle East [UAE, Egypt, Saudi Arabia, Qatar, Rest of Middle East], Africa [Nigeria, South Africa, Rest of Africa], Latin America (Brazil, Argentina, Colombia, Rest of Latin America) |
| Company Profiles | Atkore International, ABB Ltd., Schneider Electric SE, Eaton Corporation, Thomas & Betts Corporation, Legrand S.A., Aliaxis Group S.A., HellermannTyton Group PLC, Champion Fiberglass, Inc., Dura-Line Corporation, Niedax Group, Calpipe Industries, Inc., JM Eagle, Inc., Panasonic Corporation, Prime Conduit, Inc., SEPCO Industries, Robroy Industries, Inc., Pipelife International GmbH, King Innovation, and Electri-Flex Company. |
| Drivers | •Empowering Growth in the Electric Conduit Market Through Renewable Energy and Electric Vehicles |
| Restraints | •Overcoming Obstacles in the Electric Conduit Market Due to Fluctuating Raw Material Prices |
Frequently Asked Questions
Ans: Asia pacific is expected to hold the largest market share in the global Electrical Conduit Market during the forecast period.
Ans: Flexible conduit is projected as the fastest-growing segment in the electrical conduit market due to its ease of installation, affordability, and versatility.
Ans: Safety, comfort, regulations, and sustainability are the major key drivers for the growth of the Electrical Conduit Market.
Ans: Electrical Conduit Market size was USD 8.713 billion in 2023 and is expected to reach USD 16.27 billion by 2032.
Ans: The Electrical Conduit Market is expected to grow at a CAGR of 7.19%.
Get in Touch
