Marine Internet of Things Market Report Scope & Overview:
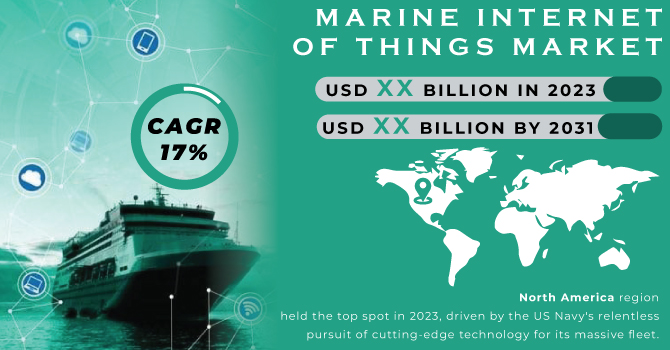
The Marine Internet of Things Market Size was valued to grow at a CAGR of 17% over the forecast period 2024-2031.
The Maritime industry is setting sail for a smarter future with Marine Internet of Things (IoT) technology. By equipping ships with advanced sensors and systems, Marine IoT is driving a wave of efficiency. Imagine sensors that optimize routes (reducing fuel consumption), track equipment (minimizing downtime), and even predict maintenance needs (saving on repair costs). This digital transformation is fueled by several factors.
To get more information on Marine Internet of Things Market - Request Free Sample Report
The global trade market, which carries over 85% of the world's goods by volume, demands ever-increasing efficiency. Marine IoT solutions are perfectly suited to address this challenge, with the market projected to grow at a rate exceeding 6% annually.
Also, the booming cruise industry, a multi-billion dollar market, adds another layer of growth to the Marine IoT market.
Finally, with a focus on sustainability, Marine IoT is embracing renewable energy sources and advancements in hybrid propulsion technology, creating exciting opportunities for the future.
MARKET DYNAMICS
KEY DRIVERS:
-
The rise in both international trade and the cruise industry is propelling the Marine IoT market forward
The maritime industry is experiencing a confluence of factors driving the demand for Marine Internet of Things (IoT) solutions. The international trade sector, which forms the backbone of global commerce, witnesses an astounding 85% of the world's goods transported by sea volume. This burgeoning trade necessitates increasingly efficient shipping solutions, and Marine IoT presents itself as a compelling answer. By leveraging sensor technology and data analytics, Marine IoT offers features such as route optimization and real-time equipment monitoring, leading to streamlined operations and cost reduction.
-
Rising global trade necessitates ever-more efficient shipping solutions.
RESTRAIN:
-
The increased reliance on interconnected systems creates new cybersecurity risks.
-
The maritime industry lacks uniform data regulations and standardization across different regions.
OPPORTUNITY:
-
The vast amount of data collected by Marine IoT can be further analyzed using advanced analytics and AI to unlock even greater efficiency gains
As data collection through Marine IoT grows, opportunities arise for leveraging advanced analytics and artificial intelligence (AI) for even greater efficiency gains. Predictive maintenance can be further refined, and real-time route optimization can become even more sophisticated.
-
The adoption of renewable energy on ships is expected to accelerate the demand for Marine IoT solutions.
CHALLENGES:
-
Reliable and high-speed internet connectivity remains a challenge in many maritime regions.
IMPACT OF RUSSIA UKRAINE WAR
Disruptions in the supply chain for electronics components, heavily concentrated in Russia and Ukraine, threaten chip shortages and hinder Marine IoT hardware production. A recent report estimated a potential 15% decline in electronic device production due to this. Additionally, rising oil prices (surpassing $100 per barrel in some regions) coupled with disrupted supply chains are pushing up Marine IoT hardware and software costs, potentially by 8% in the coming year. This could dampen investment, especially for smaller companies. Cybersecurity concerns are another worry, as increased global tension makes Marine IoT systems, with their expanded connectivity, vulnerable to attacks.
IMPACT OF ECONOMIC SLOWDOWN
Tightened budgets due to lower profits might lead shipping companies to delay or scale back investments in Marine IoT, previously expected to grow by over 6% annually. Analysts now predict a potential slowdown of 2-4% in the next two years. Economic downturns also put pressure on short-term gains, making the high upfront costs of Marine IoT less appealing despite its long-term efficiency benefits (like 10-15% cost savings). Furthermore, a global slowdown often translates to a decrease in international trade, a sector that relies heavily on shipping (carrying over 85% of global goods). This decline could weaken the incentive for shipping companies to invest in efficiency solutions like Marine IoT.
KEY MARKET SEGMENTS
By Component
-
Sensing Devices
-
Network Connectivity
-
IoT Platforms
-
IT Solutions & Services
By Ship Type
-
Commercial
-
Defense
Commercial dominated the Marine Internet of Things (IoT) market in 2023, reflecting the growing use of IoT for efficient route planning and streamlined ship operations. This dominance applies across the entire commercial shipping landscape, encompassing cargo vessels (container ships, bulk carriers, tankers, general cargo), passenger vessels (yachts, cruise ships, ferries), and even specialty vessels like fishing boats, tugs, dredgers, research vessels, and submarines.
By Application
-
Route And Operation Optimization
-
Asset Tracking
-
Equipment Monitoring
The dominance of the route and operation optimization segment in the 2023 Marine IoT market reflects the growing importance of IoT in optimizing routes and streamlining ship operations.
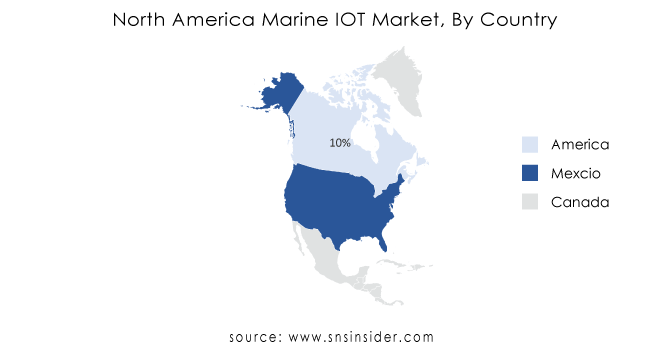
REGIONAL ANALYSIS
North America region held the top spot in 2023, driven by the US Navy's relentless pursuit of cutting-edge technology for its massive fleet. The presence of major IoT solution providers like Cisco Systems further strengthens North America's position. However, the high dependence of Canada on the US for such technology limits its individual market size.
Asia-Pacific (APAC) region is projected to be the fastest growing market, with China and India leading the charge. Their increasing investments in defense spending and new naval vessels are fueling the demand for Marine IoT solutions. Additionally, the booming seaborne trade in this region creates another growth driver. Territorial disputes between China, South Korea, and North Korea further incentivize military modernization and Marine IoT adoption across APAC.
Need any customization research on Marine Internet of Things Market - Enquiry Now
REGIONAL COVERAGE:
North America
-
US
-
Canada
-
Mexico
Europe
-
Eastern Europe
-
Poland
-
Romania
-
Hungary
-
Turkey
-
Rest of Eastern Europe
-
-
Western Europe
-
Germany
-
France
-
UK
-
Italy
-
Spain
-
Netherlands
-
Switzerland
-
Austria
-
Rest of Western Europe
-
Asia Pacific
-
China
-
India
-
Japan
-
South Korea
-
Vietnam
-
Singapore
-
Australia
-
Rest of Asia Pacific
Middle East & Africa
-
Middle East
-
UAE
-
Egypt
-
Saudi Arabia
-
Qatar
-
Rest of the Middle East
-
-
Africa
-
Nigeria
-
South Africa
-
Rest of Africa
-
Latin America
-
Brazil
-
Argentina
-
Colombia
-
Rest of Latin America
KEY PLAYERS
The major players are Ericsson AB, Orange Business Services, Wartsila Oyj Abp, Wilhelmsen Holding ASA, NTT Group, Cisco Systems, Inc., Marine Digital GmbH, Vodafone Group Plc, Accenture Plc, Dualog AS, and other players
RECENT TRENDS
-
Magellan X leading digital solutions provider is developing cutting-edge Industrial IoT (IIoT) and AI platforms on March 9, 2023. These platforms are designed to help maritime and other heavy industries achieve their Environmental, Social, and Governance (ESG) sustainability goals.
-
Zamil Offshore, On December 1, 2022, this offshore services leader announced a partnership with Inmarsat to deploy internet-of-things (IoT) infrastructure on 60 vessels operating in the Gulf region.
Orange Business Services-Company Financial Analysis
| Report Attributes | Details |
|---|---|
| Market Size in 2023 | US$ xx Billion |
| Market Size by 2031 | US$ xx Billion |
| CAGR | CAGR of 17% From 2024 to 2031 |
| Base Year | 2023 |
| Forecast Period | 2024-2031 |
| Historical Data | 2020-2022 |
| Report Scope & Coverage | Market Size, Segments Analysis, Competitive Landscape, Regional Analysis, DROC & SWOT Analysis, Forecast Outlook |
| Key Segments | • By Component (Sensing Devices, Network Connectivity, IoT Platforms, and IT Solutions & Services) • By Application (Route and Operation Optimization, Asset Tracking, and Equipment Monitoring) • By Ship Type (Commercial and Defense) |
| Regional Analysis/Coverage | North America (US, Canada, Mexico), Europe (Eastern Europe [Poland, Romania, Hungary, Turkey, Rest of Eastern Europe] Western Europe] Germany, France, UK, Italy, Spain, Netherlands, Switzerland, Austria, Rest of Western Europe]), Asia Pacific (China, India, Japan, South Korea, Vietnam, Singapore, Australia, Rest of Asia Pacific), Middle East & Africa (Middle East [UAE, Egypt, Saudi Arabia, Qatar, Rest of Middle East], Africa [Nigeria, South Africa, Rest of Africa], Latin America (Brazil, Argentina, Colombia Rest of Latin America) |
| Company Profiles | Ericsson AB, Orange Business Services, Wartsila Oyj Abp, Wilhelmsen Holding ASA, NTT Group, Cisco Systems, Inc., Marine Digital GmbH, Vodafone Group Plc,Accenture Plc, Dualog AS. |
| DRIVERS |
• The rise in both international trade and the cruise industry is propelling the Marine IoT market forward |
| RESTRAINTS |
• The increased reliance on interconnected systems creates new cybersecurity risks. |
Frequently Asked Questions
North America held the greatest market share. Asia Pacific market in the area is also expected to grow at the fastest rate during the forecast period, owing to increased defence spending in India and China
The current Marine Internet of Things Market forecast for market growth by 2031 is expected to be lower than the previous COVID-19 estimates. The epidemic has had a devastating effect on the global defense industry.
Expensive Initial Investment and Cyber attacks Pose a Risk
The sample for the Marine Internet of Things Market report is available on the website upon request. To obtain the sample report, you can also use the 24*7 chat support and direct call services.
Yes, this report cover top down , bottom up Quantitative Research. Qualitative Research, Fundamental Research, data triangulation, ID’s & FGD’s Analytical research, And other as per report requirement.
Get in Touch
