Mass Spectrometry Market Report Scope & Overview:
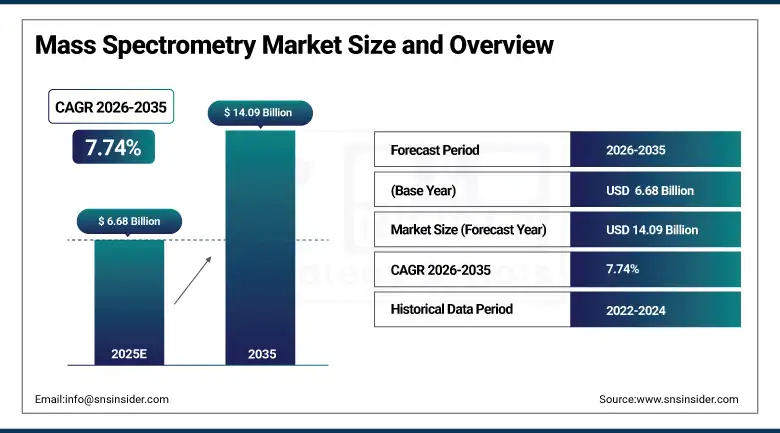
The Mass Spectrometry Market size was valued at USD 6.68 Billion in 2025 and is projected to reach USD 14.09 Billion by 2035, growing at a CAGR of 7.74% over the forecast period of 2026-2035.
Mass Spectrometers Market Future Growth Scenario: Global mass spectrometry market is stimulated by increasing implementation of mass spectrometry instruments in pharmaceutical and biopharmaceutical manufacturing, clinical diagnostics and omics research. Background: Use of mass spectrometry in research and industrial workflows has growing opportunities due to rapid increase in drug discovery activities, lack of rapid and accurate analytical tools for complex biological samples, and growing need for sensitive trace-level detection. Deep investment by major players of life science instrumentation and research organizations together with supportive regulatory frameworks for laboratory analytical devices can result in lucrative and high global market growth opportunities. Mass spectrometry witnessed its tremendous deployment due to the initiation of the COVID-19 pandemic whereupon it was used for pathogen detection, and biomarker identification during vaccine studies.
In January 2025, regulatory bodies cleared 38 new mass spectrometry-based clinical diagnostic assays, a 27% year to year increase that reflects the accelerating adoption of LC-MS and ICP-MS platforms in routine clinical laboratory and diagnostic workflows.
Mass Spectrometry Market Size and Forecast:
-
Market Size in 2025: USD 6.68 Billion
-
Market Size by 2035: USD 14.09 Billion
-
CAGR: 7.74% from 2026 to 2035
-
Base Year: 2025
-
Forecast Period: 2026–2035
-
Historical Data: 2022–2024
To Get more information On Mass Spectrometry Market - Request Free Sample Report
Mass Spectrometry Market Trends:
-
Wider use of hybrid mass spectrometry systems such as triple quadrupole and Q-ToF instruments for improved sensitivity and multi-analyte quantification in pharmaceutical and clinical applications.
-
Growing integration of LC-MS and GC-MS platforms in food safety testing and environmental monitoring to address regulatory compliance and trace contaminant detection.
-
Expansion of ICP-MS applications in elemental analysis across pharmaceutical, environmental, and petrochemical industries driven by ultra-trace detection capability.
-
Increasing use of mass spectrometry-based omics platforms for biomarker discovery, precision medicine, and large-scale proteomics and metabolomics profiling in research.
-
Miniaturization trends enabling portable and field-deployable mass spectrometry instruments for on-site environmental testing, forensics, and industrial quality control.
-
Rise of software platforms integrating AI and machine learning for automated spectral interpretation, data management, and multi-omics data integration.
-
Development of next-generation ion trap and time-of-flight instruments with enhanced mass accuracy for complex biological sample characterization and clinical diagnostics.
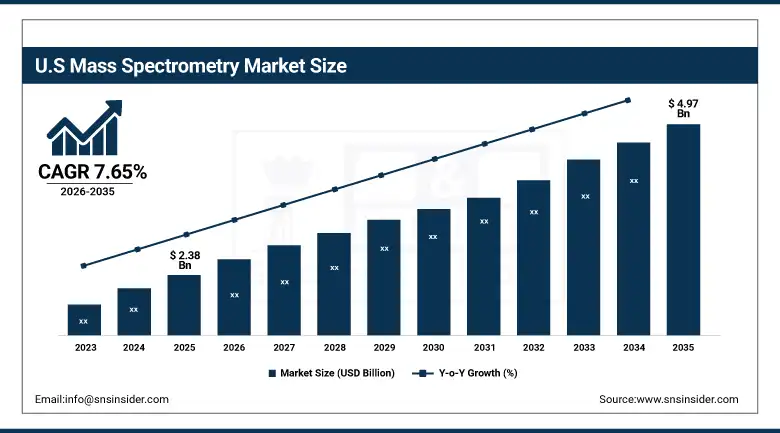
The UnitedStates Mass Spectrometry Market is estimated at USD 2.38 billion in 2025 and is expected to reach USD 4.97 billion by 2035, growing at a CAGR of 7.65% from 2026-2035. The U.S. holds the maximum market share as the U.S. mass spectrometry market is highly impacted by the advanced pharmaceutical and biotechnology research infrastructure, high R&D expenditure, and the presence of world-leading instrumentation manufacturers and contract research organizations. Rising government investment in precision medicine, higher per capita healthcare spending, and quick adoption of mass spectrometry-based clinical diagnostics and forensic toxicology testing are boosting the market growth.
Mass Spectrometry Market Growth Drivers:
-
Rising Demand for Mass Spectrometry in Pharmaceutical and Biopharmaceutical Manufacturing Driving Market Growth
Growing application of mass spectrometry instruments in pharmaceutical and biopharmaceutical manufacturing is a key factor driving the growth of the global mass spectrometry market. Quantification of small molecules, biologics, and metabolites using triple quadrupole and hybrid platforms improves analytical accuracy and regulatory compliance throughout drug development and quality control. Integration of LC-MS systems within GMP environments and widespread adoption for pharmacokinetic studies, impurity profiling, and biosimilar characterization have hastened clinical adoption. By addressing the growing complexity of biologic drug molecules and the stringent requirements of FDA and EMA regulatory submissions, these instruments are helping pharmaceutical companies reduce time-to-market.
For example, in February 2025, leading biopharmaceutical manufacturers reported an average 35% reduction in analytical testing timelines for biosimilar characterization workflows after adopting advanced hybrid mass spectrometry platforms, significantly improving batch release efficiency.
Mass Spectrometry Market Restraints:
-
High Instrument Costs and Skilled Workforce Requirements Restricting Market Expansion
The high cost of mass spectrometry instruments and the need for trained analytical personnel limit the mass spectrometry market. However, the high initial cost linked with next-generation hybrid and high-resolution systems along with recurring calibration, software licensing, and maintenance costs are likely limiting favour to financial constraints of small and medium size labs, academic institutions and environmental testing sector particularly in developing economies. Given that most MS systems are big-ticket items, the cost of MS systems makes their use in budget-limited settings even more difficult to justify. Where MS systems are used, the complexity of interpreting the resulting data further restricts their adoption in settings of limited access to specialist scientific talent.
Mass Spectrometry Market Opportunities:
-
Expansion of Omics Research and Precision Medicine Creating Large Market Opportunities
Due to the increased development in the omics research and personalized medicine field, mass spectrometry can find a lot of market opportunities. In proteomics, metabolomics and genomics, mass spectrometry platforms play a central role in high-throughput biomolecular profiling that enables biomarker discovery, disease stratification, and targeted therapy development. New precision diagnostics and drug target identification frontiers are being opened with machine learning incorporated into traditional data analysis tools, multi-omics integration frameworks and expanding single-cell proteomics capabilities. When these mass spectrometry capabilities are integrated with next-generation sequencing, together with enabling real-world sequence-driven clinical data, they potentially provide the basis for a new generation of tests and therapeutics for oncology, rare metabolic disorders, and infectious diseases.
For example, in March 2025, a multi-center academic consortium using high-resolution mass spectrometry-based proteomics identified five novel plasma biomarkers for early-stage pancreatic cancer detection with 94% sensitivity, demonstrating the growing role of mass spectrometry in next-generation clinical diagnostics.
Mass Spectrometry Market Segment Analysis:
-
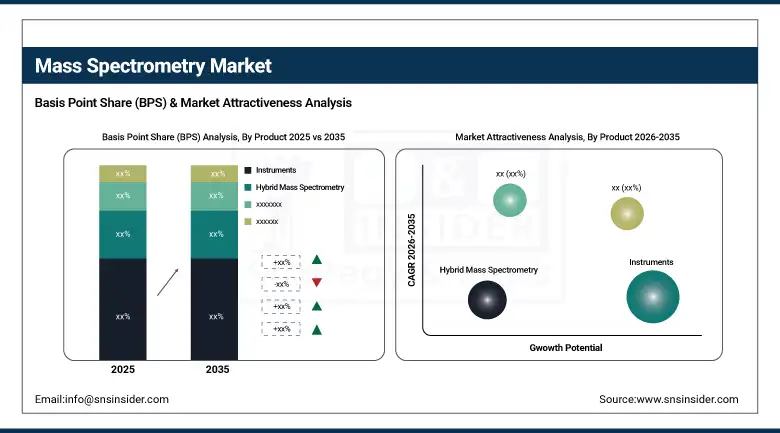
By Product, the Instruments segment accounted for the largest share of 71.34% in 2025, and the Software & Services segment is anticipated to exhibit the fastest growth, at a CAGR of 8.92%.
-
By Sample preparation technique, the LC-MS segment has registered the highest market share of about 43.28% in 2025, followed by the ICP-MS segment, which is anticipated to register the highest CAGR of 9.15%.
-
By Application, the pharma-biopharma manufacturing segment held the highest market share of about 28.47% in 2025, while the OMICS research segment is expected to register the highest CAGR of 9.38%.
-
By End User, pharmaceutical companies led the market with a share of nearly 32.56% in 2025, while the biotechnology companies segment is expected to be the fastest-growing segment with a CAGR of 9.21%.
By Product, Instruments Segment Leads the Market, While Software & Services Registers Fastest Growth
In 2025, the instruments segment contributed more than 71.34% revenue share owing to the sustained demand for triple quadrupole, Q-ToF, and hybrid mass spectrometry platforms across pharmaceutical, environmental, and clinical research end users. The advancement of high-resolution instrumentation, enhanced sensitivity of ion trap and time-of-flight systems, and growing replacement cycles of legacy analytical platforms in research laboratories are major enablers. On the other hand, the software & services segment is expected to record the highest CAGR of almost 8.92% between 2026 and 2035. The expansion is driven by the growing need for integrated data management solutions, AI-powered spectral analysis software, and support and maintenance agreements that help laboratories optimize instrument uptime and analytical throughput.
By Sample Preparation Technique, LC-MS Leads and ICP-MS Registers Fastest Growth
The LC-MS segment represented the largest share of the mass spectrometry market with around 43.28% in 2025, due to its broad applicability across pharmaceutical drug quantification, clinical biomarker analysis, food safety testing, and environmental monitoring workflows. The critical drivers of this segment include versatility of liquid chromatography-mass spectrometry coupling for complex biological matrices, improvements in LC-MS/MS sensitivity and throughput, and successful regulatory validation across a wide spectrum of analytical applications. The ICP-MS segment is expected to grow at the highest rate with a CAGR of around 9.15% over the forecast period of 2026-2035, driven by increasing demand for ultra-trace elemental analysis in pharmaceutical purity testing, environmental contaminant monitoring, and food safety heavy metal detection.
By Application, Pharma-Biopharma Manufacturing Dominates, While OMICS Research Shows Rapid Growth
The pharma-biopharma manufacturing segment held the largest revenue share of around 28.47% in 2025 as mass spectrometry has seen very high acceptance in drug development pipelines, biologic characterization workflows, and GMP-compliant quality control environments. The growth of this segment is mainly attributed to the increasing complexity of biopharmaceutical molecules requiring high-resolution structural analysis, rising biosimilar approvals demanding comparability studies, and proven ability of mass spectrometry to deliver precise quantification and impurity profiling. From 2026 to 2035, the OMICS research segment is anticipated to witness the highest CAGR of 9.38%, specifically attributed to the exponential growth of multi-omics datasets, increasing government research funding, and the critical role of mass spectrometry in translating genomic and proteomic discoveries into clinically actionable insights.
By End User, Pharmaceutical Companies Lead, While Biotechnology Companies Segment Grows the Fastest
The pharmaceutical companies category held the largest revenue share of 32.56% in the mass spectrometry market in 2025, on account of the critical reliance of the pharmaceutical industry on mass spectrometry for drug discovery, ADME profiling, metabolite identification, and GMP quality assurance. This will be driven by the need to improve analytical precision in regulatory submissions, reduce development timelines, and support the characterization of complex large-molecule therapeutics. However, is anticipated to observe the highest CAGR of 9.21% during the forecasted period of 2026-2035 in the biotechnology companies segment owing to the rapid expansion of biotech R&D pipelines, growing application of mass spectrometry in cell and gene therapy development, and increasing integration of proteomics and metabolomics workflows in biologics discovery programs.
Regional Analysis:
North America Mass Spectrometry Market Insights:
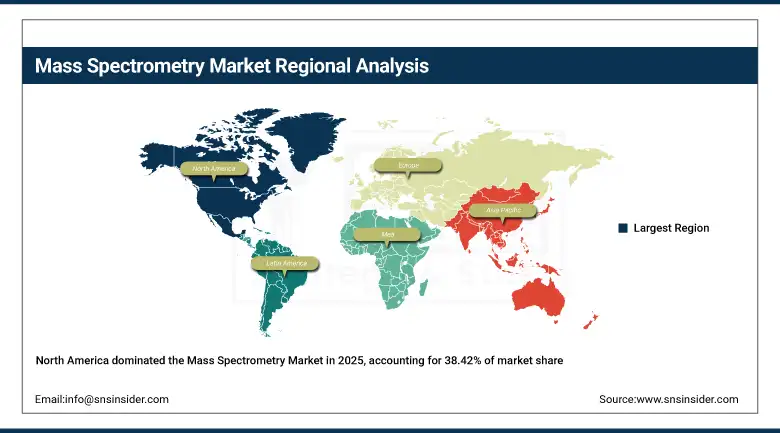
The mass spectrometry market in North America recorded the highest revenue share of 38.42% in 2025 owing to presence of a well-established life science research ecosystem, high pharmaceutical and biotechnology R&D expenditure, and early adoption of next-generation mass spectrometry platforms. The key enablers are the concentration of globally leading mass spectrometry instrument manufacturers, world-class research universities and clinical laboratories conducting advanced omics and biomarker research, and favorable FDA regulatory guidance supporting mass spectrometry-based drug testing and clinical diagnostics. It is also supported by substantial NIH and government research funding, active collaborations between technology companies and healthcare institutions, and a highly skilled analytical science workforce.
Get Customized Report as per Your Business Requirement - Enquiry Now
Asia Pacific Mass Spectrometry Market Insights:
Asia Pacific market is expected to be the fastest growing regional market with a CAGR of 9.12% over the period 2026 to 2035 due to rapid growth in pharmaceutical manufacturing, increasing government expenditure on life science research infrastructure, and soaring number of environmental and food safety testing mandates in the region. The major growth is driven, large and growing pharmaceutical industries in China, India, and South Korea creating high demands for analytical instrumentation, increasing food adulteration with regulatory testing accelerating, and government frameworks that encourage innovation in clinical diagnostics and precision medicine. Strong technology infrastructure in the region, a rise of VC interest towards life science instrumentation, and collaborations between industry players and academic institutions to tackle region-specific analytical problems
Europe Mass Spectrometry Market Insights:
European region accounts for the second most dominant market for mass spectrometry after North America. Solid government support for analytical chemistry research and environmental monitoring, the availability of extensive publicly funded biobank and patient data resources through national health systems, and globally recognized research institutes driving innovation in clinical mass spectrometry are all driving forces behind the market. Reasons for the growth of the mass spectrometry market in Europe are coordinated EU initiatives for health data interoperability, transnational research collaborations on precision medicine and omics science, and increasing adoption of mass spectrometry to address pharmaceutical quality assurance and environmental regulatory compliance challenges.
Latin America (LATAM) and Middle East & Africa (MEA) Mass Spectrometry Market Insights:
Mass Spectrometry Market in Latin America & Middle East & Africa would be driven by increasing investments in pharmaceutical manufacturing infrastructure, rising penetration of laboratory automation enabling broader access to analytical instrumentation, and government initiatives to strengthen food safety and environmental testing frameworks. The major factors for growing include expansion of contract research and testing organizations creating new demand for mass spectrometry platforms, partnerships with international instrument manufacturers to deploy cost-effective analytical solutions, and emphasis on improving clinical diagnostics and forensic toxicology capabilities. There is an increasing number of startups and regional academic institutions developing mass spectrometry applications relevant to local disease burden and industrial testing requirements.
Mass Spectrometry Market Competitive Landscape:
Founded in 2006, Thermo Fisher Scientific utilizes its dual-impact mass spectrometry in offering comprehensive Orbitrap, triple quadrupole, and ion trap platforms to provide analytical solutions for pharmaceutical, clinical, environmental, and omics research applications through the industry leading instrument and software ecosystem.
-
In January 2025, launched the Orbitrap Astral mass spectrometer with enhanced single-cell proteomics capabilities and AI-assisted data acquisition software, enabling researchers to achieve 40% greater protein identification depth in complex biological samples.
Agilent Technologies: With its long history starting from 1999 of analytics and informatics, it provides customized LC-MS, GC-MS, and ICP-MS solutions to customers focused on the pharmaceutical, environmental, food safety, and clinical research markets around the world through an extensive portfolio of instruments and data analysis platforms.
-
In November 2024, introduced a next-generation triple quadrupole LC-MS/MS system optimized for high-throughput clinical laboratory newborn screening and toxicology workflows, demonstrating 99.2% method concordance with validated reference standards across 250 metabolites.
Waters Corporation (est 1958): Merged mass spectrometry platforms (ACQUITY and Xevo) with chromatography and informatics solutions for pharmaceutical, clinical and food safety customers with needs for high sensitivity quantitative analysis and structural characterization.
-
In February 2025, expanded its SELECT SERIES and Xevo mass spectrometry portfolio with four new application-specific instrument configurations for oligonucleotide and antibody-drug conjugate characterization, addressing growing analytical demands of next-generation biotherapeutic development.
Mass Spectrometry Market Key Players:
-
Thermo Fisher Scientific
-
Agilent Technologies
-
Waters Corporation
-
Bruker Corporation
-
Shimadzu Corporation
-
AB Sciex
-
JEOL Ltd.
-
Revvity
-
Leco Corporation
-
Hiden Analytical
-
908 Devices
-
Dani Instruments
-
Bayspec
-
OI Analytical
-
Fasmatech
-
SpectraLab Scientific
-
Trace Analytics
-
Markes International
-
Microsaic Systems
-
Purspec Technologies
| Report Attributes | Details |
|---|---|
| Market Size in 2025 | USD 6.68 Billion |
| Market Size by 2035 | USD 14.09 Billion |
| CAGR | CAGR of 7.74% From 2026 to 2035 |
| Base Year | 2025 |
| Forecast Period | 2026-2035 |
| Historical Data | 2022-2024 |
| Report Scope & Coverage | Market Size, Segments Analysis, Competitive Landscape, Regional Analysis, DROC & SWOT Analysis, Forecast Outlook |
| Key Segments | • By Product (Instruments, Hybrid Mass Spectrometry, Triple Quadrupole, Quadrupole ToF (Q-ToF), Single Mass Spectrometry, Quadrupole, Time-Of-Flight (ToF), Ion Trap, Software & Services) • By Sample Preparation Technique (GC-MS, LC-MS, ICP-MS, Others) • By Application (OMICS Research (Genomics, Proteomics and Metabolomics), Drug Discovery, Environmental Testing, Food Testing, Pharma-Biopharma Manufacturing, Clinical Diagnostics, Applied Industries, Other) • By End User (Pharmaceutical Companies, Biotechnology Companies, Research Labs & Academic Institutes, Environmental Testing Labs, F&B Industry, Forensic Labs, Petrochemical Industry, Other) |
| Regional Analysis/Coverage | North America (US, Canada, Mexico), Europe (Eastern Europe [Poland, Romania, Hungary, Turkey, Rest of Eastern Europe] Western Europe] Germany, France, UK, Italy, Spain, Netherlands, Switzerland, Austria, Rest of Western Europe]), Asia Pacific (China, India, Japan, South Korea, Vietnam, Singapore, Australia, Rest of Asia Pacific), Middle East & Africa (Middle East [UAE, Egypt, Saudi Arabia, Qatar, Rest of Middle East], Africa [Nigeria, South Africa, Rest of Africa], Latin America (Brazil, Argentina, Colombia, Rest of Latin America) |
| Company Profiles | Thermo Fisher Scientific, Agilent Technologies, Waters Corporation, Bruker Corporation, Shimadzu Corporation, AB Sciex, JEOL Ltd., Revvity , Leco Corporation, Hiden Analytical, 908 Devices, Dani Instruments, Bayspec, OI Analytical, Fasmatech, SpectraLab Scientific, Trace Analytics, Markes International, Microsaic Systems, Purspec Technologies. |
Frequently Asked Questions
Ans: The Mass Spectrometry Market size was valued at USD 6.68 billion in 2025 and is projected to reach USD 14.09 billion by 2035.
Ans: The Mass Spectrometry Market is expected to grow at a CAGR of 7.74% over the forecast period.
Ans: Rising demand for mass spectrometry instruments in pharmaceutical and biopharmaceutical manufacturing is a key factor driving the market growth.
Ans: The Instruments segment dominated the market with a share of about 71.34% in 2025.
Ans: North America dominated the market, holding the highest revenue share of 38.42% in 2025.
Get in Touch
