image

Medical Reference Apps Market Size, Share & Segmentation, By Application (Drug Information, Medical Condition & Symptoms Management, Medical Calculators, Clinical Guidelines, and Others), Platform (Android, iOS, Others), and Apps (Smartphones, Tablets), End-Use (Healthcare Providers, Patients, and Others), and Region | Global Forecast for 2025-2032

Date: August 2025 Report Code: SNS/HC/8063 Page 360

Medical Reference Apps Market Report Scope & Overview:

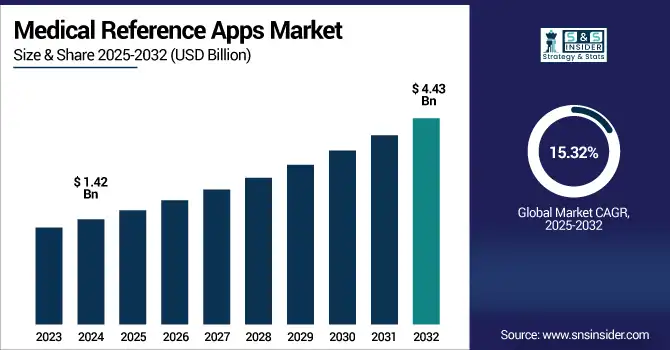
The medical reference apps market size was valued at USD 1.42 billion in 2024 and is expected to reach USD 4.43 billion by 2032, growing at a CAGR of 15.32% over the forecast period of 2025-2032.

Medical-Reference-Apps-Market. revenue analysis

To Get more information on Medical Reference Apps Market - Request Free Sample Report

The global medical reference apps market is growing rapidly, driven by expanding smartphone penetration, increased demand for point-of-care clinical decision tools, and growing popularity among healthcare professionals and medical students. High usability, real-time updates, and exhaustive EHR integration have driven adoption. Moreover, AI-driven diagnostics and customized medical content have expanded app functionality. As global healthcare trends toward digitalization, the market will grow exponentially and is expected to reach exceptional levels by 2032 in developed and emerging regions.

The U.S. medical reference apps market size was valued at USD 0.41 billion in 2024 and is expected to reach USD 1.25 billion by 2032, growing at a CAGR of 14.84% over the forecast period of 2025-2032.

The North American medical reference apps market is dominated by the United States, as the country is the undisputed smartphone use among healthcare professionals. EHR-integrated clinical apps are standard, with such popular providers as Epocrates and Medscape dominating the industry. The U.S. boasts an advanced healthcare IT infrastructure and legislation favorable to digital health.

Market Dynamics:

Drivers:

  • Rising Prevalence of Smartphones and mHealth Technology is Leading the Market Growth

The global spread of smartphones, which is on the rise all over the globe, has revolutionized the way doctors consult medical information. For reason of rapid internet and mobile expansion, Clinicians presently display a greater tendency to use smartphones as a quick and reliable reference during routine work. Finding what you need to help make a patient care decision has never been easier. Stay current on the latest oncology and medical news, including new drug approvals and label changes, on our apps. This movement to mobile health (mHealth) is particularly pronounced among urban-based hospitals and clinics as doctors want tools that enable them to move faster and not rely on desktops or printed manuals.                                                                                    

The widespread proliferation of mobile health tools is evident in that the number of health-related applications on the Apple and Google app stores exceeded 100,000 in 2022, as reported in Digital Health Interventions through Science Direct.

In an alum study (ScienceDirect, 2024), Saudi Arabian doctors revealed ease of access, clinical relevance, and workflow compatibility as significant enabling factors behind their uptake of mHealth applications.

A Nature study of European general practitioners who used digital health reported that it results in better care and more job satisfaction; perceived barriers were the cost, technical literacy, and reimbursement schemes.

  • Rising Demand for Point-of-Care Clinical Decision Support is Escalating the Growth of the Market

Health professionals are increasingly expected to deliver timely, accurate, and evidence-based care, nowhere more so than in high-pressure settings, such as emergency rooms and ICUs. Medical reference apps address this by providing clinical decision support in real time at the bedside. Such applications help to confirm the identity of a drug, assist in diagnosing conditions, plan treatment, and assess risks, all in seconds. This not only increases clinical workflow efficiency, but it also contributes to minimizing human error and promoting patient safety. Therefore, these tools have become a critical need for clinicians who make critical decisions in keeping with evidence-based trends in medical knowledge.

DynaMed received the Best in KLAS award for clinical decision support in mid-2025, demonstrating that the industry continues to prioritize fast, reliable access to the latest medical knowledge for clinicians.

Restraint

  • Limited Clinical Validation and Regulatory Safeguards are Restraining the Market from Growing

A lot of medical reference apps do not undergo the rigours of clinical trials and aren’t validated by medical bodies, as they are developed by private companies or third-party developers. Unlike pharmaceuticals or medical devices that must undergo rigorous regulatory scrutiny, these apps can hit the market with little oversight. This raises important questions about their accuracy, reliability, and safety, especially if used for clinical interventions or drug interaction screening.

Healthcare providers are naturally cautious of using non-peer-reviewed, non-certified apps from organizations, such as the US FDA and European Medicines Agency (EMA). Without this validation, any subsequent medical advice or references given may be stale, incorrect, or inconsistent, jeopardizing patient safety and disrupting clinical workflow. This persistence of distrust severely hampers the adoption of the technology into hospitals, clinics, or schools.

Segmentation Analysis:

By Application

The drug information segment dominated the medical reference apps market share in 2024 with 32.64%, as there is an urgent requirement for authentic, current drug information at the point of care. The drug interaction and dosing safety message sourcing metrics are for an App that is continually used by healthcare professionals to find drug interactions, dosage information, contraindications, and adverse effect profiles, necessary for safe prescribing and patient care. Furthermore, the development of extensive drug databases within mobile platforms by major industry participants, such as Epocrates and IBM Micromedex has made it part of the daily routine of a clinician and pharmacist globally.

The fastest growth during the forecast period is anticipated for the medical condition & symptoms management segment, which continues to be driven by the growing use of apps for initial diagnosis, triage, and monitoring of diseases. These are becoming increasingly popular among healthcare providers and patients, particularly in resource-poor and remote environments, where quick access to medical expertise may be limited. Improvements in AI and machine learning have also improved the accuracy and individualization of symptom-checking apps, which have become a useful tool in current patient-centered care delivery.

By Platform

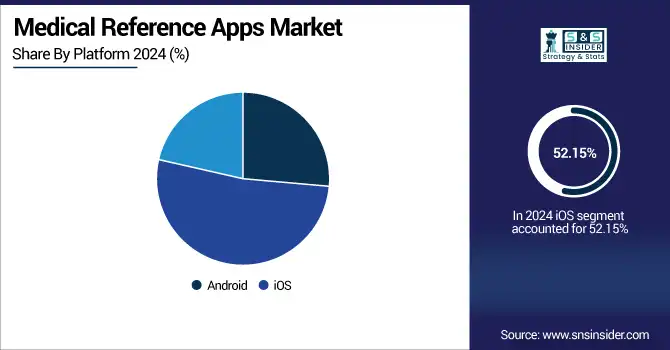
The iOS segment held the largest share of the medical reference apps market in 2024 with a 52.15% market share, primarily due to the majority of clinicians prefer iOS platforms compared to Android platforms, especially in developed countries, such as North America and Europe. iOS stands for stable operating environment, predictable performance, and high standards in the quality of Apps suited for the clinical environment.

The android segment is expected to exhibit the fastest growth over the forecast period, as android is available at large and affordable rates, and its increasing adoption in the developing countries, including Asia Pacific, Latin America, and Africa. The open-source availability of Android facilitates customization and local app development, which accounts for its popularity in regions with diverse healthcare requirements. With the increased penetration of smartphones and the internet in developing nations, there is great potential for the growth of Android-based medical reference applications.

Medical-Reference-Apps-Market-By-Platform

By Apps

The smartphones segment held the largest share of the medical reference apps market growth in 2024 as they are readily available, can be easily carried, and are connected constantly to the internet, thus are efficient in providing instant information at the point of care. Smartphones are generally used by most healthcare workers due to their convenience, speed, and availability of numerous medical reference applications. Meanwhile, ongoing app updates, easy-to-use interfaces, and compatibility with other mobile tools have cemented smartphones as the dominant platform for how medical reference content.

The tablet segment is anticipated to grow significantly over the forecast period as the greater screen size and superior display quality of Tablets, facilitating optimal perception of complicated medical images, anatomical models, and interactive content. Tablets are being used more at clinical rounds, telemedicine visits, and in educational scenarios that require detailed information and multitasking. With more hospitals and schools issuing tablets to their staff, the market for tablet-based medical reference apps is poised for significant growth.

By End-Use

The healthcare Providers segment held the largest share of the medical reference apps market in 2024, with a 54.09% market share. The segment’s growth is rising as these applications have been adopted by the majority of physicians, nurses, and pharmacists in the form of drug databases, treatment guidelines, and a diagnostic aid tool for clinical help in medical practices and thus saving time and avoiding errors. Their deep integration into EHRs and hospital information systems helped cement their widespread use in day-to-day clinical practice, both in hospital and outpatient settings.

The others segment (medical students, academic researchers, public health workers, and policy makers) will likely expand at the highest CAGR during the forecast period. This is being shaped by a growing emphasis on digital learning, remote education, and data-centric healthcare provision. Medical students are becoming increasingly dependent on apps for anatomy, diagnostics, and exam revision, and public health workers and policymakers are using the apps to gain access to real-time data and clinical guidelines. The proliferation of open-access medical education and research platforms is also expediting adoption among this heterogeneous base of users.

Regional Analysis:

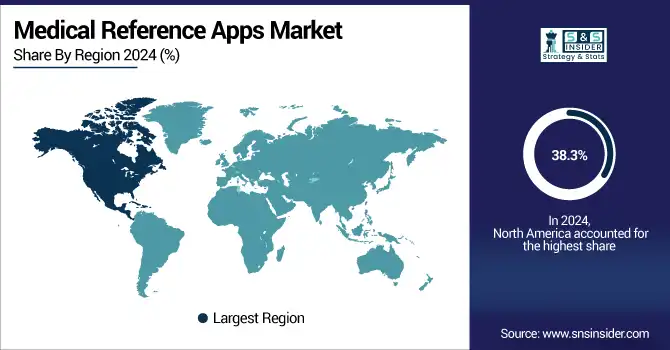
North America dominated the medical reference apps market analysis with a 38.3% market share in 2024, due to the highly developed healthcare sector, high digital penetration among healthcare professionals, and penetration of EHRs. There are a considerable number of top medical app developers based in the region, such as Epocrates, Medscape, and IBM Micromedex, who regularly update and improve clinical decision-support tools. Moreover, a conducive regulatory environment, high per capita healthcare expenditure, and early uptake of technology in healthcare facilitate easy assimilation of medical apps in clinical processes, especially in the U.S. and Canada.

Asia Pacific is the fastest-growing region in the medical reference apps market with a 15.90% CAGR over the forecast period due to fast smartphone adoption, rising internet access owing to advanced technologies, and a rising number of tech-savvy healthcare professionals. Digital health programs are coming up in many countries, including India, China, and Southeast Asian nations are being driven by government initiatives to push telemedicine, geo-tagging, and mobile health that is growing in double digits. Also, the lack of health workers in rural areas is driving clinicians to depend more on mobile-based reference tools, which is further pushing app adoption across the region.

The medical reference apps market in Europe is growing due to the increasing acceptance of digital health in public and private healthcare organizations. The market is driven by the rising investment in healthcare IT infrastructure, focus on clinical accuracy and compliance, and the increasing demand for point-of-care decision support tools. Adoption is highest in Germany, the U.K., and France, with app integration into hospital networks being particularly strong in these countries, helped by supportive regulation, such as the EU medical device regulation (MDR), which guarantees the safety and standardization of medical software apps.

The medical reference apps market trend in Latin America and MEA is expected to witness moderate growth as it is still in its nascent stage. This trend is underpinned by better healthcare infrastructure, growing mobile and internet penetration, and the general rise in the sense of digital health tools among medical practitioners. Some Latin American countries are seeing increased proliferation of medical apps, especially in cities where digital health projects are more widely developed.

MEA region is growing substantially in the medical reference apps market due to the government’s initiatives to digitize health in the region and enhance demand for mobile health solutions to serve the scarcity of medical resources, especially in remote areas. Yet barriers, including lack of interoperability, slower spending on healthcare IT, and disparate regulations, still inhibit more rapid market growth in both markets.

Medical-Reference-Apps-Market-By-region

Get Customized Report as per Your Business Requirement - Enquiry Now

Key Players:

The medical reference apps market companies are Epocrates Inc., Wolters Kluwer Health, Medscape (WebMD LLC), Isabel Healthcare, BMJ Publishing Group Ltd, VisualDx, DynaMed (EBSCO Information Services), QxMD Software Inc., Skyscape Inc., Unbound Medicine Inc., PEPID LLC, Omnio by Physicians Interactive, MDCalc, IBM Micromedex (Merative), 3D4Medical (Elsevier), Kenhub GmbH, Elsevier Health, MIMS Group, Ziff Davis, American Academy of Pediatrics (AAP), and other players.

Recent Developments:

  • March 2023 – Epocrates, athenahealth, Inc.'s subsidiary and a well-known digital clinical decision support provider for healthcare prescribers, reported notable success for the year 2022. Some of its major milestones included launching a new mobile app intended to improve the clinician experience. The new app simplifies access to key resources that healthcare professionals need at the point of care and beyond, further solidifying Epocrates' stronghold in the healthcare and pharmaceutical industries.

  • October 2022 – EBSCO Information Services (EBSCO) and Merative announced a rebranded and expanded version of their integrated clinical decision support solution. Renamed DynaMedex, formerly sold as DynaMed and Micromedex with Watson, the solution continues to enhance clinical decision-making and operational effectiveness for healthcare professionals and health systems.

    Medical Reference Apps Market Report Scope:

    Report Attributes Details
    Market Size in 2024 USD 1.42 Billion 
    Market Size by 2032 USD 4.43 Billion 
    CAGR CAGR of 15.32% From 2025 to 2032
    Base Year 2024
    Forecast Period 2025-2032
    Historical Data 2021-2023
    Report Scope & Coverage Market Size, Segments Analysis, Competitive Landscape, Regional Analysis, DROC & SWOT Analysis, Forecast Outlook
    Key Segments • By Application (Drug Information, Medical Condition & Symptoms Management, Medical Calculators, Clinical Guidelines, Others)
    • By Platform (Android, iOS, Others)
    • By Apps (Smartphones, Tablets)
    • By End Use (Healthcare Providers, Patients, Others)
    Regional Analysis/Coverage North America (US, Canada, Mexico), Europe (Germany, France, UK, Italy, Spain, Poland, Turkey, Rest of Europe), Asia Pacific (China, India, Japan, South Korea, Singapore, Australia, Rest of Asia Pacific), Middle East & Africa (UAE, Saudi Arabia, Qatar, South Africa, Rest of Middle East & Africa), Latin America (Brazil, Argentina, Rest of Latin America)
    Company Profiles The medical reference apps market companies are Epocrates Inc., Wolters Kluwer Health, Medscape (WebMD LLC), Isabel Healthcare, BMJ Publishing Group Ltd, VisualDx, DynaMed (EBSCO Information Services), QxMD Software Inc., Skyscape Inc., Unbound Medicine Inc., PEPID LLC, Omnio by Physicians Interactive, MDCalc, IBM Micromedex (Merative), 3D4Medical (Elsevier), Kenhub GmbH, Elsevier Health, MIMS Group, Ziff Davis, American Academy of Pediatrics (AAP), and other players.

Frequently Asked Questions

Ans:  The Medical Reference Apps Market is expected to grow at a CAGR of 15.32% over 2025-2032.

Ans: The Medical Reference Apps Market was USD 1.42 billion in 2024 and is expected to reach USD 4.43 billion by 2032.

Ans: Rising Demand for Point-of-Care Clinical Decision Support is Escalating the Growth of the Market.

Ans: The “Drug Information” segment dominated the Medical Reference Apps Market.

Ans: North America dominated the Medical Reference Apps Market in 2024.

Table Of Contents

1. Introduction

1.1 Market Definition & Scope

 1.2 Research Assumptions & Abbreviations

 1.3 Research Methodology

2. Executive Summary

2.1 Market Snapshot

 2.2 Market Absolute $ Opportunity Assessment & Y-o-Y Analysis, 2021–2032

 2.3 Market Size & Forecast, By Segmentation, 2021–2032

  2.3.1 Market Size By Application

  2.3.2 Market Size By Platform

         2.3.2 Market Size By Apps

         2.3.2 Market Size By End Use

 2.4 Market Share & Bps Analysis By Region, 2024

 2.5 Industry Growth Scenarios – Conservative, Likely & Optimistic

 2.6 Industry CxO’s Perspective

3. Market Overview

3.1 Market Dynamics

  3.1.1 Drivers

  3.1.2 Restraints

  3.1.3 Opportunities

  3.1.4 Key Market Trends

 3.2 Industry PESTLE Analysis

 3.3 Key Industry Forces (Porter’s) Impacting Market Growth

 3.4 Industry Life Cycle Assessment

 3.5 Parent Market Overview

 3.6 Market Risk Assessment

4. Statistical Insights & Trends Reporting

4.1 App Adoption & Usage Rates (2024)
    4.1.1 Global and Regional Active User Base
    4.1.2 Year-on-Year Growth in Daily/Monthly Active Users
    4.1.3 Clinician App Usage at Point of Care

4.2 Content Access & Usage Patterns (2024), by Region
    4.2.1 Most Accessed Application Categories
    4.2.2 Regional Differences in Feature Usage
    4.2.3 Frequency of Access by Healthcare Professional Type

4.3 App Download Volume & Growth (2020–2032), by Region
    4.3.1 Historical and Forecasted Download Trends
    4.3.2 Growth in New Installs and Version Updates
    4.3.3 Regional Market Penetration Rates

4.4 Subscription & Monetization Trends (2024)
    4.4.1 Freemium vs. Premium Subscription Models
    4.4.2 In-App Purchases and Enterprise Licensing
    4.4.3 Pricing Model Analysis

4.5 Platform Preference Trends (Android vs. iOS) (2024)
    4.5.1 Market Share by Operating System
    4.5.2 Device Compatibility and Usage Preferences
    4.5.3 App Ratings, Reviews, and Update Frequency

 5. Medical Reference Apps Market Segmental Analysis & Forecast, By Application, 2021 – 2032, Value (USD Billion)

5.1 Introduction

 5.2 Drug Information

  5.2.1 Key Trends

  5.2.2 Market Size & Forecast, 2021 – 2032

 5.3 Medical Condition & Symptoms Management

  5.3.1 Key Trends

  5.3.2 Market Size & Forecast, 2021 – 2032

 5.4 Medical Calculators

  5.4.1 Key Trends

  5.4.2 Market Size & Forecast, 2021 – 2032

 5.5 Clinical Guidelines

  5.5.1 Key Trends

  5.5.2 Market Size & Forecast, 2021 – 2032

 5.6 Others

  5.6.1 Key Trends

  5.6.2 Market Size & Forecast, 2021 – 2032

6. Medical Reference Apps Market Segmental Analysis & Forecast, By Platform, 2021 – 2032, Value (USD Billion)

    6.1 Introduction

 6.2 Android

  6.2.1 Key Trends

  6.2.2 Market Size & Forecast, 2021 – 2032

 6.3 IOS

  6.3.1 Key Trends

  6.3.2 Market Size & Forecast, 2021 – 2032

 6.4 Others

  6.4.1 Key Trends

  6.4.2 Market Size & Forecast, 2021 – 2032

7. Medical Reference Apps Market Segmental Analysis & Forecast, By Apps, 2021 – 2032, Value (USD Billion)

    7.1 Introduction

 7.2 Smartphones

  7.2.1 Key Trends

  7.2.2 Market Size & Forecast, 2021 – 2032

 7.3 Tablets

  7.3.1 Key Trends

  7.3.2 Market Size & Forecast, 2021 – 2032

8. Medical Reference Apps Market Segmental Analysis & Forecast, By End Use, 2021 – 2032, Value (USD Billion)

    8.1 Introduction

 8.2 Healthcare Providers

  8.2.1 Key Trends

  8.2.2 Market Size & Forecast, 2021 – 2032

 8.3 Patients

  8.3.1 Key Trends

  8.3.2 Market Size & Forecast, 2021 – 2032

 8.4 Others

  8.4.1 Key Trends

  8.4.2 Market Size & Forecast, 2021 – 2032

9. Medical Reference Apps Market Segmental Analysis & Forecast By Region, 2021 – 2025, Value (USD Billion)

9.1 Introduction

9.2 North America

 9.2.1 Key Trends

 9.2.2 Medical Reference Apps Market Size & Forecast, By Platform, 2021 – 2032

 9.2.3 Medical Reference Apps Market Size & Forecast, By Application, 2021 – 2032

 9.2.4 Medical Reference Apps Market Size & Forecast, By Apps, 2021 – 2032

 9.2.5 Medical Reference Apps Market Size & Forecast, By End Use, 2021 – 2032

 9.2.6 Medical Reference Apps Market Size & Forecast, By Country, 2021 – 2032

  9.2.6.1 USA

   9.2.6.1.1 Medical Reference Apps Market Size & Forecast, By Platform, 2021 – 2032

   9.2.6.1.2 Medical Reference Apps Market Size & Forecast, By Application, 2021 – 2032

   9.2.6.1.3 Medical Reference Apps Market Size & Forecast, By Apps, 2021 – 2032

   9.2.6.1.4 Medical Reference Apps Market Size & Forecast, By End Use, 2021 – 2032

  9.2.6.2 Canada

   9.2.6.2.1 Medical Reference Apps Market Size & Forecast, By Platform, 2021 – 2032

   9.2.6.2.2 Medical Reference Apps Market Size & Forecast, By Application, 2021 – 2032

   9.2.6.2.3 Medical Reference Apps Market Size & Forecast, By Apps, 2021 – 2032

   9.2.6.2.4 Medical Reference Apps Market Size & Forecast, By End Use, 2021 – 2032

9.3 Europe

 9.3.1 Key Trends

 9.3.2 Medical Reference Apps Market Size & Forecast, By Platform, 2021 – 2032

 9.3.3 Medical Reference Apps Market Size & Forecast, By Application, 2021 – 2032

 9.3.4 Medical Reference Apps Market Size & Forecast, By Apps, 2021 – 2032

 9.3.5 Medical Reference Apps Market Size & Forecast, By End Use, 2021 – 2032

 9.3.6 Medical Reference Apps Market Size & Forecast, By Country, 2021 – 2032

  9.3.6.1 Germany

   9.3.6.1.1 Medical Reference Apps Market Size & Forecast, By Platform, 2021 – 2032

   9.3.6.1.2 Medical Reference Apps Market Size & Forecast, By Application, 2021 – 2032

   9.3.6.1.3 Medical Reference Apps Market Size & Forecast, By Apps, 2021 – 2032

   9.3.6.1.4 Medical Reference Apps Market Size & Forecast, By End Use, 2021 – 2032

  9.3.6.2 UK

   9.3.6.2.1 Medical Reference Apps Market Size & Forecast, By Platform, 2021 – 2032

   9.3.6.2.2 Medical Reference Apps Market Size & Forecast, By Application, 2021 – 2032

   9.3.6.2.3 Medical Reference Apps Market Size & Forecast, By Apps, 2021 – 2032

   9.3.6.2.4 Medical Reference Apps Market Size & Forecast, By End Use, 2021 – 2032

  9.3.6.3 France

   9.3.6.3.1 Medical Reference Apps Market Size & Forecast, By Platform, 2021 – 2032

   9.3.6.3.2 Medical Reference Apps Market Size & Forecast, By Application, 2021 – 2032

   9.3.6.3.3 Medical Reference Apps Market Size & Forecast, By Apps, 2021 – 2032

   9.3.6.3.4 Medical Reference Apps Market Size & Forecast, By End Use, 2021 – 2032

  9.3.6.4 Italy

   9.3.6.4.1 Medical Reference Apps Market Size & Forecast, By Platform, 2021 – 2032

   9.3.6.4.2 Medical Reference Apps Market Size & Forecast, By Application, 2021 – 2032

   9.3.6.4.3 Medical Reference Apps Market Size & Forecast, By Apps, 2021 – 2032

   9.3.6.4.4 Medical Reference Apps Market Size & Forecast, By End Use, 2021 – 2032

  9.3.6.5 Spain

   9.3.6.5.1 Medical Reference Apps Market Size & Forecast, By Platform, 2021 – 2032

   9.3.6.5.2 Medical Reference Apps Market Size & Forecast, By Application, 2021 – 2032

   9.3.6.5.3 Medical Reference Apps Market Size & Forecast, By Apps, 2021 – 2032

   9.3.6.5.4 Medical Reference Apps Market Size & Forecast, By End Use, 2021 – 2032

  9.3.6.6 Russia

   9.3.6.6.1 Medical Reference Apps Market Size & Forecast, By Platform, 2021 – 2032

   9.3.6.6.2 Medical Reference Apps Market Size & Forecast, By Application, 2021 – 2032

   9.3.6.6.3 Medical Reference Apps Market Size & Forecast, By Apps, 2021 – 2032

   9.3.6.6.4 Medical Reference Apps Market Size & Forecast, By End Use, 2021 – 2032

  9.3.6.7 Poland

   9.3.6.7.1 Medical Reference Apps Market Size & Forecast, By Platform, 2021 – 2032

   9.3.6.7.2 Medical Reference Apps Market Size & Forecast, By Application, 2021 – 2032

   9.3.6.7.3 Medical Reference Apps Market Size & Forecast, By Apps, 2021 – 2032

   9.3.6.7.4 Medical Reference Apps Market Size & Forecast, By End Use, 2021 – 2032

  9.3.6.8 Rest of Europe

   9.3.6.8.1 Medical Reference Apps Market Size & Forecast, By Platform, 2021 – 2032

   9.3.6.8.2 Medical Reference Apps Market Size & Forecast, By Application, 2021 – 2032

   9.3.6.8.3 Medical Reference Apps Market Size & Forecast, By Apps, 2021 – 2032

   9.3.6.8.4 Medical Reference Apps Market Size & Forecast, By End Use, 2021 – 2032   

9.4 Asia-Pacific

 9.4.1 Key Trends

 9.4.2 Medical Reference Apps Market Size & Forecast, By Platform, 2021 – 2032

 9.4.3 Medical Reference Apps Market Size & Forecast, By Application, 2021 – 2032

 9.4.4 Medical Reference Apps Market Size & Forecast, By Apps, 2021 – 2032

 9.4.5 Medical Reference Apps Market Size & Forecast, By End Use, 2021 – 2032

 9.4.6 Medical Reference Apps Market Size & Forecast, By Country, 2021 – 2032

  9.4.6.1 China

   9.4.6.1.1 Medical Reference Apps Market Size & Forecast, By Platform, 2021 – 2032

   9.4.6.1.2 Medical Reference Apps Market Size & Forecast, By Application, 2021 – 2032

   9.4.6.1.3 Medical Reference Apps Market Size & Forecast, By Apps, 2021 – 2032

   9.4.6.1.4 Medical Reference Apps Market Size & Forecast, By End Use, 2021 – 2032

  9.4.6.2 India

   9.4.6.2.1 Medical Reference Apps Market Size & Forecast, By Platform, 2021 – 2032

   9.4.6.2.2 Medical Reference Apps Market Size & Forecast, By Application, 2021 – 2032

   9.4.6.2.3 Medical Reference Apps Market Size & Forecast, By Apps, 2021 – 2032

   9.4.6.2.4 Medical Reference Apps Market Size & Forecast, By End Use, 2021 – 2032

  9.4.6.3 Japan

   9.4.6.3.1 Medical Reference Apps Market Size & Forecast, By Platform, 2021 – 2032

   9.4.6.3.2 Medical Reference Apps Market Size & Forecast, By Application, 2021 – 2032

   9.4.6.3.3 Medical Reference Apps Market Size & Forecast, By Apps, 2021 – 2032

   9.4.6.3.4 Medical Reference Apps Market Size & Forecast, By End Use, 2021 – 2032

  9.4.6.4 South Korea

   9.4.6.4.1 Medical Reference Apps Market Size & Forecast, By Platform, 2021 – 2032

   9.4.6.4.2 Medical Reference Apps Market Size & Forecast, By Application, 2021 – 2032

   9.4.6.4.3 Medical Reference Apps Market Size & Forecast, By Apps, 2021 – 2032

   9.4.6.4.4 Medical Reference Apps Market Size & Forecast, By End Use, 2021 – 2032

  9.4.6.5 Australia

   9.4.6.5.1 Medical Reference Apps Market Size & Forecast, By Platform, 2021 – 2032

   9.4.6.5.2 Medical Reference Apps Market Size & Forecast, By Application, 2021 – 2032

   9.4.6.5.3 Medical Reference Apps Market Size & Forecast, By Apps, 2021 – 2032

   9.4.6.5.4 Medical Reference Apps Market Size & Forecast, By End Use, 2021 – 2032

  9.4.6.6 ASEAN Countries

   9.4.6.6.1 Medical Reference Apps Market Size & Forecast, By Platform, 2021 – 2032

   9.4.6.6.2 Medical Reference Apps Market Size & Forecast, By Application, 2021 – 2032

   9.4.6.6.3 Medical Reference Apps Market Size & Forecast, By Apps, 2021 – 2032

   9.4.6.6.4 Medical Reference Apps Market Size & Forecast, By End Use, 2021 – 2032

  9.4.6.7 Rest of Asia-Pacific

   9.4.6.7.1 Medical Reference Apps Market Size & Forecast, By Platform, 2021 – 2032

   9.4.6.7.2 Medical Reference Apps Market Size & Forecast, By Application, 2021 – 2032

   9.4.6.7.3 Medical Reference Apps Market Size & Forecast, By Apps, 2021 – 2032

   9.4.6.7.4 Medical Reference Apps Market Size & Forecast, By End Use, 2021 – 2032

9.5 Latin America

 9.5.1 Key Trends

 9.5.2 Medical Reference Apps Market Size & Forecast, By Platform, 2021 – 2032

 9.5.3 Medical Reference Apps Market Size & Forecast, By Application, 2021 – 2032

 9.5.4 Medical Reference Apps Market Size & Forecast, By Apps, 2021 – 2032

 9.5.5 Medical Reference Apps Market Size & Forecast, By End Use, 2021 – 2032

 9.5.6 Medical Reference Apps Market Size & Forecast, By Country, 2021 – 2032

  9.5.6.1 Brazil

   9.5.6.1.1 Medical Reference Apps Market Size & Forecast, By Platform, 2021 – 2032

   9.5.6.1.2 Medical Reference Apps Market Size & Forecast, By Application, 2021 – 2032

   9.5.6.1.3 Medical Reference Apps Market Size & Forecast, By Apps, 2021 – 2032

   9.5.6.1.4 Medical Reference Apps Market Size & Forecast, By End Use, 2021 – 2032

  9.5.6.2 Argentina

   9.5.6.2.1 Medical Reference Apps Market Size & Forecast, By Platform, 2021 – 2032

   9.5.6.2.2 Medical Reference Apps Market Size & Forecast, By Application, 2021 – 2032

   9.5.6.2.3 Medical Reference Apps Market Size & Forecast, By Apps, 2021 – 2032

   9.5.6.2.4 Medical Reference Apps Market Size & Forecast, By End Use, 2021 – 2032

  9.5.6.3 Mexico

   9.5.6.3.1 Medical Reference Apps Market Size & Forecast, By Platform, 2021 – 2032

   9.5.6.3.2 Medical Reference Apps Market Size & Forecast, By Application, 2021 – 2032

   9.5.6.3.3 Medical Reference Apps Market Size & Forecast, By Apps, 2021 – 2032

   9.5.6.3.4 Medical Reference Apps Market Size & Forecast, By End Use, 2021 – 2032

  9.5.6.4 Colombia

   9.5.6.4.1 Medical Reference Apps Market Size & Forecast, By Platform, 2021 – 2032

   9.5.6.4.2 Medical Reference Apps Market Size & Forecast, By Application, 2021 – 2032

   9.5.6.4.3 Medical Reference Apps Market Size & Forecast, By Apps, 2021 – 2032

   9.5.6.4.4 Medical Reference Apps Market Size & Forecast, By End Use, 2021 – 2032

  9.5.6.5 Rest of Latin America

   9.5.6.5.1 Medical Reference Apps Market Size & Forecast, By Platform, 2021 – 2032

   9.5.6.5.2 Medical Reference Apps Market Size & Forecast, By Application, 2021 – 2032

   9.5.6.5.3 Medical Reference Apps Market Size & Forecast, By Apps, 2021 – 2032

   9.5.6.5.4 Medical Reference Apps Market Size & Forecast, By End Use, 2021 – 2032

9.6 Middle East & Africa

 9.6.1 Key Trends

 9.6.2 Medical Reference Apps Market Size & Forecast, By Platform, 2021 – 2032

 9.6.3 Medical Reference Apps Market Size & Forecast, By Application, 2021 – 2032

 9.6.4 Medical Reference Apps Market Size & Forecast, By Apps, 2021 – 2032

 9.6.5 Medical Reference Apps Market Size & Forecast, By End Use, 2021 – 2032

 9.6.6 Medical Reference Apps Market Size & Forecast, By Country, 2021 – 2032

  9.6.6.1 UAE

   9.6.6.1.1 Medical Reference Apps Market Size & Forecast, By Platform, 2021 – 2032

   9.6.6.1.2 Medical Reference Apps Market Size & Forecast, By Application, 2021 – 2032

   9.6.6.1.3 Medical Reference Apps Market Size & Forecast, By Apps, 2021 – 2032

   9.6.6.1.4 Medical Reference Apps Market Size & Forecast, By End Use, 2021 – 2032

  9.6.6.2 Saudi Arabia

   9.6.6.2.1 Medical Reference Apps Market Size & Forecast, By Platform, 2021 – 2032

   9.6.6.2.2 Medical Reference Apps Market Size & Forecast, By Application, 2021 – 2032

   9.6.6.2.3 Medical Reference Apps Market Size & Forecast, By Apps, 2021 – 2032

   9.6.6.2.4 Medical Reference Apps Market Size & Forecast, By End Use, 2021 – 2032

  9.6.6.3 Qatar

   9.6.6.3.1 Medical Reference Apps Market Size & Forecast, By Platform, 2021 – 2032

   9.6.6.3.2 Medical Reference Apps Market Size & Forecast, By Application, 2021 – 2032

   9.6.6.3.3 Medical Reference Apps Market Size & Forecast, By Apps, 2021 – 2032

   9.6.6.3.4 Medical Reference Apps Market Size & Forecast, By End Use, 2021 – 2032

  9.6.6.4 Egypt

   9.6.6.4.1 Medical Reference Apps Market Size & Forecast, By Platform, 2021 – 2032

   9.6.6.4.2 Medical Reference Apps Market Size & Forecast, By Application, 2021 – 2032

   9.6.6.4.3 Medical Reference Apps Market Size & Forecast, By Apps, 2021 – 2032

   9.6.6.4.4 Medical Reference Apps Market Size & Forecast, By End Use, 2021 – 2032

  9.6.6.5 South Africa

   9.6.6.5.1 Medical Reference Apps Market Size & Forecast, By Platform, 2021 – 2032

   9.6.6.5.2 Medical Reference Apps Market Size & Forecast, By Application, 2021 – 2032

   9.6.6.5.3 Medical Reference Apps Market Size & Forecast, By Apps, 2021 – 2032

   9.6.6.5.4 Medical Reference Apps Market Size & Forecast, By End Use, 2021 – 2032

  9.6.6.6 Rest of Middle East & Africa

   9.6.6.6.1 Medical Reference Apps Market Size & Forecast, By Platform, 2021 – 2032

   9.6.6.6.2 Medical Reference Apps Market Size & Forecast, By Application, 2021 – 2032

   9.6.6.6.3 Medical Reference Apps Market Size & Forecast, By Apps, 2021 – 2032

   9.6.6.6.4 Medical Reference Apps Market Size & Forecast, By End Use, 2021 – 2032

10. Competitive Landscape

 10.1 Key Players' Positioning

 10.2 Competitive Developments

  10.2.1 Key Strategies Adopted (%), By Key Players, 2024

  10.2.2 Year-Wise Strategies & Development, 2021 – 2025

  10.2.3 Number Of Strategies Adopted By Key Players, 2024

 10.3 Market Share Analysis, 2024

 10.4 Product/Service & Application Benchmarking

  10.4.1 Product/Service Specifications & Features By Key Players

  10.4.2 Product/Service Heatmap By Key Players

  10.4.3 Application Heatmap By Key Players

 10.5 Industry Start-Up & Innovation Landscape

 10.6 Key Company Profiles

10.6 Key Company Profiles

10.6 Company Profiles

10.6.1 Epocrates Inc.
  
10.6.1.1 Company Overview & Snapshot
  10.6.1.2 Product/Service Portfolio
  10.6.1.3 Key Company Financials
  10.6.1.4 SWOT Analysis

10.6.2 Wolters Kluwer Health
  10.6.2.1 Company Overview & Snapshot
  10.6.2.2 Product/Service Portfolio
  10.6.2.3 Key Company Financials
  10.6.2.4 SWOT Analysis

10.6.3 Medscape (WebMD LLC)
  10.6.3.1 Company Overview & Snapshot
  10.6.3.2 Product/Service Portfolio
  10.6.3.3 Key Company Financials
  10.6.3.4 SWOT Analysis

10.6.4 Isabel Healthcare
  10.6.4.1 Company Overview & Snapshot
  10.6.4.2 Product/Service Portfolio
  10.6.4.3 Key Company Financials
  10.6.4.4 SWOT Analysis

10.6.5 BMJ Publishing Group Ltd
  
10.6.5.1 Company Overview & Snapshot
  10.6.5.2 Product/Service Portfolio
  10.6.5.3 Key Company Financials
  10.6.5.4 SWOT Analysis

10.6.6 VisualDx
  10.6.6.1 Company Overview & Snapshot
  10.6.6.2 Product/Service Portfolio
  10.6.6.3 Key Company Financials
  10.6.6.4 SWOT Analysis

10.6.7 DynaMed (EBSCO Information Services)
  
10.6.7.1 Company Overview & Snapshot
  10.6.7.2 Product/Service Portfolio
  10.6.7.3 Key Company Financials
  10.6.7.4 SWOT Analysis

10.6.8 QxMD Software Inc.
  
10.6.8.1 Company Overview & Snapshot
  10.6.8.2 Product/Service Portfolio
  10.6.8.3 Key Company Financials
  10.6.8.4 SWOT Analysis

10.6.9 Skyscape Inc.
  
10.6.9.1 Company Overview & Snapshot
  10.6.9.2 Product/Service Portfolio
  10.6.9.3 Key Company Financials
  10.6.9.4 SWOT Analysis

10.6.10 Unbound Medicine Inc.
  
10.6.10.1 Company Overview & Snapshot
  10.6.10.2 Product/Service Portfolio
  10.6.10.3 Key Company Financials
  10.6.10.4 SWOT Analysis

10.6.11 PEPID LLC
  10.6.11.1 Company Overview & Snapshot
  10.6.11.2 Product/Service Portfolio
  10.6.11.3 Key Company Financials
  10.6.11.4 SWOT Analysis

10.6.12 Omnio by Physicians Interactive
  10.6.12.1 Company Overview & Snapshot
  10.6.12.2 Product/Service Portfolio
  10.6.12.3 Key Company Financials
  10.6.12.4 SWOT Analysis

10.6.13 MDCalc
  
10.6.13.1 Company Overview & Snapshot
  10.6.13.2 Product/Service Portfolio
  10.6.13.3 Key Company Financials
  10.6.13.4 SWOT Analysis

10.6.14 IBM Micromedex (Merative)
  
10.6.14.1 Company Overview & Snapshot
  10.6.14.2 Product/Service Portfolio
  10.6.14.3 Key Company Financials
  10.6.14.4 SWOT Analysis

10.6.15 3D4Medical (Elsevier)
  
10.6.15.1 Company Overview & Snapshot
  10.6.15.2 Product/Service Portfolio
  10.6.15.3 Key Company Financials
  10.6.15.4 SWOT Analysis

10.6.16 Kenhub GmbH
  
10.6.16.1 Company Overview & Snapshot
  10.6.16.2 Product/Service Portfolio
  10.6.16.3 Key Company Financials
  10.6.16.4 SWOT Analysis

10.6.17 Elsevier Health
  
10.6.17.1 Company Overview & Snapshot
  10.6.17.2 Product/Service Portfolio
  10.6.17.3 Key Company Financials
  10.6.17.4 SWOT Analysis

10.6.18 MIMS Group
  
10.6.18.1 Company Overview & Snapshot
  10.6.18.2 Product/Service Portfolio
  10.6.18.3 Key Company Financials
  10.6.18.4 SWOT Analysis

10.6.19 Ziff Davis
  
10.6.19.1 Company Overview & Snapshot
  10.6.19.2 Product/Service Portfolio
  10.6.19.3 Key Company Financials
  10.6.19.4 SWOT Analysis

10.6.20 American Academy of Pediatrics (AAP)
  
10.6.20.1 Company Overview & Snapshot
  10.6.20.2 Product/Service Portfolio
  10.6.20.3 Key Company Financials
  10.6.20.4 SWOT Analysis

11. Analyst Recommendations

 11.1 SNS Insider Opportunity Map

 11.2 Industry Low-Hanging Fruit Assessment

 11.3 Market Entry & Growth Strategy

 11.4 Analyst Viewpoint & Suggestions On Market Growth

12. Assumptions

13. Disclaimer

14. Appendix

 14.1 List Of Tables

 14.2 List Of Figures

An accurate research report requires proper strategizing as well as implementation. There are multiple factors involved in the completion of good and accurate research report and selecting the best methodology to compete the research is the toughest part. Since the research reports we provide play a crucial role in any company’s decision-making process, therefore we at SNS Insider always believe that we should choose the best method which gives us results closer to reality. This allows us to reach at a stage wherein we can provide our clients best and accurate investment to output ratio.

Each report that we prepare takes a timeframe of 350-400 business hours for production. Starting from the selection of titles through a couple of in-depth brain storming session to the final QC process before uploading our titles on our website we dedicate around 350 working hours. The titles are selected based on their current market cap and the foreseen CAGR and growth.


The 5 steps process:

Step 1: Secondary Research:

Secondary Research or Desk Research is as the name suggests is a research process wherein, we collect data through the readily available information. In this process we use various paid and unpaid databases which our team has access to and gather data through the same. This includes examining of listed companies’ annual reports, Journals, SEC filling etc. Apart from this our team has access to various associations across the globe across different industries. Lastly, we have exchange relationships with various university as well as individual libraries.

Secondary Research

Step 2: Primary Research

When we talk about primary research, it is a type of study in which the researchers collect relevant data samples directly, rather than relying on previously collected data.  This type of research is focused on gaining content specific facts that can be sued to solve specific problems. Since the collected data is fresh and first hand therefore it makes the study more accurate and genuine.

We at SNS Insider have divided Primary Research into 2 parts.

Part 1 wherein we interview the KOLs of major players as well as the upcoming ones across various geographic regions. This allows us to have their view over the market scenario and acts as an important tool to come closer to the accurate market numbers. As many as 45 paid and unpaid primary interviews are taken from both the demand and supply side of the industry to make sure we land at an accurate judgement and analysis of the market.

This step involves the triangulation of data wherein our team analyses the interview transcripts, online survey responses and observation of on filed participants. The below mentioned chart should give a better understanding of the part 1 of the primary interview.

Primary Research

Part 2: In this part of primary research the data collected via secondary research and the part 1 of the primary research is validated with the interviews from individual consultants and subject matter experts.

Consultants are those set of people who have at least 12 years of experience and expertise within the industry whereas Subject Matter Experts are those with at least 15 years of experience behind their back within the same space. The data with the help of two main processes i.e., FGDs (Focused Group Discussions) and IDs (Individual Discussions). This gives us a 3rd party nonbiased primary view of the market scenario making it a more dependable one while collation of the data pointers.

Step 3: Data Bank Validation

Once all the information is collected via primary and secondary sources, we run that information for data validation. At our intelligence centre our research heads track a lot of information related to the market which includes the quarterly reports, the daily stock prices, and other relevant information. Our data bank server gets updated every fortnight and that is how the information which we collected using our primary and secondary information is revalidated in real time.

Data Bank Validation

Step 4: QA/QC Process

After all the data collection and validation our team does a final level of quality check and quality assurance to get rid of any unwanted or undesired mistakes. This might include but not limited to getting rid of the any typos, duplication of numbers or missing of any important information. The people involved in this process include technical content writers, research heads and graphics people. Once this process is completed the title gets uploader on our platform for our clients to read it.

Step 5: Final QC/QA Process:

This is the last process and comes when the client has ordered the study. In this process a final QA/QC is done before the study is emailed to the client. Since we believe in giving our clients a good experience of our research studies, therefore, to make sure that we do not lack at our end in any way humanly possible we do a final round of quality check and then dispatch the study to the client.

Key Segments:

By Application

    • Drug Information
    • Medical Condition & Symptoms Management
    • Medical Calculators
    • Clinical Guidelines
    • Others (Anatomy & physiology atlases, Continuing medical education (CME) content)

By Platform

    • Android
    • iOS
    • Others (Web-based, Cross-platform progressive web apps, Cross-platform progressive web apps)

By Apps

    • Smartphones
    • Tablets

By End Use

    • Healthcare Providers
    • Patients 
    • Others (Medical students and academic researchers, Public health officials, and policy makers)

Request for Segment Customization as per your Business Requirement: Segment Customization Request

Regional Coverage: 

North America

  • US
  • Canada

Europe

  • Germany
  • France
  • UK
  • Italy
  • Spain
  • Russia
  • Poland
  • Rest of Europe

Asia Pacific

  • China
  • India
  • Japan
  • South Korea
  • Australia
  • ASEAN Countries
  • Rest of Asia Pacific

Middle East & Africa

  • UAE
  • Saudi Arabia
  • Qatar
  • Egypt
  • South Africa
  • Rest of Middle East & Africa

Latin America

  • Brazil
  • Argentina
  • Mexico
  • Colombia
  • Rest of Latin America

Request for Country Level Research Report: Country Level Customization Request

Available Customization 

With the given market data, SNS Insider offers customization as per the company’s specific needs. The following customization options are available for the report: 

  • Detailed Volume Analysis 
  • Criss-Cross segment analysis (e.g., Product X Application) 
  • Competitive Product Benchmarking 
  • Geographic Analysis 
  • Additional countries in any of the regions 
  • Customized Data Representation 
  • Detailed analysis and profiling of additional market players


Explore Key Insights.


  • Analyzes market trends, forecasts, and regional dynamics
  • Covers core offerings, innovations, and industry use cases
  • Profiles major players, value chains, and strategic developments
  • Highlights innovation trends, regulatory impacts, and growth opportunities
Request an Analyst Call