MEMS Energy Harvesting Devices Market Size Analysis:
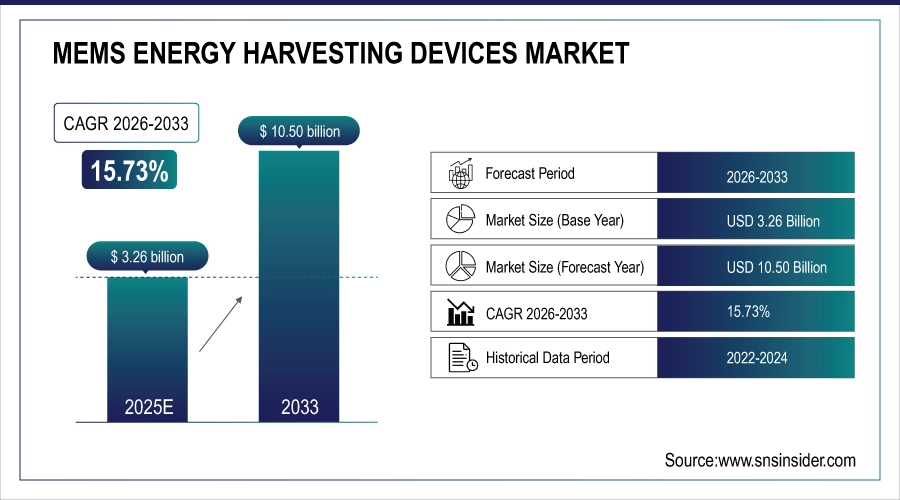
The MEMS Energy Harvesting Devices Market size was valued at USD 3.26 Billion in 2025E and is projected to reach USD 10.50 Billion by 2033, growing at a CAGR of 15.73% during 2026-2033.
The MEMS Energy Harvesting Devices market is witnessing robust growth as the push for sustainable, maintenance-free power solutions accelerates across various industries. With the proliferation of connected devices, particularly for smart buildings, industrial IoT systems, and wireless sensor networks, the requirement for an efficient and charge-free energy catalyzes. MEMS based energy harvesters operating from RF, vibration and thermal energy sources can serve as perfect candidates for such sensors due to their ultra-miniature structure, sub microwatt power operation and potential for scalability. By doing so, these devices allow flexible, autonomous operation of flat surface IoT sensors and devices without battery or wired power limitations.
Support coming from government programs and regulations around the world, especially in the U.S. and Europe are actively promoting the use of energy harvesting technologies in smart infrastructures and public facilities. Market penetration is including to be accelerated via technological advances, such as energy conversion efficiency improvements and multi-band harvesting and power management circuit integration. MEMS energy harvesting will continue to innovate and grow in demand, particularly in applications requiring end devices to be battery-free and self-powered as we move toward 2032, making it a crucial contributor to next-generation connected ecosystems.
RF energy harvesting is revolutionizing smart buildings by enabling maintenance-free, battery-free IoT devices, with current applications in sensors and access systems, despite efficiency limitations that ongoing R&D aims to overcome.
Market Size and Forecast: 2025E
-
Market Size in 2025E USD 3.26 Billion
-
Market Size by 2033 USD 10.50 Billion
-
CAGR of 15.73% From 2026 to 2033
-
Base Year 2025E
-
Forecast Period 2026-2033
-
Historical Data 2021-2024
To Get more information on MEMS Energy Harvesting Devices Market - Request Free Sample Report
MEMS Energy Harvesting Devices Market Trends:
• Industries are increasingly adopting sustainable, battery-free MEMS energy harvesting solutions to reduce environmental impact and maintenance costs.
• Integration of ultra-low-power microcontrollers, organic photovoltaic cells, biodegradable substrates, and green supercapacitors enables fully autonomous, low-maintenance devices.
• Energy-efficient MEMS solutions are facilitating scalable IoT deployments across retail, smart buildings, and consumer electronics sectors.
• Advancements in MEMS grating modulators are delivering high-speed, high-efficiency, and miniaturized optical components for telecommunications, LiDAR, aerospace, and quantum communication.
• Technological improvements in MEMS optics allow rapid data transmission, long-range detection, and low-power operation, opening new high-growth market opportunities.
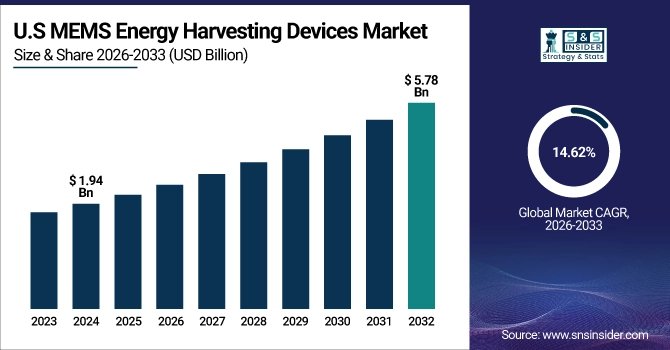
The U.S. MEMS energy harvesting devices market size was valued at USD 1.94 Billion in 2025E and is projected to reach USD 5.78 Billion by 2033, growing at a CAGR of 14.62% during 2026-2033. The demand for battery-free, maintenance-free power supply across smart buildings, industrial IoT, and wearable electronics is driving the MEMS Energy Harvesting Devices Market growth. Further boost in market is supported by the government initiatives, low-power electronics technological advancements and increasing deployment of wireless sensor networks across diverse end-use industries.
Several trends are reshaping the MEMS energy harvesting devices market due to the increase in demand for smart technologies and sustainable power solutions. The increasing need of ultra-low powered IoT devices that would not need batteries to operate is one of the MEMS energy harvesting devices market trends. This is providing improvements in the efficiency and connectivity of the system, integrating with wireless protocols including east-to-narrow-band technology (BLE) and Zigbee. Furthermore, the new developments in multi-source energy harvesting technology, miniaturization and intelligent energy storage are opening new avenues for the implementation of technologies in smart cities, industrial automation and wearable electronics.
MEMS Energy Harvesting Devices Market Growth Drivers:
-
Sustainability Push Drives Innovation in MEMS Energy Harvesting Devices Market
The MEMS energy harvesting devices market is experiencing strong growth as industries push for sustainable, battery-free power solutions for the Internet of Things (IoT) and electronics. Such change is necessitated by the burden of disposable and rechargeable batteries on environment and their mounting upkeep costs. Manufacturers are beginning to incorporate ultra-low-power microcontrollers, organic photovoltaic cells, biodegradable substrates, and green super capacitors to make completely autonomous systems. It allows for low-maintenance and dependable operation of various devices, such as electronic shelf labels, smart sensors, and other remote controls, thereby contributing to a significant reduction in e-waste. Consequently, the market is shifting toward more sustainable, energy-efficient, and cost-effective solutions that facilitate long-term deployment, energy independence and scalable IoT ecosystems in retail, smart buildings, and consumer electronics verticals.
In Sept 2024, the €3.1M SELECT project is developing a complete energy harvesting platform for IoT that is completely battery-free using ultra-low-power MCUs, solar cells, and biodegradable materials in Europe.
MEMS Energy Harvesting Devices Market Restraints:
-
Complex Integration with Existing Systems Limits MEMS Energy Harvesting Adoption
Integration of MEMS energy harvesting devices with existing electronic systems and IoT platforms is one of the key restraints in MEMS energy harvesting devices market. Traditional systems have been built on the assumption of continuous power supply sources, such as batteries or directly wired to power sources, while MEMS harvesters have employed a low level, intermittent energy supply. Such an inconsistency leads to compatibility policies touching the power system, communication methods, and system reliability. Implementing energy harvesting with existing architectures necessitates considerable additional engineering, costing money and time to market. Moreover, integration becomes even more difficult due to the lack of standardized interfaces and low support from legacy platforms. However, these challenges limit wider adoption, especially in use cases where seamless plug and play deployment is crucial for scale and efficiency.
MEMS Energy Harvesting Devices Market Opportunities:
-
Innovation in MEMS Grating Modulators Creates New Opportunities for Optical Communication Markets
Delivery of a high-aperture, high-optical efficiency, high-performance, and ultrafast-response MEMS grating modulator is opening new opportunities throughout the optical communication and sensing markets. By surpassing previous limitations in speed, efficiency, and scalability, it is now possible to deliver more reliable and energy-efficient solutions across sectors such as telecommunications, LiDAR, aerospace, and quantum communication. This technological progression allowing rapid data transmission, long-range detection, and miniaturized systems are propelling MEMS-based modulators into high-growth sectors with their requirement of high accuracy, rapid detection, and low power consumption.
High speed opticsA MEMS grating modulator with large aperture is presented which exhibits 90% optical efficiency and 1.1 µs response.
MEMS Energy Harvesting Devices Market Segment Analysis:
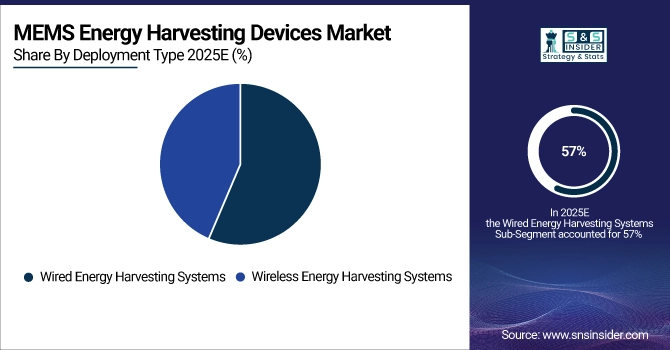
By Deployment Type
In 2025E, the Wired Energy Harvesting Systems segment accounted for approximately 57% of the MEMS energy harvesting devices market share, due to its high-energy transfer efficiency, low-latency rate, and suitability to at-fixed industrial infrastructure. Such are the applications where continuous and stable power is a necessity, and hence, the segment witness extensive deployment in factory automation, structural health monitoring, and building systems. While wireless alternatives proliferate, the ubiquity and versatility of wired solutions remain a reliable mainstay for many high-demand MEMS applications. The Wireless Energy Harvesting Systems segment is expected to experience the fastest growth in MEMS Energy Harvesting Devices market over 2026-2033 with a CAGR of 17.15%, owing to the increasing demand for non-battery type IoT devices, remote sensing and wear electronics. This is driving adoption across smart cities, healthcare, logistics, and precision agriculture, while making it the key enabler of next-generation and low-maintenance electronic systems due to its flexible, easy to deploy, and cost-effective nature in hard-to-wire environments.
By Technology
In 2025E, the Solar (Photovoltaic) Energy Harvesting segment accounted for approximately 61% of the MEMS energy harvesting devices market share is expected to experience the fastest growth in MEMS Energy Harvesting Devices market over 2026-2033 with a CAGR of 16.93%. Growth is being spurred by demand for self-powered IoT devices, improvements in thin-film solar technologies, and government sustainability mandates. Research and development of solar MEMS with smart sensor integration for industrial automation, smart cities, and building automation is paving the way for large-scale deployment, increasing operational efficiency, and lowering dependence on batteries.
By Power Range
In 2025E, the Low-Power Devices (µW to mW) segment accounted for approximately 71% of the MEMS Energy Harvesting Devices market share, due to maximum usage of MEMS energy harvesting devices in low-energy Applications, including wireless sensors, wearables, and medical implants. MEMS harvesters’ ultra-low power consumption is also favorable for battery less and maintenance-free devices, which is essential within battery less wearables and especially for ubiquitous IoT ecosystems and smart environments where long-life and efficiency is needed. The Medium-to-High Power Devices (W to kW) segment is expected to experience the fastest growth in MEMS energy harvesting devices market over 2026-2033 with a CAGR of 17.77%, owing to the high demand in many industrial automation, transportation, and defense sectors for greater energy outputs to power machines, actuators, and mission-critical electronics. Although, significant MEMs scalability and hybrid energy harvesting solutions are advancing broader deployment to medium-to-high power applications in rugged and remote environments.
By End-User
In 2025E, the Industrial & Manufacturing segment accounted for approximately 38% of the MEMS Energy Harvesting Devices market share. This dominance is attributed to the growing adoption of wireless sensor networks and condition-monitoring systems in factories and industrial facilities. MEMS-based harvesters enable cost-effective, battery-free operation in harsh environments, reducing maintenance, needs and supporting Industry 4.0 and smart factory initiatives. The Building Automation & Consumer Electronics segment is expected to experience the fastest growth in MEMS energy harvesting devices market over 2026-2033 with a CAGR of 17.78%, This surge is fueled by the increasing demand for smart home devices, wearable electronics, and IoT-enabled systems that require compact, battery-free power sources. MEMS-based energy harvesters provide sustainable, low-maintenance solutions, enabling seamless integration into compact consumer electronics and supporting energy-efficient building automation systems.
MEMS Energy Harvesting Devices Market Regional Analysis:
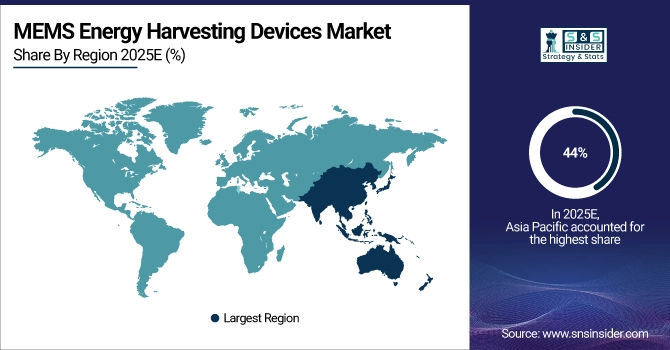
Asia Pacific MEMS Energy Harvesting Devices Market Insights
In 2025E, Asia Pacific dominated the MEMS Energy Harvesting Devices market and accounted for 44% of revenue share, driven by rapid industrialization, widespread adoption of IoT-enabled devices, and increased investment in smart infrastructure in countries, such as China, Japan, and South Korea. Regional demand for compact, low-power energy harvesting solutions was also driven by a steady increase in government initiatives regarding energy efficiency, and the ever-growing presence of leading semiconductor manufacturers.
Get Customized Report as per Your Business Requirement - Enquiry Now
North America MEMS Energy Harvesting Devices Market Insights
North America is expected to witness the fastest growth in the MEMS energy harvesting devices market over 2026-2033, with a projected CAGR of 17.54%, owing to significant support from the government for clean energy technologies, rapid deployment of IoT in industrial automation, along with rising R&D expenditure. Moreover, as the region emphasizes energy-efficient infrastructure, the faster deployment of advanced MEMS-based systems in the region further accelerates market growth.
Europe MEMS Energy Harvesting Devices Market Insights
In 2025E, Europe emerged as a promising region in the MEMS energy harvesting devices market, supported by increasing investments in sustainable electronics, active participation in EU-funded projects including SELECT, and strong regulatory focus on environmental impact reduction. The region's emphasis on battery-free IoT innovations and advanced energy-harvesting research creates substantial growth opportunities across smart buildings, wearables, and industrial automation sectors.
Latin America (LATAM) and Middle East & Africa (MEA) MEMS Energy Harvesting Devices Market Insights
LATAM and MEA are experiencing steady growth in the MEMS Energy Harvesting Devices market, due to growing IoT adoption in remote monitoring along with infrastructure developments and energy access solutions. Increasing government initiatives for smart grid deployment and growing need for low-maintenance power sources for off-grid and harsh environments are expected to drive the market demand. Increasing knowledge of sustainable technologies is another factor that is expected to boost the market development across these emerging regions.
MEMS Energy Harvesting Devices Market Key Players:
The Key Players in MEMS Energy Harvesting Devices Market are ABB, Analog Devices, EH 4 GmbH, EnOcean GmbH, Fujitsu, Holst Centre, Lam Research Corp, Parker Hannifin Corp, STMicroelectronics NV, Texas Instruments, Microchip Technology, Murata, NXP Semiconductors, Powercast Corp, Advanced Linear Devices, Silicon Labs, Maxim Integrated, Bosch Sensortec., Energous Corp, and Others.
Competitive Landscape for MEMS Energy Harvesting Devices Market:
STMicroelectronics is a global semiconductor leader designing and manufacturing MEMS-based energy harvesting solutions for IoT and portable electronics. The company develops ultra-low-power sensors, microcontrollers, and energy-efficient devices that enable battery-free and autonomous operation. Its innovations support sustainable, cost-effective, and scalable deployments across smart buildings, consumer electronics, and industrial IoT applications.
-
In October 2024, STMicroelectronics hosted its Industrial Summit in Shenzhen, spotlighting Smart Power and Smart Industrials for sustainable innovation. The event featured over 150 demos, including energy-efficient solutions using SiC, GaN, and solar-storage integration.
EnOcean specializes in energy harvesting wireless technology, offering MEMS-based solutions that convert ambient energy—such as motion, light, and temperature—into electricity. Their devices enable battery-free, self-powered sensors and controls, promoting sustainable, low-maintenance IoT applications in smart buildings, industrial automation, and connected consumer electronics.
-
In February 2024, EnOcean launched its EMDC energy-harvesting motion and activity sensors, enabling self-powered, batteryless monitoring for smart buildings. The sensor integrates occupancy, light, and activity detection to optimize lighting, space usage, and sustainability.
| Report Attributes | Details |
| Market Size in 2025E | USD 3.26 Billion |
| Market Size by 2033 | USD 10.50 Billion |
| CAGR | CAGR of 15.73% From 2026 to 2033 |
| Base Year | 2025E |
| Forecast Period | 2026-2033 |
| Historical Data | 2021-2024 |
| Report Scope & Coverage | Market Size, Segments Analysis, Competitive Landscape, Regional Analysis, DROC & SWOT Analysis, Forecast Outlook |
| Key Segments | • By Technology(Vibration Energy Harvesting, Thermal Energy Harvesting, Radio Frequency (RF) Energy Harvesting and Solar (Photovoltaic) Energy Harvesting) • By Deployment Type(Wired Energy Harvesting Systems and Wireless Energy Harvesting Systems) • By Power Range (Low-Power Devices (µW to mW) , Medium-to-High Power Devices (W to kW)) • By End User(Automotive, Industrial & Manufacturing, Military, Aerospace & Defense, and Building Automation & Consumer Electronics) |
| Regional Analysis/Coverage | North America (US, Canada), Europe (Germany, UK, France, Italy, Spain, Russia, Poland, Rest of Europe), Asia Pacific (China, India, Japan, South Korea, Australia, ASEAN Countries, Rest of Asia Pacific), Middle East & Africa (UAE, Saudi Arabia, Qatar, South Africa, Rest of Middle East & Africa), Latin America (Brazil, Argentina, Mexico, Colombia, Rest of Latin America). |
| Company Profiles | The MEMS Energy Harvesting Devices market companies are ABB, Analog Devices, EH 4 GmbH, EnOcean GmbH, Fujitsu, Holst Centre, Lam Research Corp, Parker Hannifin Corp, STMicroelectronics NV, Texas Instruments, Microchip Technology, Murata, NXP Semiconductors, Powercast Corp, Advanced Linear Devices, Silicon Labs, Maxim Integrated, Bosch Sensortec., Energous Corp and Others. |
Frequently Asked Questions
Ans: Asia-Pacific dominated the MEMS Energy Harvesting Devices Market in 2025E.
Ans: The “Solar (Photovoltaic) Energy Harvesting” segment dominated the MEMS Energy Harvesting Devices Market
Ans: Rising demand for self-powered IoT devices, wearables, and wireless sensors is the key driver of the MEMS Energy Harvesting Devices Market.
Ans: The MEMS Energy Harvesting Devices Market size was valued at USD 3.26 Billion in 2025E and is projected to reach USD 10.50 Billion by 2033, growing at a CAGR of 15.73% during 2026-2033.
Ans: The MEMS Energy Harvesting Devices Market is expected to grow at a CAGR of 15.73% during 2026-2033.
Get in Touch
