Jitter Attenuators Market Size & Trends:
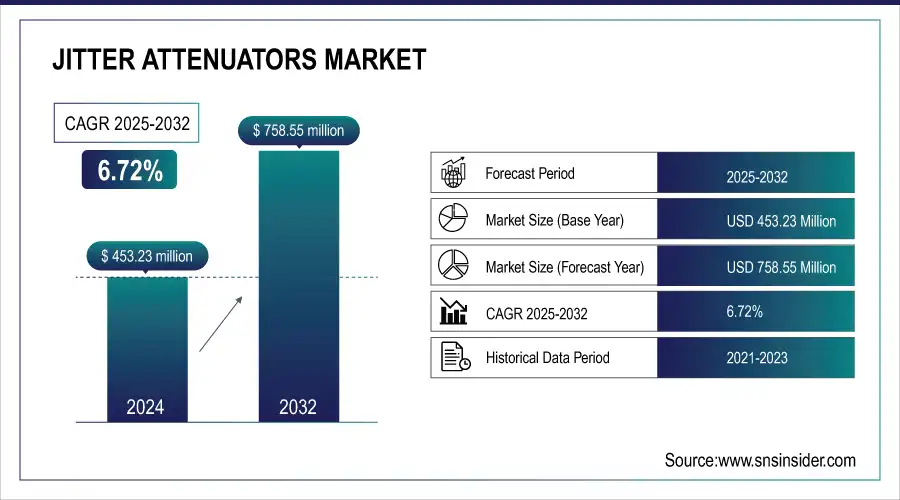
The Jitter Attenuators Market Size was valued at USD 453.23 million in 2024 and is expected to reach USD 758.55 million by 2032 and grow at a CAGR of 6.72% over the forecast period 2025-2032.
To Get more information On Jitter Attenuators Market - Request Free Sample Report
The global Jitter Attenuators Market is witnessing persistent growth backed by rising demand for high-speed data transfer, better signal integrity, and advanced communication technologies. The major applications in telecommunications, data centers, and consumer electronics are driving innovation, as improvements in digital and high-frequency attenuation solutions remain on the cutting edge, boosting system performance and lowering latency in various industries.
According to research, more than 80% of signal integrity failures in high-speed digital systems are caused by unmanaged jitter and timing noise, emphasizing the critical need for effective jitter attenuation solutions in these environments.
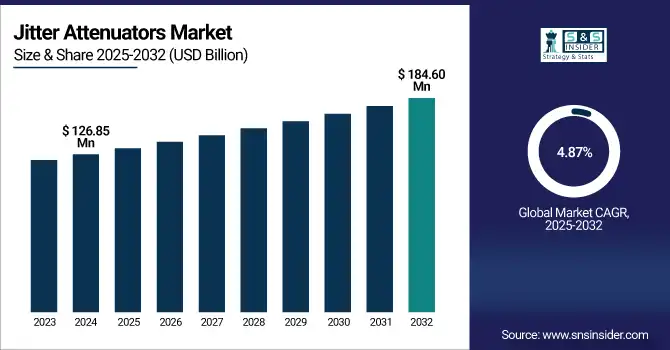
The U.S. Jitter Attenuators Market size was USD 126.85 million in 2024 and is expected to reach USD 184.60 million by 2032, growing at a CAGR of 4.87% over the forecast period of 2025–2032.
The United States Market is transforming with the increasing demand for signal transmission reliability in advanced digital systems. With industries taking on next-generation connectivity solutions, jitter attenuation is becoming imperative in maintaining performance stability. The market is further complemented by advancements in semiconductor technologies and greater investment in communications networks, especially for high-frequency and low-latency applications in strategic industries.
According to research, over 58% of U.S. mobile subscriptions are on 5G networks, which require stringent timing and jitter control to maintain consistent performance and signal integrity.
Jitter Attenuators Market Dynamics
Key Drivers:
-
Rising Adoption of High-Speed Data Communication Technologies Across Telecom and Data Center Applications Drives the Market Growth.
The rising preference for high-speed, low latency communication systems in stores, mobile internet applications, telecom, and data centers is significantly increasing the need for jitter attenuators. These technologies demand signal integrity and high frequency timing accuracy, where jitter can inhibit performance. Siklu Traditional wireline test and measurement equipment used for 5G, optical networks and high performance computing applications are dependent on the need to properly characterize and compensate for clock and data jitter and other signal integrity impairments. The increasing adoption of global internet, cloud computing, and streaming services is adding to the growth of the market in various verticals.
According to research, video streaming accounts for over 65% of global internet traffic, placing immense pressure on latency and jitter-sensitive infrastructure, including those used in connected and infotainment-driven vehicles.
Restrain:
-
Lack of Standardization in Jitter Measurement and Attenuation Techniques Hampers Consistent Implementation Across Industries.
The lack of a globally accepted framework for the monitoring and controlling of jitter is a major obstacle for the jitter attenuators market. Various industries and producers set their own testing standard and method, it results into difference of performance and application. This lack of standardisation makes development, testing and integration between different products challenging, even more in complex systems, where low-latency synchronisation is a must. This situation could potentially inhibit end-users’ adoption of jitter attenuators as they may fear the interoperability, and reliability, leading to impede wider market growth and delay innovation.
Opportunities:
-
Emergence of Next-Generation Automotive Electronics and ADAS Technologies Creates Lucrative Opportunities for Market Expansion.
With the increasing adoption of advanced driver assistance systems (ADAS), vehicle-to-everything (V2X) communication, and infotainment systems in new vehicles, there is a huge scope for the market. The applications require real-time transmission of data with the least signal degradation and latency. As automotive electronics transition towards increasingly autonomous and interconnected vehicle architectures, jitter attenuators become critical in facilitating smooth and safe communication between the subsystems. This trend will open significant growth opportunities, especially as electric and autonomous cars are increasingly gaining traction in global markets.
Challenges:
-
Design Complexity and Integration Issues in Miniaturized High-Frequency Systems Pose Significant Challenges to Market Growth.
As end-user applications call for smaller, higher performance equipment, bringing jitter attenuators into the fold of smaller form factor electronic systems is getting more difficult. Designing and manufacturing compact low power consumption and highly stable frequency signal sources is a challenging task due to the accuracy of construction using specialized materials that may complicate the design. In addition, compatibility with rapidly developing semiconductor technologies further complicates the matter. These integration and design issues may result in longer time-to-market and higher costs, creating a barrier for manufacturers who are trying to innovate at scale as performance demands grow.
Jitter Attenuators Market Segment Analysis:
By Type
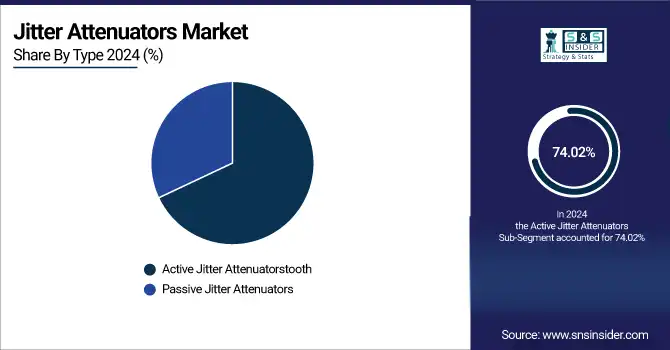
The Active Jitter Attenuators segment dominated with the highest revenue share of 74.02% in 2024, due to increasing demand for precision timing in telecom and data centers. Jitter attenuators companies such as Texas Instruments and Renesas have offered sophisticated digital solutions that have incorporated phase-locked loops (PLLs) and resulted in real-time jitter correction. This advanced technology improves signal integrity in high-speed networks in light of the market’s transition to 5G and the cloud. The prevalence of digital attenuators is due to their ability to facilitate the increasingly complex and high-frequency communication systems efficiently.
The Passive Jitter Attenuators segment is expected to have the fastest CAGR of 8.14% during 2025-2032 due to demand for cost-sensitive and low-power applications like consumer electronics and automotive. Players such as Skyworks and Murata have developed passive filtering components that enhance signal quality without additional power consumption. Their simplicity and trustworthiness render them appealing in small devices, aligning with jitter attenuators market trends toward low-power, miniature solutions for ever more diversified customer requirements.
By Technology
The Digital Jitter Attenuators segment dominated the highest revenue share of 65.91% in 2024, high-speed digital communication system is the main application of digital Jitter Attenuators. Key players have introduced advanced digital jitter attenuators with programmable logic functions and embedded PLLs to achieve higher timing precision. These advances are enabling the increasing demands on telecom infrastructure, 5G networks and data centers. Increased Performance and Versatility Boosts Segment Dominance in Market especially in Precision-Critical, High-Frequency Digital Systems.
The Analog Jitter Attenuators segment is expected to have the fastest CAGR of 7.80% between 2025 and 2032, supported by its advantage in low-noise, real-time signal applications. There are companies, including Maxim Integrated and Qorvo that developed analog attenuator for AV and RF applications. The solutions provide improved signal stability with ultra-low latency, which are conducive to broadcasting and automotive electronics. With an increasing need for tough analog designs for critical applications, growth in this segment is feeding jitter attenuators market growth.
By Frequency Range
The Medium Frequency (1–5 GHz) segment dominated the Jitter Attenuators Market in 2024 with a revenue contribution of 43.35%, and it is also used widely in 4G/5G base stations, satellite communication, and networking equipment. Renesas and Silicon Labs have released jitter attenuators tailored to this range, providing better clock-synchronization performance and lower phase noise. These technologies serve expanding needs in telecommunications and aviation, and the segment is key to providing secure, high-speed data transmission on mid-frequency networks around the world.
The High Frequency (> 5 GHz) segment will have the fastest growth rate of 7.58% from 2025 through 2032 due to its use in rising mmWave, automotive radar, and defense systems. Players like MACOM and NXP Semiconductors have launched innovative jitter attenuators that provide high-resolution signal integrity at ultra-high data rates. With the increasing demand for low-latency, high-frequency applications, this segment is evolving at a very fast pace and is set to become one of the most significant growth drivers in the global Jitter Attenuators Market.
By End-User
The Network Equipment Manufacturers dominated the Jitter Attenuators Market share of 41.86% share in revenue in 2024 due to the demand for high-performance, low-jitter signal solutions in switches, routers, and base stations. Over the past year or so, the critical issue of clock precision and signal distortion in networking hardware has been addressed with the latest new release from such companies as Broadcom and Marvell incorporating a second generation jitter attenuator. As the building block of worldwide connectivity, the stable demand of this segment highlights its leadership in maintaining signal integrity in the rapidly growing high speed digital communication systems.
The Telecom Service Providers segment is expected to expand at the fastest CAGR of 7.96% during 2025-2032, driven by the widespread global deployment of 5G networks and fiber-optic penetration. ADVA Optical Networking and Inphi Corporation are among the companies that have created jitter attenuation solutions designed for long-haul and metropolitan communication networks. These solutions enable high-bandwidth, low-latency transmission, critical for current telecom services. With network quality now a key differentiator in competition, telecom companies are investing more in jitter management, further accelerating the growth of this segment.
By Application
The Telecommunication Networks segment dominated the Jitter Attenuators Market with a 47.86% revenue share, due to growing demand for Jitter Attenuators in global telecom infrastructure with requirement for accurate time. There are companies like Pericom Semiconductor & Abracon LLC which have introduced jitter attenuators for telecom switchgear and mobile network backhaul systems. These are solutions that help you keep signal integrity in thick, fast-moving environments. The section domination is indicative of importance in enabling end-to-end connectivity in existing and upcoming telecommunication networks.
The Data Centers segment is also expected to advance at the fastest CAGR of 7.61% between 2025 and 2032, owing to rise in requirement for high-speed uninterrupted data flow in hyperscale and enterprise data centers. Precision timing solutions for data center clock trees and high-speed serial links are being offered by SiTime Corporation and IQD Frequency Products among others. These advances minimize timing jitter on sensitive processing tasks, furthering the Market move towards high-performance, data-centric networking infrastructure buildouts.
Jitter Attenuators Market Regional Analysis:
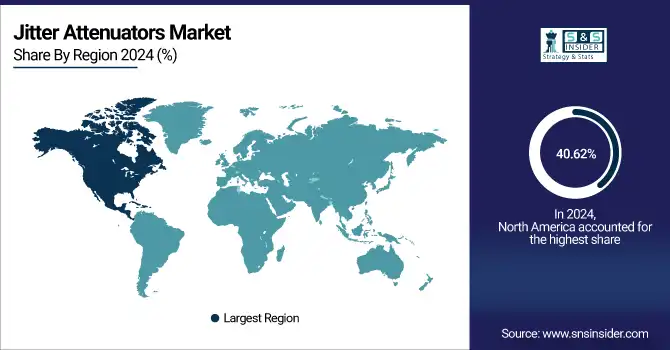
North America dominated the Market with a 40.62% share in terms of revenue in 2024, driven by the presence of state-of-the-art telecom infrastructure, a robust semiconductor ecosystem, and growing 5G deployment. Fox Electronics and Crystek Corporation are some of the players that have introduced jitter attenuation components for use in defense communication, data centers, and high-speed networking. The regional emphasis on technological advancements and early adoption of next-generation connectivity standards continues to prop up its leadership role within the global jitter attenuator market.
Get Customized Report as per Your Business Requirement - Enquiry Now
-
The U.S. leads the North American market because of its well-developed telecom infrastructure, high concentration of top semiconductor players, and early adoption of 5G technologies, which fuels steady demand for high-precision signal integrity and timing solutions across various industries.
The Asia Pacific region is expected to the fastest CAGR of 7.94% during 2025-2032 with growth stimulated by growing electronics manufacturing, aggressive rollout of 5G, and rising investment in cloud infrastructure. NDK and TXC Corporation are some of the players that have launched high-performance jitter attenuators that support telecom and consumer electronics applications. As nations such as China, South Korea, and India are investing significantly in digital transformation, the region is becoming one of the most important growth drivers for the Market.
-
The market in China will continue to be the largest for Asia Pacific jitter attenuators on the back of the region’s large-scale electronics manufacturing, accelerated roll-out of 5G infrastructure, and strong government backing for semiconductor innovation, positioning it as a prime market for high-frequency signal processing and timing component demand.
Europe is expected be a prominent market for Jitter Attenuators, due to electronics innovation in the region, especially in telecommunications, automotive technologies, and industrial automation. This demand for maximum speed data transfer, combined with a rapidly expanding deployment of 5G services and networks in Germany, France and the UK, is driving regional demand for accurate timing products.
-
Germany leads the Market in Europe because of its superior telecommunication infrastructure, robust industrial base, and large investments in 5G and digital transformation. The nation's leadership in electronics and automotive further fuels demand for high-performance timing components.
In Middle East & Africa, Saudi Arabia dominates the Market due to high investments in 5G technology and developing telecom infrastructure. In Latin America, Brazil is the dominant player due to growing telecom , rising demand for digital solutions, and high government initiatives in connectivity.
Jitter Attenuators Companies are:
Major Key Players in Jitter Attenuators Market are Texas Instruments Inc., Analog Devices, Inc., Renesas Electronics Corporation, Microchip Technology Inc., Skyworks Solutions, Inc., ON Semiconductor (onsemi), Maxim Integrated , Silicon Labs, Integrated Device Technology (IDT), Pericom Semiconductor.
Recent Development:
-
December 2024, Silicon Labs has also introduced new iterations of their Si5390 product. The latest versions are designed to provide more flexibility in programmable clocking solutions, allowing for integration in both 5G networks and high-performance data centers.
-
April 2024, Silicon Labs introduced a new version of the Si5390 clocking solution, aimed at improving jitter performance in telecommunications.
| Report Attributes | Details |
|---|---|
| Market Size in 2024 | USD 453.23 Million |
| Market Size by 2032 | USD 758.55 Million |
| CAGR | CAGR of 6.72% From 2025 to 2032 |
| Base Year | 2024 |
| Forecast Period | 2025-2032 |
| Historical Data | 2021-2023 |
| Report Scope & Coverage | Market Size, Segments Analysis, Competitive Landscape, Regional Analysis, DROC & SWOT Analysis, Forecast Outlook |
| Key Segments | • By Type (Active Jitter Attenuators, Passive Jitter Attenuators) • By Technology (Digital Jitter Attenuators, Analog Jitter Attenuators) • By Frequency Range (Low Frequency (< 1 GHz), Medium Frequency (1-5 GHz), High Frequency (> 5 GHz)) • By End-User (Network Equipment Manufacturers, Telecom Service Providers, Automotive, Consumer Electronics) • By Application (Telecommunication Networks, Broadcasting Equipment, Data Centers) |
| Regional Analysis/Coverage | North America (US, Canada, Mexico), Europe (Germany, France, UK, Italy, Spain, Poland, Turkey, Rest of Europe), Asia Pacific (China, India, Japan, South Korea, Singapore, Australia,Taiwan, Rest of Asia Pacific), Middle East & Africa (UAE, Saudi Arabia, Qatar, South Africa, Rest of Middle East & Africa), Latin America (Brazil, Argentina, Rest of Latin America) |
| Company Profiles | Texas Instruments Inc., Analog Devices, Inc., Renesas Electronics Corporation, Microchip Technology Inc., Skyworks Solutions, Inc., ON Semiconductor (onsemi), Maxim Integrated , Silicon Labs, Integrated Device Technology (IDT), Pericom Semiconductor. |
Frequently Asked Questions
Ans: Active Jitter Attenuators segment dominated the Jitter Attenuators Market.
Ans: The Jitter Attenuators Market size was USD 453.23 million in 2024 and is expected to reach USD 758.55 million by 2032.
Ans: North America dominated the Jitter Attenuators Market in 2024.
Ans: The major growth factor of the Jitter Attenuators Market is the increasing demand for high-speed, low-latency communication systems.
Ans: The Jitter Attenuators Market is expected to grow at a CAGR of 6.72% from 2025-2032.
Get in Touch
