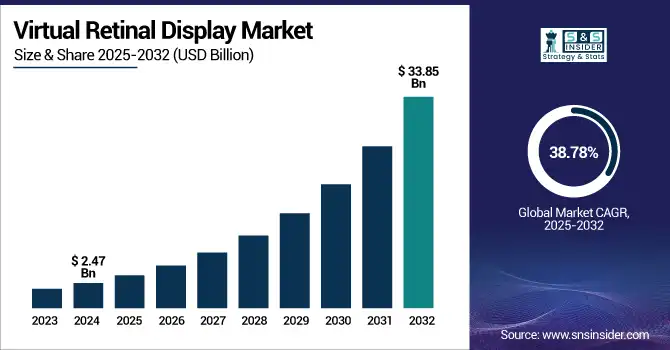
The Virtual Retinal Display Market Size was valued at USD 2.47 billion in 2024 and is expected to reach USD 33.85 billion by 2032 and grow at a CAGR of 38.78 % over the forecast period 2025-2032.
The global market is driven by such large trends as detailed technology and application segmentation combined with at the same time highly different regionally developments. The growth is driven primarily by increasing demand in the gaming, health care and defense sectors, along with the continued rapid development of display technology. Competition and innovation are driving increasingly rapid adoption, making the virtual retinal display a key enabler of immersive, high-fidelity visual displays around the world.
According to research, over 35% of enterprises worldwide have begun integrating virtual retinal displays into training, simulation, and design workflows as of 2023.
The U.S. Virtual Retinal Display Market size was USD 0.59 billion in 2024 and is expected to reach USD 7.26 billion by 2032, growing at a CAGR of 36.80 % over the forecast period of 2025–2032.
The US virtual retinal display market growth due to increase in prevalence of advance AR and wearable devices, major investment in healthcare and military across the region. Rising consumer awareness and immersion technology adoption in gaming and entertainment industry also contribute to the market. Moreover, the ongoing strong R&D investment together with positive government policies encourage technological developments and market establishment.
According to research, Over 50% of U.S. consumers are now aware of and willing to adopt immersive technologies, including AR glasses and VRD-enabled wearables.
Key Drivers:
Growing Demand for Enhanced Visual Display in Healthcare and Military Applications
The need for high-end, precise, real-time imaging in medical and military creates a massive boom for the virtual retinal display market. In medicine, such displays assist by enabling minimally invasive surgeries and diagnostics that enable surgeon to have clear, hands-free images and which help to make them more accurate and faster. In the military domain, better situational awareness through retinal displays increases the efficiency of missions and enhances the safety of personnel during complex operations. These are serious use cases and as a result they are driving the development, investment and adoption of Virtual Retinal Display and the associated markets in these high-value sectors on a global scale.
According to research, Military personnel using retinal display systems report up to a 40% improvement in situational awareness during complex missions, reducing risk and enhancing decision-making.
Restrain:
High Cost of Virtual Retinal Display Technology Limits Widespread Adoption
High cost of manufacturing and developing virtual retinal displays is a key restraint to the market. They depend on complex optics, sophisticated light sources and high level of calibration, which lead to high cost for these technologies to be operated by final users. High prices limit penetration in cost-sensitive markets, such as in developing countries. The need for custom hardware and software adds to the cost burden, making most companies dis-incentivized to adopt such solutions, causing the growth of the market to be significantly suppressed. In addition, the total cost is higher based on the continuous maintenance and technical support factor besides preventing widespread adoption.
Opportunities:
Rising Adoption of Virtual Retinal Displays in Automotive and Smart Wearables Presents Growth Potential
Increasing adoption of virtual retinal display in automotive heads-up display (HUD) and smart wearable devices create significant growth opportunities. The lightweight and high resolution displays are desired in such areas to present real-time information to the user in a unobtrusive manner. Connection to smart glasses and helmets via navigation and communication are more user-friendly and safer. Connected consumer devices and smart technologies have become increasingly popular, and manufacturers have an exciting market opportunity to innovate and monetize new offerings. Moreover, progress in sensor technology and AI application make these equipment more and attractive in function.
According to research, Advances in AI and sensor integration have improved HUD accuracy and responsiveness by over 25%, enhancing navigation and communication in smart wearables.
Challenges:
Complexity in Integration with Existing Systems Hampers Adoption
The virtual retinal display technology has become difficult to incorporate into existing devices and platforms. Incompatibility with different hardware and software ecologies can impose a longer development cycle and a higher development cost. This complicates the introduction of VRD systems in domains such as automotive, healthcare, and consumer electronics. Furthermore, providing a seamless user experience in various applications needs to be constantly reinvented and seriously field tested, on long product launch time frame and market penetration. Also, a lack of consistent protocols creates interoperability issues and also makes it challenging for seam-less integration and scaling across sectors.
By Technology
The Light Source segment dominated the Virtual Retinal Display Market with the highest revenue share of about 41.13% in 2024, due to their important role in providing brightness, clarity, and image quality. Light sources like laser diode and LED play essential roles in VRD systems, which can help produce bright images via high efficiency and real display excellent images on retina. Virtual retinal displays companies such as MicroVision Inc. have been fostering the development of small, low-power light source tech, notably for AR/VR applications, bolstering the segment’s industry lead. The increasing use in automotive HUDs and wearable displays serves to increasingly establish its leading market position.
The Optics segment is expected to grow at the fastest CAGR of about 40.12% from 2025 to 2032, because of the growing requirement of miniaturized and high performance optical devices. The cutting-edge optics provide sharp, clear images for great objective clarity of the outdoor environment, and perfect optics rendering texture for the task, this is key to a UHD experience. Magic Leap, Inc. has been instrumental in developing some of the most advanced optics systems for lightweight and high-resolution AR wearables, expediting awareness. This development is driving innovation and explosive growth in consumer and enterprise display applications. Growing interest towards 3D visualization and advancing real time imaging is simultaneously increasing the requirement for the next gen optical modules.
By Application
The Gaming and Entertainment segment dominated the Virtual Retinal Display Market in 2024, capturing a 32.87% revenue share, fuelled by the increasing requirement for high-quality, high-definition visual experiences. Virtual retinal displays yields vibrant real world image with less eye strain effect over extended uses thus are perfect for gamers and multimedia users. Immersive gaming technologies, like Sony Group Corporation, are spending in large amount for the retinal display systems, which is being effectively integrated to some of the next generation gaming headsets and entertainment systems. Rising interest toward e-sports markets and AR-based interactive storytelling is augmenting global demand for VRD-enabled entertainment solutions.
The Medical segment is projected to grow at the fastest CAGR of about 40.46% from 2025 to 2032, because of increasing incorporation of VRD in diagnostics, surgical and therapeutic instruments. These are capable of providing high-resolution, real-time image viewing for better operative and teleconsultation precision. There are several groups including Thermo Fisher Scientific Inc., who are investigating retinal display-based modalities for clinical imaging and diagnostics. With the advancement of digital health solutions, VRDs are growing in relevance within hospitals, clinics, and telemedicine platforms. The increasing preferences for minimally invasive surgeries along with wearable health tech will certainly escalate the medical industry outlook.
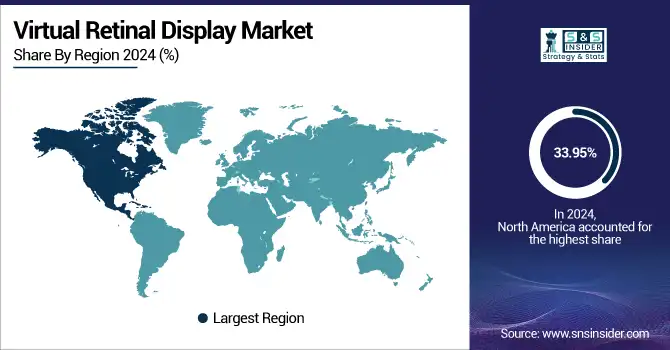
North America dominated the highest Virtual Retinal Display Market share of about 33.95% in 2024, due to early adoption of new technologies and a developed consumer electronics industry. The region has strong research and development facilities, a high investment in digital innovation and extensive use of AR/VR across industries, including healthcare, military and gaming. Rising prevalence of favorable regulatory policies and growing preference for sensory experiences are also instigating NA to maintain its dominance in the virtual retinal displays market.
US dominated the North American Market due to the technological advanced infrastructure, the high penetration of AR/VR devices, strong ecosystem for research and development, dynamic applications in healthcare, defense and entertainment industry, accompanied with significant consumer and institution investment in various innovations within the country.
Asia Pacific is expected to grow at the fastest CAGR of about 40.45% from 2025 to 2032, driven by growing R&D funding and application of AR/VR in different industries. The region’s smart device, digital healthcare, and immersive education platforms are all seeing investments grow. The region’s robust electronics manufacturing sector, growing urban population, and increasing disposable income levels are further boosting penetration. Moreover, government initiatives towards innovation along with increased adoption of wearable tech, further augments the virtual retinal display market progress.
China leads the market in the Asia Pacific Virtual Retinal Display Market on account of the huge consumer base, strong electronics manufacturing, rapid deployment of AR/VR, and government support for innovation, all creating a center for production and technology improvisation.
Europe holds a significant position in the Market, due to the growing investments in R&D and the applications of AR/VR technology in various industry verticals such as the healthcare, automobile, and manufacturing sectors. The area is underpinned by robust public sector efforts in both digital innovation and sustainability. Furthermore, growth in adoption of immersive learning techniques and visualization technologies is driving growing market opportunity in other European nations.
Germany dominates the Europe Market due to the presence of a large number of automotive, healthcare, and manufacturing companies along with a highly developed industrial sector that has led to the adoption of VRDs solutions and consequently to market growth.
In the Middle East & Africa, growth is driven by the UAE’s emphasis on smart technologies and healthcare, and in Latin America the large consumer base and expanding digital and medical sectors in Brazil help drive adoption, contributing to regional growth overall.
Major Key Players in Virtual Retinal Display Market are Magic Leap Inc., eMagin Corporation, Avegant Corporation, Texas Instruments Inc., Vuzix Corporation, QD Laser Co., Ltd., Analogix Semiconductor Inc., Himax Technologies Inc., Lumus Ltd., MicroVision Inc and others.
In May 2024, Magic Leap and Google announced a strategic partnership to advance the potential of XR technologies, focusing on innovative waveguide development and device ideation
February 2024, Vuzix introduced the M4000 Smart Glasses, featuring enhanced optics and processing capabilities, designed to deliver superior augmented reality experiences in various industrial applications.
Report Attributes | Details |
---|---|
Market Size in 2024 | USD 2.47 Billion |
Market Size by 2032 | USD 33.85 Billion |
CAGR | CAGR of 38.78% From 2025 to 2032 |
Base Year | 2024 |
Forecast Period | 2025-2032 |
Historical Data | 2021-2023 |
Report Scope & Coverage | Market Size, Segments Analysis, Competitive Landscape, Regional Analysis, DROC & SWOT Analysis, Forecast Outlook |
Key Segments | • By Technology (Optics, Driver and Controller Electronics, Light Source, Others) • By Application (Aerospace, Medical, Gaming and Entertainment, Sports, Training and Simulation, Others) |
Regional Analysis/Coverage | North America (US, Canada, Mexico), Europe (Germany, France, UK, Italy, Spain, Poland, Turkey, Rest of Europe), Asia Pacific (China, India, Japan, South Korea, Singapore, Australia,Taiwan, Rest of Asia Pacific), Middle East & Africa (UAE, Saudi Arabia, Qatar, South Africa, Rest of Middle East & Africa), Latin America (Brazil, Argentina, Rest of Latin America) |
Company Profiles | Magic Leap Inc., eMagin Corporation, Avegant Corporation, Texas Instruments Inc., Vuzix Corporation, QD Laser Co., Ltd., Analogix Semiconductor Inc., Himax Technologies Inc., Lumus Ltd., MicroVision Inc. |
Ans: The Virtual Retinal Display Market is expected to grow at a CAGR of 38.78 % from 2025-2032.
Ans: The Virtual Retinal Display Market size was USD 2.47 billion in 2024 and is expected to reach USD 33.85 billion by 2032.
Ans: The major growth factor of the Virtual Retinal Display Market is the increasing demand for immersive AR/VR experiences across gaming, healthcare, and industrial applications worldwide.
Ans: Light Source segment dominated the Virtual Retinal Display Market.
Ans: North America dominated the Virtual Retinal Display Market in 2024.
Table of Content
1. Introduction
1.1 Market Definition
1.2 Scope (Inclusion and Exclusions)
1.3 Research Assumptions
2. Executive Summary
2.1 Market Overview
2.2 Regional Synopsis
2.3 Competitive Summary
3. Research Methodology
3.1 Top-Down Approach
3.2 Bottom-up Approach
3.3. Data Validation
3.4 Primary Interviews
4. Market Dynamics Impact Analysis
4.1 Market Driving Factors Analysis
4.1.2 Drivers
4.1.2 Restraints
4.1.3 Opportunities
4.1.4 Challenges
4.2 PESTLE Analysis
4.3 Porter’s Five Forces Model
5. Statistical Insights and Trends Reporting
5.1 Gamification & User Engagement Metrics
5.2 Portability & Battery Efficiency Stats
5.3 Digital Twin & Metaverse Compatibility Index
5.4 Market Cannibalization Rate
6. Competitive Landscape
6.1 List of Major Companies, By Region
6.2 Market Share Analysis, By Region
6.3 Product Benchmarking
6.3.1 Product specifications and features
6.3.2 Pricing
6.4 Strategic Initiatives
6.4.1 Marketing and promotional activities
6.4.2 Distribution and supply chain strategies
6.4.3 Expansion plans and new product launches
6.4.4 Strategic partnerships and collaborations
6.5 Technological Advancements
6.6 Market Positioning and Branding
7. Virtual Retinal Display Market Segmentation, By Technology
7.1 Chapter Overview
7.2 Optics
7.2.1 Optics Market Trends Analysis (2021-2032)
7.2.2 Optics Market Size Estimates and Forecasts to 2032 (USD Billion)
7.3 Driver and Controller Electronics
7.3.1 Driver and Controller Electronics Market Trends Analysis (2021-2032)
7.3.2 Driver and Controller Electronics Market Size Estimates and Forecasts to 2032 (USD Billion)
7.4 Light Source
7.4.1 Light Source Market Trends Analysis (2021-2032)
7.4.2 Light Source Market Size Estimates and Forecasts to 2032 (USD Billion)
7.5 Others
7.5.1 Others Market Trends Analysis (2021-2032)
7.5.2 Others Market Size Estimates and Forecasts to 2032 (USD Billion)
8. Virtual Retinal Display Market Segmentation, by Application
8.1 Chapter Overview
8.2 Aerospace
8.2.1 Aerospace Market Trends Analysis (2021-2032)
8.2.2 Aerospace Market Size Estimates and Forecasts to 2032 (USD Billion)
8.3 Medical
8.3.1 Medical Market Trends Analysis (2021-2032)
8.3.2 Medical Market Size Estimates and Forecasts to 2032 (USD Billion)
8.4 Gaming and Entertainment
8.4.1 Gaming and Entertainment Market Trends Analysis (2021-2032)
8.4.2 Gaming and Entertainment Market Size Estimates and Forecasts to 2032 (USD Billion)
8.5 Sports
8.5.1 Sports Market Trends Analysis (2021-2032)
8.5.2 Sports Market Size Estimates and Forecasts to 2032 (USD Billion)
8.6 Training and Simulation
8.6.1 Training and Simulation Market Trends Analysis (2021-2032)
8.6.2 Training and Simulation Market Size Estimates and Forecasts to 2032 (USD Billion)
8.7 Others
8.7.1 Others Market Trends Analysis (2021-2032)
8.7.2 Others Market Size Estimates and Forecasts to 2032 (USD Billion)
9. Regional Analysis
9.1 Chapter Overview
9.2 North America
9.2.1 Trends Analysis
9.2.2 North America Virtual Retinal Display Market Estimates and Forecasts, by Country (2021-2032) (USD Billion)
9.2.3 North America Virtual Retinal Display Market Estimates and Forecasts, By Technology (2021-2032) (USD Billion)
9.2.4 North America Virtual Retinal Display Market Estimates and Forecasts, by Application (2021-2032) (USD Billion)
9.2.5 USA
9.2.5.1 USA Virtual Retinal Display Market Estimates and Forecasts, By Technology (2021-2032) (USD Billion)
9.2.5.2 USA Virtual Retinal Display Market Estimates and Forecasts, by Application (2021-2032) (USD Billion)
9.2.6 Canada
9.2.6.1 Canada Virtual Retinal Display Market Estimates and Forecasts, By Technology (2021-2032) (USD Billion)
9.2.6.2 Canada Virtual Retinal Display Market Estimates and Forecasts, by Application (2021-2032) (USD Billion)
9.2.7 Mexico
9.2.7.1 Mexico Virtual Retinal Display Market Estimates and Forecasts, By Technology (2021-2032) (USD Billion)
9.2.7.2 Mexico Virtual Retinal Display Market Estimates and Forecasts, by Application (2021-2032) (USD Billion)
9.3 Europe
9.3.1 Trends Analysis
9.3.2 Europe Virtual Retinal Display Market Estimates and Forecasts, by Country (2021-2032) (USD Billion)
9.3.3 Europe Virtual Retinal Display Market Estimates and Forecasts, By Technology (2021-2032) (USD Billion)
9.3.4 Europe Virtual Retinal Display Market Estimates and Forecasts, by Application (2021-2032) (USD Billion)
9.3.5 Germany
9.3.5.1 Germany Virtual Retinal Display Market Estimates and Forecasts, By Technology (2021-2032) (USD Billion)
9.3.5.2 Germany Virtual Retinal Display Market Estimates and Forecasts, by Application (2021-2032) (USD Billion)
9.3.6 France
9.3.6.1 France Virtual Retinal Display Market Estimates and Forecasts, By Technology (2021-2032) (USD Billion)
9.3.6.2 France Virtual Retinal Display Market Estimates and Forecasts, by Application (2021-2032) (USD Billion)
9.3.7 UK
9.3.7.1 UK Virtual Retinal Display Market Estimates and Forecasts, By Technology (2021-2032) (USD Billion)
9.3.7.2 UK Virtual Retinal Display Market Estimates and Forecasts, by Application (2021-2032) (USD Billion)
9.3.8 Italy
9.3.8.1 Italy Virtual Retinal Display Market Estimates and Forecasts, By Technology (2021-2032) (USD Billion)
9.3.8.2 Italy Virtual Retinal Display Market Estimates and Forecasts, by Application (2021-2032) (USD Billion)
9.3.9 Spain
9.3.9.1 Spain Virtual Retinal Display Market Estimates and Forecasts, By Technology (2021-2032) (USD Billion)
9.3.9.2 Spain Virtual Retinal Display Market Estimates and Forecasts, by Application (2021-2032) (USD Billion)
9.3.10 Poland
9.3.10.1 Poland Virtual Retinal Display Market Estimates and Forecasts, By Technology (2021-2032) (USD Billion)
9.3.10.2 Poland Virtual Retinal Display Market Estimates and Forecasts, by Application (2021-2032) (USD Billion)
9.3.11 Turkey
9.3.11.1 France Virtual Retinal Display Market Estimates and Forecasts, By Technology (2021-2032) (USD Billion)
9.3.11.2 France Virtual Retinal Display Market Estimates and Forecasts, by Application (2021-2032) (USD Billion)
9.3.12 Rest of Europe
9.3.12.1 UK Virtual Retinal Display Market Estimates and Forecasts, By Technology (2021-2032) (USD Billion)
9.3.12.2 UK Virtual Retinal Display Market Estimates and Forecasts, by Application (2021-2032) (USD Billion)
9.4 Asia-Pacific
9.4.1 Trends Analysis
9.4.2 Asia-Pacific Virtual Retinal Display Market Estimates and Forecasts, by Country (2021-2032) (USD Billion)
9.4.3 Asia-Pacific Virtual Retinal Display Market Estimates and Forecasts, By Technology (2021-2032) (USD Billion)
9.4.4 Asia-Pacific Virtual Retinal Display Market Estimates and Forecasts, by Application (2021-2032) (USD Billion)
9.4.5 China
9.4.5.1 China Virtual Retinal Display Market Estimates and Forecasts, By Technology (2021-2032) (USD Billion)
9.4.5.2 China Virtual Retinal Display Market Estimates and Forecasts, by Application (2021-2032) (USD Billion)
9.4.6 India
9.4.5.1 India Virtual Retinal Display Market Estimates and Forecasts, By Technology (2021-2032) (USD Billion)
9.4.5.2 India Virtual Retinal Display Market Estimates and Forecasts, by Application (2021-2032) (USD Billion)
9.4.7 Japan
9.4.7.1 Japan Virtual Retinal Display Market Estimates and Forecasts, By Technology (2021-2032) (USD Billion)
9.4.7.2 Japan Virtual Retinal Display Market Estimates and Forecasts, by Application (2021-2032) (USD Billion)
9.4.8 South Korea
9.4.8.1 South Korea Virtual Retinal Display Market Estimates and Forecasts, By Technology (2021-2032) (USD Billion)
9.4.8.2 South Korea Virtual Retinal Display Market Estimates and Forecasts, by Application (2021-2032) (USD Billion)
9.4.9 Singapore
9.4.9.1 Singapore Virtual Retinal Display Market Estimates and Forecasts, By Technology (2021-2032) (USD Billion)
9.4.9.2 Singapore Virtual Retinal Display Market Estimates and Forecasts, by Application (2021-2032) (USD Billion)
9.4.10 Australia
9.4.10.1 Australia Virtual Retinal Display Market Estimates and Forecasts, By Technology (2021-2032) (USD Billion)
9.4.10.2 Australia Virtual Retinal Display Market Estimates and Forecasts, by Application (2021-2032) (USD Billion)
9.4.11 Taiwan
9.4.11.1 Taiwan Virtual Retinal Display Market Estimates and Forecasts, By Technology (2021-2032) (USD Billion)
9.4.11.2 Taiwan Virtual Retinal Display Market Estimates and Forecasts, by Application (2021-2032) (USD Billion)
9.4.12 Rest of Asia-Pacific
9.4.12.1 Rest of Asia-Pacific Virtual Retinal Display Market Estimates and Forecasts, By Technology (2021-2032) (USD Billion)
9.4.12.2 Rest of Asia-Pacific Virtual Retinal Display Market Estimates and Forecasts, by Application (2021-2032) (USD Billion)
9.5 Middle East and Africa
9.5.1 Trends Analysis
9.5.2 Middle East and Africa Virtual Retinal Display Market Estimates and Forecasts, by Country (2021-2032) (USD Billion)
9.5.3 Middle East and Africa Virtual Retinal Display Market Estimates and Forecasts, By Technology (2021-2032) (USD Billion)
9.5.4 Middle East and Africa Virtual Retinal Display Market Estimates and Forecasts, by Application (2021-2032) (USD Billion)
9.5.5 UAE
9.5.5.1 UAE Virtual Retinal Display Market Estimates and Forecasts, By Technology (2021-2032) (USD Billion)
9.5.5.2 UAE Virtual Retinal Display Market Estimates and Forecasts, by Application (2021-2032) (USD Billion)
9.5.6 Saudi Arabia
9.5.6.1 Saudi Arabia Virtual Retinal Display Market Estimates and Forecasts, By Technology (2021-2032) (USD Billion)
9.5.6.2 Saudi Arabia Virtual Retinal Display Market Estimates and Forecasts, by Application (2021-2032) (USD Billion)
9.5.7 Qatar
9.5.7.1 Qatar Virtual Retinal Display Market Estimates and Forecasts, By Technology (2021-2032) (USD Billion)
9.5.7.2 Qatar Virtual Retinal Display Market Estimates and Forecasts, by Application (2021-2032) (USD Billion)
9.5.8 South Africa
9.5.8.1 South Africa Virtual Retinal Display Market Estimates and Forecasts, By Technology (2021-2032) (USD Billion)
9.5.8.2 South Africa Virtual Retinal Display Market Estimates and Forecasts, by Application (2021-2032) (USD Billion)
9.5.9 Rest of Middle East & Africa
9.5.9.1 Rest of Middle East & Africa Virtual Retinal Display Market Estimates and Forecasts, By Technology (2021-2032) (USD Billion)
9.5.9.2 Rest of Middle East & Africa Virtual Retinal Display Market Estimates and Forecasts, by Application (2021-2032) (USD Billion)
9.6 Latin America
9.6.1 Trends Analysis
9.6.2 Latin America Virtual Retinal Display Market Estimates and Forecasts, by Country (2021-2032) (USD Billion)
9.6.3 Latin America Virtual Retinal Display Market Estimates and Forecasts, By Technology (2021-2032) (USD Billion)
9.6.4 Latin America Virtual Retinal Display Market Estimates and Forecasts, by Application (2021-2032) (USD Billion)
9.6.5 Brazil
9.6.5.1 Brazil Virtual Retinal Display Market Estimates and Forecasts, By Technology (2021-2032) (USD Billion)
9.6.5.2 Brazil Virtual Retinal Display Market Estimates and Forecasts, by Application (2021-2032) (USD Billion)
9.6.6 Argentina
9.6.6.1 Argentina Virtual Retinal Display Market Estimates and Forecasts, By Technology (2021-2032) (USD Billion)
9.6.6.2 Argentina Virtual Retinal Display Market Estimates and Forecasts, by Application (2021-2032) (USD Billion)
9.6.7 Rest of Latin America
9.6.7.1 Rest of Latin America Virtual Retinal Display Market Estimates and Forecasts, By Technology (2021-2032) (USD Billion)
9.6.7.2 Rest of Latin America Virtual Retinal Display Market Estimates and Forecasts, by Application (2021-2032) (USD Billion)
10. Company Profiles
10.1 Magic Leap Inc.
10.1.1 Company Overview
10.1.2 Financial
10.1.3 Products/ Services Offered
10.1.4 SWOT Analysis
10.2 eMagin Corporation
10.2.1 Company Overview
10.2.2 Financial
10.2.3 Products/ Services Offered
10.2.4 SWOT Analysis
10.3 Avegant Corporation
10.3.1 Company Overview
10.3.2 Financial
10.3.3 Products/ Services Offered
10.3.4 SWOT Analysis
10.4 Texas Instruments Inc.
10.4.1 Company Overview
10.4.2 Financial
10.4.3 Products/ Services Offered
10.4.4 SWOT Analysis
10.5 Vuzix Corporation
10.5.1 Company Overview
10.5.2 Financial
10.5.3 Products/ Services Offered
10.5.4 SWOT Analysis
10.6 QD Laser Co., Ltd.
10.6.1 Company Overview
10.6.2 Financial
10.6.3 Products/ Services Offered
10.6.4 SWOT Analysis
10.7 Analogix Semiconductor Inc.
10.7.1 Company Overview
10.7.2 Financial
10.7.3 Products/ Services Offered
10.7.4 SWOT Analysis
10.8 Himax Technologies Inc.
10.8.1 Company Overview
10.8.2 Financial
10.8.3 Products/ Services Offered
10.8.4 SWOT Analysis
10.9 Lumus Ltd.
10.9.1 Company Overview
10.9.2 Financial
10.9.3 Products/ Services Offered
10.9.4 SWOT Analysis
10.10 MicroVision Inc.
10.10.1 Company Overview
10.10.2 Financial
10.10.3 Products/ Services Offered
10.10.4 SWOT Analysis
11. Use Cases and Best Practices
12. Conclusion
An accurate research report requires proper strategizing as well as implementation. There are multiple factors involved in the completion of good and accurate research report and selecting the best methodology to compete the research is the toughest part. Since the research reports we provide play a crucial role in any company’s decision-making process, therefore we at SNS Insider always believe that we should choose the best method which gives us results closer to reality. This allows us to reach at a stage wherein we can provide our clients best and accurate investment to output ratio.
Each report that we prepare takes a timeframe of 350-400 business hours for production. Starting from the selection of titles through a couple of in-depth brain storming session to the final QC process before uploading our titles on our website we dedicate around 350 working hours. The titles are selected based on their current market cap and the foreseen CAGR and growth.
The 5 steps process:
Step 1: Secondary Research:
Secondary Research or Desk Research is as the name suggests is a research process wherein, we collect data through the readily available information. In this process we use various paid and unpaid databases which our team has access to and gather data through the same. This includes examining of listed companies’ annual reports, Journals, SEC filling etc. Apart from this our team has access to various associations across the globe across different industries. Lastly, we have exchange relationships with various university as well as individual libraries.
Step 2: Primary Research
When we talk about primary research, it is a type of study in which the researchers collect relevant data samples directly, rather than relying on previously collected data. This type of research is focused on gaining content specific facts that can be sued to solve specific problems. Since the collected data is fresh and first hand therefore it makes the study more accurate and genuine.
We at SNS Insider have divided Primary Research into 2 parts.
Part 1 wherein we interview the KOLs of major players as well as the upcoming ones across various geographic regions. This allows us to have their view over the market scenario and acts as an important tool to come closer to the accurate market numbers. As many as 45 paid and unpaid primary interviews are taken from both the demand and supply side of the industry to make sure we land at an accurate judgement and analysis of the market.
This step involves the triangulation of data wherein our team analyses the interview transcripts, online survey responses and observation of on filed participants. The below mentioned chart should give a better understanding of the part 1 of the primary interview.
Part 2: In this part of primary research the data collected via secondary research and the part 1 of the primary research is validated with the interviews from individual consultants and subject matter experts.
Consultants are those set of people who have at least 12 years of experience and expertise within the industry whereas Subject Matter Experts are those with at least 15 years of experience behind their back within the same space. The data with the help of two main processes i.e., FGDs (Focused Group Discussions) and IDs (Individual Discussions). This gives us a 3rd party nonbiased primary view of the market scenario making it a more dependable one while collation of the data pointers.
Step 3: Data Bank Validation
Once all the information is collected via primary and secondary sources, we run that information for data validation. At our intelligence centre our research heads track a lot of information related to the market which includes the quarterly reports, the daily stock prices, and other relevant information. Our data bank server gets updated every fortnight and that is how the information which we collected using our primary and secondary information is revalidated in real time.
Step 4: QA/QC Process
After all the data collection and validation our team does a final level of quality check and quality assurance to get rid of any unwanted or undesired mistakes. This might include but not limited to getting rid of the any typos, duplication of numbers or missing of any important information. The people involved in this process include technical content writers, research heads and graphics people. Once this process is completed the title gets uploader on our platform for our clients to read it.
Step 5: Final QC/QA Process:
This is the last process and comes when the client has ordered the study. In this process a final QA/QC is done before the study is emailed to the client. Since we believe in giving our clients a good experience of our research studies, therefore, to make sure that we do not lack at our end in any way humanly possible we do a final round of quality check and then dispatch the study to the client.
Key Segments:
By Technology
Optics
Driver and Controller Electronics
Light Source
Others
By Application
Aerospace
Medical
Gaming and Entertainment
Sports
Training and Simulation
Others
Request for Segment Customization as per your Business Requirement: Segment Customization Request
Regional Coverage:
North America
US
Canada
Mexico
Europe
Germany
France
UK
Italy
Spain
Poland
Turkey
Rest of Europe
Asia Pacific
China
India
Japan
South Korea
Singapore
Australia
Taiwan
Rest of Asia Pacific
Middle East & Africa
UAE
Saudi Arabia
Qatar
South Africa
Rest of Middle East & Africa
Latin America
Brazil
Argentina
Rest of Latin America
Request for Country Level Research Report: Country Level Customization Request
Available Customization
With the given market data, SNS Insider offers customization as per the company’s specific needs. The following customization options are available for the report:
Detailed Volume Analysis
Criss-Cross segment analysis (e.g. Product X Application)
Competitive Product Benchmarking
Geographic Analysis
Additional countries in any of the regions
Customized Data Representation
Detailed analysis and profiling of additional market players