MEP Software Market Size & Overview:
To Get More Information on MEP Software Market - Request Sample Report
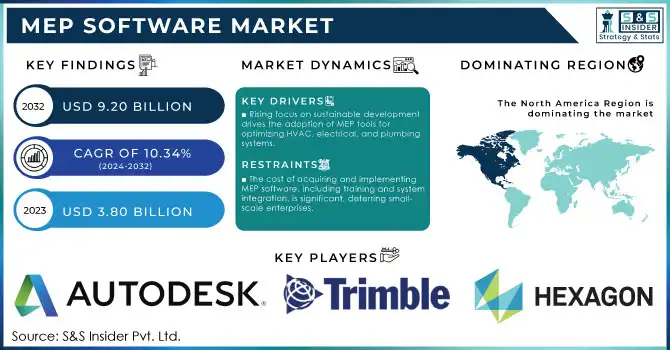
MEP Software Market was valued at USD 3.80 billion in 2023 and is expected to reach USD 9.20 Billion by 2032, growing at a CAGR of 10.34% from 2024-2032.
The Mechanical, Electrical, and Plumbing (MEP) software is an integral part of modern construction and infrastructure development, offering building systems design, analysis, and management technologies. They improve the collaboration of the architects, engineers, and contractors ensuring that the project gets completed in time and without mistakes. A major factor driving the market growth is the rapid development of energy-efficient construction and smart buildings across the globe. The rise in usage of Building Information Modelling (BIM) software has changed the way projects are envisioned and executed. As an example of this, the U.S. Department of Energy has highlighted a consistent increase in energy-dependable construction certifications utilizing tools such as MEP software to make stringent sustainability requirements. For example, the Mission for Smart Cities in India: includes MEP solutions that are seamlessly integrated into a smart energy, water, and waste management system. Another revolution has happened with the emergence of cloud-ready MEP software solutions. Cloud-based platforms allow for real-time collaboration and sharing of data, ensuring efficient project delivery. For large urban projects, seamless 3D modeling and clash detection across different disciplines is essential, and using an MEP product such as Autodesk Revit together with an open BIM model viewer (free to view and share 3D BIM files) is one way of achieving this.
Integration with IoT is yet another game changer, allowing predictive maintenance of the building systems. For instance — Modern MEP Software is powered through IoT which enables monitoring the performance of HVAC, hence optimally using energy in a commercial building.
In addition, due to the increasing demand for green construction and governing regulations, companies are adopting MEP software to meet environmental standards. Such tools are invaluable for meeting stringent emissions regulations in parts of Europe, for example.
With the growing complexity in construction projects around the world, the demand for the MEP software market is expected to boost steadily, through technological innovation and sustainable development practices. An important part of the future of modern, efficient, and environmentally sound infrastructure projects, this dynamic market
MEP Software Market Dynamics
Drivers
-
Facilitates enhanced collaboration, visualization, and error mitigation in construction projects.
-
Rising focus on sustainable development drives the adoption of MEP tools for optimizing HVAC, electrical, and plumbing systems.
-
Enables predictive maintenance and smart building management, enhancing operational efficiency.
MEP software is transforming how efficiently and effectively buildings operate, thanks to features such as predictive maintenance and smart building management. By embedding IoT sensors into different systems of the building spectrum and combining them with AI algorithms in MEP software, predictive maintenance can monitor building systems such as HVAC, electrical, and plumbing networks in real time. The software collects data on the performance of the system and the environment, which will help smoothen out your maintenance process by detecting early signs of wear, failures, or inefficiencies so that the maintenance crew can make adjustments before it turns into an expensive repair or downtime event. Consider a commercial entity that has been fitted with IoT-supported HVAC units; here, the MEP software might monitor the energy consumption trends and any abnormality, such as dirty filters or motor failure. The software has actionable insights on when to schedule maintenance to avoid surprise outages while increasing the number of years equipment can last. This ability not only reduces operational costs but also provides the occupants with a consistent and comfortable environment.
By centralizing control and understanding of different building systems, smart building management increases operational efficiency. MEP software also allows for better coordination between lighting, security, energy management, and water supply systems to facilitate optimal resource allocation and reduce wastage. In the case of contemporary smart city initiatives like the Punggol Digital District in Singapore, MEP software helps consolidate all energy-using IoT devices across many buildings to track and regulate energy usage for sustainability goals and to save costs. Awareness of such technologies is rising on this need to create a cost-effective solution for the management of increasingly complex building infrastructures, particularly in large commercial and industrial facilities. Moreover, the rise of predictive maintenance and smart management systems is further boosted by compliance with energy efficiency regulations and the growing demand for green building designs. To summarize, by providing predictive maintenance and facilitating smart building management, MEP software decreases costs and downtime, while also aiding in the worldwide transition to more sustainable, efficient, and intelligent building management — an important evolution in the construction and facility management industries.
Restraints
-
The cost of acquiring and implementing MEP software, including training and system integration, is significant, deterring small-scale enterprises.
-
Difficulty in seamlessly integrating MEP software with legacy systems or other existing platforms slows adoption in traditional construction environments.
-
A shortage of professionals trained in advanced MEP software tools restricts optimal utilization, especially in developing regions.
One of the major restraining factors of the MEP (Mechanical, Electrical, and Plumbing) software market is the low availability of skilled workforce to operate advanced tools, especially in developing regions. The scarcity is due to insufficient training facilities, lack of knowledge about the merits of digitalization in construction, and high costs related to Professional expertise acquisition. MEP software provides numerous benefits but is challenging to harness due to a lack of resource talent, and companies may not fully seize the opportunity to enforce MEP features correctly or in the best way.
This means that tasks like 3D design, clash detection predict premises maintenance, etc. would need hands-on Revit or AutoCAD MEP skillset. In areas with poorly developed infrastructure or poor access to technical education, the workforce has little experience using such tools therefore slowing down project delivery and decreasing software adoption levels.
Additionally, as more building smart initiatives get adopted and construction complexity increases, demand for talent is soaring. This can create a talent gap, as there are not sufficient people who are trained. Not only does this challenge limit the growth of the market across these geographical areas but it also increases costs for executing the projects as organizations need to pay hefty amounts in training or hire costly external consultants.
To tackle this problem, software providers are teaming up with educational institutions to develop targeted training programs and accreditations. Emerging economy governments are also taking steps to expand vocational training programs in their countries to cater to the rapidly increasing demand for skilled labor. However, the gap of skilled manpower is the limiting factor in this respect and therefore needs fresh impetus in training and awareness so that MEP software can gain a bigger share of the global market.
MEP Software Market Segment Analysis
By Software
The BIM MEP software segment held the largest market share of 70.28% owing to the growing demand for BIM in the design, construction, and management of MEP (mechanical, electrical, and plumbing) systems. In contemporary building activities, increased collaboration, design accuracy, and operational efficiency. With features that optimize workflows, minimize mistakes, and facilitate data updates at the moment, more businesses are embracing the software. The segment is anticipated to grow due to the coupling of BIM with other building systems and the increasing focus on the smart buildings market, along with a vibrant future for this segment as companies are prioritizing energy-efficient and sustainable designs.
The CAD MEP software segment is expected to have the fastest CAGR of 11.22% from 2024 to 2032, as direct and accurate design and drafting tools in the MEP field continue to be in demand. Another common type of software is CAD, which is used to represent 2D and 3D images of systems such as mechanical, electrical, and plumbing. Due to their convenience, affordability, and compatibility with other design applications, it is a well-used utility. This segment is anticipated to grow due to technological advancements, cloud-based solutions, and an increasing trend toward automation in the design process. The CAD MEP software will witness remarkable growth in the years to come owing to the rising need for smart infrastructure and automation.
By Application
The electrical segment held the largest market share of 46.70% in 2023, as electrical systems are integral to every construction project. Electrical systems are ubiquitous elements critical to the function of modern buildings, being the lifeline of complex power distribution, lighting, and communication networks. Growing emphasis on smart buildings, energy-efficient solutions, and the uptake of renewable energy sources has supported the need for electrical design and management. Moreover, the growth is also propelled by the development of electrotechnics, automation and sustainability. The electrical segment is expected to sustain its leadership and grow at a steady pace, driven by innovations in energy management and renewable energy integration, as urbanization and industrialization continue to increase across the globe.
The mechanical segment is projected to grow the fastest CAGR of 11.70% during the forecast period due to the importance of HVACs (heating, ventilation, and air-conditioned systems) in modern buildings; the HVACs provide a necessary element of comfort. The growing need for energy saving, sustainability, and low carbon emissions is leading to the implementation of complex mechanical systems for buildings with many commercial and residential properties. As buildings become smarter and more connected, the need for advanced, intelligent HVAC solutions is driving this automation. Moreover, the growth opportunities for the mechanical segment are highly favorable due to the development of green buildings and the ongoing initiatives to minimize carbon footprints. Quest has helped revolutionize the mechanical application and, as technology advances, this will only be further incorporated into growing sustainable efficient building solutions.
Regional Analysis
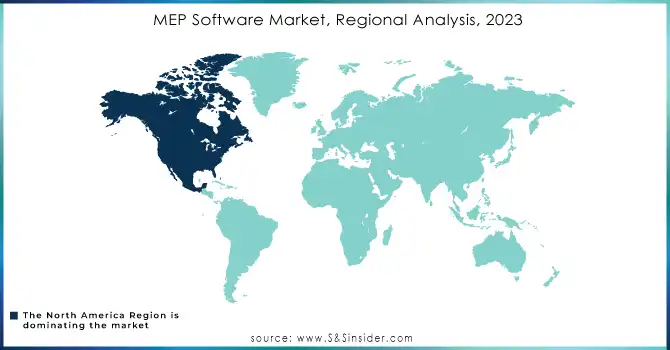
North America dominated the market in 2023 and represented a significant revenue share, due to its advanced infrastructure, high adoption of cutting-edge technologies, and significant investments in construction and smart building projects. The region's strong demand for energy-efficient systems and sustainable building practices has also contributed to the market’s growth. The widespread use of BIM and CAD software in construction projects, particularly in the U.S. and Canada, has supported the dominance of North America in the market. Additionally, government regulations and incentives promoting energy conservation and smart technologies in the construction sector are driving further growth. As more industries adopt integrated building systems and digital technologies, North America is expected to continue leading the market, with sustained growth in the coming years.
Asia-Pacific is registering the highest CAGR during the forecast period, driven by rapid urbanization, infrastructure development, and increasing adoption of modern technologies in countries like China, India, and Japan. The region is experiencing a surge in construction activities, particularly in emerging markets, which is propelling the demand for MEP software. Additionally, the growing focus on sustainability, energy efficiency, and smart cities has fueled the adoption of advanced BIM and CAD software solutions. As the construction industry in Asia-Pacific embraces digital transformation, the market for MEP software is expected to expand rapidly. Future growth will be supported by government initiatives, rising middle-class populations, and the continued development of mega infrastructure projects in key markets.
Do You Need any Customization Research on MEP Software Market - Enquire Now
Key Players
Autodesk - Revit MEP
Trimble - Tekla Structures
Hexagon - Smart MEP
Dassault Systèmes - CATIA
Bentley Systems - OpenBuildings Designer
Nemetschek Group - Allplan
Siemens - Desigo CC
AVEVA - AVEVA Everything 3D (E3D)
Procore Technologies - Procore MEP
Graphisoft - ARCHICAD
CYPE - CYPECAD MEP
MagiCAD - MagiCAD for Revit
IES - IESVE
Fiatech - Techno-Structural MEP
Kreon - Scan-to-BIM
Vico Software - Vico Office
ZWSOFT - ZWCAD
Cadalyst - AutoCAD MEP
Bluebeam - Revu
BIMobject - BIMobject Cloud
Recent Developments
In January 2024, Trimble enhanced its MEP software portfolio by incorporating BIM (Building Information Modeling), optimizing project workflows and fostering better collaboration among contractors. This integration aims to streamline the design and construction processes.
Autodesk launched Revit 2024 in February 2024, introducing advanced features tailored for electrical, mechanical, and plumbing engineering. The new version strengthens MEP design capabilities by incorporating improved collaboration tools and automation, making it more efficient for professionals in the field.
| Report Attributes | Details |
| Market Size in 2023 | USD 3.80 billion |
| Market Size by 2032 | USD 9.20 Billion |
| CAGR | CAGR of 10.34% From 2024 to 2032 |
| Base Year | 2023 |
| Forecast Period | 2024-2032 |
| Historical Data | 2020-2022 |
| Report Scope & Coverage | Market Size, Segments Analysis, Competitive Landscape, Regional Analysis, DROC & SWOT Analysis, Forecast Outlook |
| Key Segments | • By Software (BIM MEP Software, CAD MEP Software) • By Application (Mechanical, Electrical, Plumbing) • By Services (Advice, engineering, Maintenance, support, System integration) |
| Regional Analysis/Coverage | North America (US, Canada, Mexico), Europe (Eastern Europe [Poland, Romania, Hungary, Turkey, Rest of Eastern Europe] Western Europe] Germany, France, UK, Italy, Spain, Netherlands, Switzerland, Austria, Rest of Western Europe]), Asia Pacific (China, India, Japan, South Korea, Vietnam, Singapore, Australia, Rest of Asia Pacific), Middle East & Africa (Middle East [UAE, Egypt, Saudi Arabia, Qatar, Rest of Middle East], Africa [Nigeria, South Africa, Rest of Africa], Latin America (Brazil, Argentina, Colombia Rest of Latin America) |
| Company Profiles |
Autodesk, Trimble, Hexagon, Dassault Systèmes, Bentley Systems, Nemetschek Group, Siemens, AVEVA, Procore Technologies , Graphisoft, CYPE |
| Key Drivers | •Facilitates enhanced collaboration, visualization, and error mitigation in construction projects. •Rising focus on sustainable development drives the adoption of MEP tools for optimizing HVAC, electrical, and plumbing systems. •Enables predictive maintenance and smart building management, enhancing operational efficiency. |
| Market Challenges | •The cost of acquiring and implementing MEP software, including training and system integration, is significant, deterring small-scale enterprises. •Difficulty in seamlessly integrating MEP software with legacy systems or other existing platforms slows adoption in traditional construction environments. •A shortage of professionals trained in advanced MEP software tools restricts optimal utilization, especially in developing regions. |
Frequently Asked Questions
MEP Software Market was valued at USD 3.80 billion in 2023 and is expected to reach USD 9.20 Billion by 2032, growing at a CAGR of 10.34% from 2024-2032.
the CAGR of the MEP Software Market during the forecast period is of 10.34% from 2024-2032.
The North America dominated the market and represented significant revenue share in 2023
one main growth factor for the MEP Software Market is
- Facilitates enhanced collaboration, visualization, and error mitigation in construction projects.
Challenges in the MEP Software Market are
- The cost of acquiring and implementing MEP software, including training and system integration, is significant, deterring small-scale enterprises.
- Difficulty in seamlessly integrating MEP software with legacy systems or other existing platforms slows adoption in traditional construction environments.
Get in Touch
