Non-Fungible Token Market Report Scope & Overview:
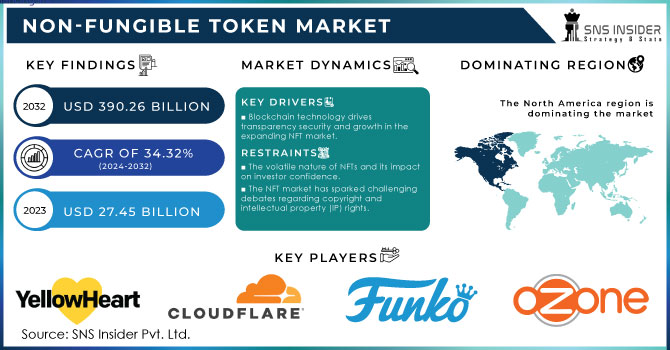
The Non-Fungible Token Market was valued at USD 27.45 Billion in 2023 and is expected to reach USD 390.26 Billion by 2032, growing at a CAGR of 34.32% over the forecast period 2024-2032. The non-fungible token (NFT) market has witnessed remarkable growth in recent years, fueled by the escalating interest in digital assets and blockchain technology. Recent data from NFTevening reveals that consumer interest is on the rise, with over 40% of individuals likely to purchase digital collectibles in 2024. Generative art NFTs, created through innovative AI and algorithms, have experienced a staggering 165% increase in sales volume in 2023 compared to the previous year. Furthermore, 60% of gamers express a keen interest in owning NFTs linked to their favorite games, demonstrating the burgeoning convergence of the gaming and NFT ecosystems. In response to growing environmental concerns, approximately 70% of NFT projects are now implementing eco-friendly practices to mitigate their carbon footprint. Additionally, more than 30% of museums and galleries are exploring NFTs as a strategy to engage audiences and monetize digital art, reflecting a broader acceptance of NFTs within traditional art institutions.
To Get More Information on Non-Fungible Token Market - Request Sample Report
These trends underscore the evolving landscape of the NFT market, emphasizing its growth potential and increasing integration into various sectors. The expansion of the NFT market is primarily driven by the rising demand for digital ownership and the widespread adoption of blockchain technology. In the finance sector, blockchain implementation could yield annual savings of at least USD 12 billion and reduce infrastructure costs by 30% for banks. The healthcare sector is also poised for significant benefits, with spending on blockchain integration expected to reach USD 5.61 billion by 2025, and 55% of healthcare applications likely to adopt commercialized blockchain solutions. As of March 2022, there were over 81 million registered wallets on blockchain platforms, and the FBI reportedly holds 1.5% of the global Bitcoin supply, underscoring the technology's growing influence and adoption across various industries. NFTs leverage blockchain to establish proof of ownership and authenticity, empowering artists, musicians, and creators to monetize their work more effectively. This innovative model allows creators to sell digital art directly to collectors without the need for intermediaries and enables them to earn royalties with every resale in secondary markets. This creator economy has revolutionized sectors such as art, entertainment, and gaming, and is expected to continue its expansion as more industries embrace the potential of NFTs.
Market Dynamics
Drivers
- Blockchain technology drives transparency security and growth in the expanding NFT market.
Blockchain technology is the foundation of the NFT market. Blockchain, being a decentralized ledger, guarantees essential qualities such as transparency, immutability, and security which are crucial for the operation of NFTs. Every NFT is one of a kind and can be tracked, providing evidence of ownership that is impossible to duplicate. The emergence of blockchain platforms such as Ethereum, providing smart contract features, has made it easier to create and exchange NFTs while guaranteeing their genuineness and distinctiveness. The decentralized nature of blockchain removes the requirement for intermediaries, cutting transaction costs and promoting peer-to-peer trading. This distribution allows creators and buyers more independence and self-governance, granting them direct entry to the market. Additionally, the transparency of blockchain increases confidence in the market by offering a public record of ownership, reducing the prevalence of fraud and counterfeiting problems that are common in traditional online marketplaces. Furthermore, advancements in blockchain technology are continuously developing. The implementation of Layer 2 solutions like Polygon and scaling technologies has increased the accessibility of NFTs to a wider audience by lowering energy usage and transaction costs. Due to ongoing improvements in blockchain technology, the NFT market is expected to expand, offering users safer, faster, and more cost-effective platforms.
- The growing interconnection between the metaverse and NFTs fuels new opportunities for digital ownership and economic growth.
The rise of the metaverse, a virtual world where individuals can engage with digital representations, has played a major role in the growth of the NFT industry. NFTs are fundamental components used in various parts of the metaverse such as virtual land, digital items, and avatars. The inclusion of NFTs in digital landscapes has opened up fresh opportunities for making money and possessing items, enabling individuals to purchase, sell, and exchange virtual goods that hold tangible worth. Platforms like Decentraland and The Sandbox enable users to buy virtual land through NFTs. Developing and customizing these virtual land parcels can bring about a parallel digital economy. The idea of owning digital assets in the metaverse is very attractive, especially for gamers and creators who can make money from their virtual creations. Moreover, companies are more and more embracing the metaverse to develop engaging marketing encounters, introducing digital products as NFTs. Technological advancements such as VR and AR are driving the increasing popularity of the metaverse, which in turn will strengthen the use of NFTs in this new digital landscape.
Restraints
- The volatile nature of NFTs and its impact on investor confidence.
The value of NFTs is incredibly volatile as they are generally very speculation-heavy assets. The high price volatility of NFTs creates uncertainty, which is unattractive to conservative investors. A few NFTs have sold for millions, many going to zero or close to zero value within months of their birth. This degree of risk naturally incurs a loss of faith, especially among more traditional investors who are hesitant to venture into a market so unstable. NFTs, which are entirely speculative markets by their nature, can also generate market bubbles. If speculative demand far exceeds actual use and worth, it would lead to a market crash (a situation where more people are trying to sell than buy), and creators as well as investors may stand to lose huge sums of money.
- The NFT market has sparked challenging debates regarding copyright and intellectual property (IP) rights.
Legal disputes have arisen when creators mint NFTs of artworks without owning the rights to them in some instances. The ownership of a digital asset and the process of transferring or maintaining those rights in an NFT sale is still unclear. The growth of the NFT market may be impeded by legal uncertainties, causing potential legal hurdles for creators and buyers. Furthermore, the decentralized structure of blockchain can present challenges in enforcing intellectual property rights, adding another layer of complexity for artists, collectors, and rights holders.
Market Segmentation Analysis
By Type
The digital asset segment held a major market share of over 73% in 2023 and led the market. It encompasses unique digital creations like artwork, music, videos, and virtual goods within games and metaverses. This segment has gained significant traction, driven by platforms like OpenSea and Rarible, which allow creators to mint and sell their digital art as NFTs. The appeal of digital assets lies in their scarcity and the ability to trace ownership on the blockchain, leading to increased value and demand. Companies such as NBA Top Shot have capitalized on this trend by creating collectible digital highlights, and merging sports fandom with blockchain technology.
The physical asset segment is anticipated to have a progressive CAGR during 2024-2032, as it involves the tokenization of tangible items, such as real estate, artwork, collectibles, and luxury goods. This segment leverages blockchain technology to verify ownership and provenance, offering a secure and transparent way to trade physical assets. Investors can purchase fractional ownership through NFTs, making high-value assets more accessible. Companies like Myco utilize NFTs to represent ownership of physical items, enabling buyers to trade and sell these tokens while ensuring the underlying asset's authenticity.
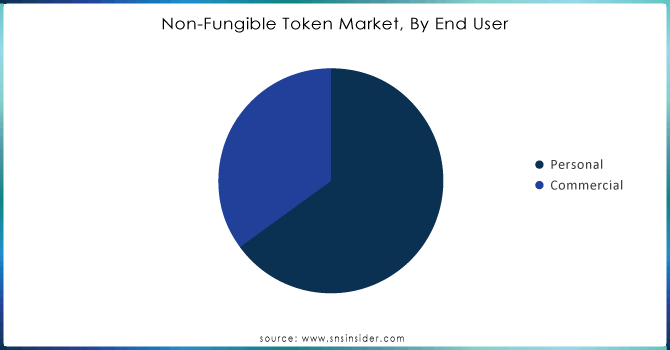
By End User
The personal led the Non-Fungible Token (NFT) market in 2023 with a 68% market share, as it is considered among regular buyers, sellers, and creators of NFTs for personal pleasure, investment, or collection reasons. The increasing popularity of digital art, collectibles, and virtual real estate has resulted in significant growth for this industry sector. People are more and more utilizing platforms such as OpenSea and Rarible to display and exchange their NFTs. Artistic individuals like Beeple have utilized this category to market their creations as NFTs, receiving significant interest and fetching high prices in the marketplace.
The commercial segment is the fastest-growing segment during 2024-2032, as companies and groups use NFTs for marketing, branding, and engagement goals. Businesses utilize NFTs to develop distinctive promotional strategies, loyalty initiatives, and engaging experiences to draw in customers and improve brand visibility. Big companies like Nike and Adidas have joined the NFT industry, launching unique digital shoes and collectibles to engage with their customers in new and creative ways. NFTs are being increasingly used in different sectors like entertainment, gaming, and real estate as companies like Ubisoft integrate them into games for exclusive in-game items.
Do You Need any Customization Research on Non-Fungible Token Market - Inquire Now
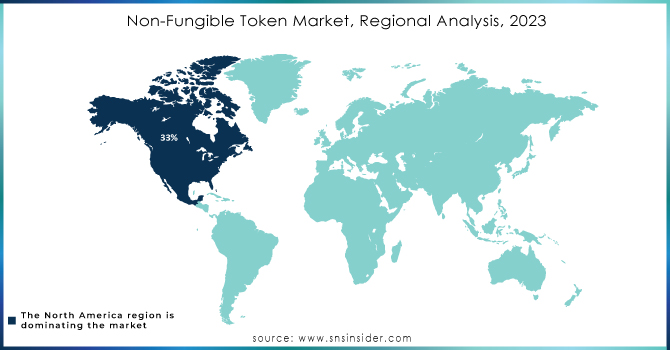
Regional Analysis
North America dominated the market regionally with a 33% market share in 2023, due to its advanced technology, substantial investments, and thriving digital art community. The United States houses numerous top NFT platforms like OpenSea and Rarible, enabling the trade of digital assets. Big companies such as NBA Top Shot and Twitter are also adopting NFTs, developing unique programs to improve interaction with users. Additionally, the area's favorable regulatory landscape and the existence of prominent technology firms help bolster its superiority.
Asia-Pacific region is expected to experience a faster growth rate during 2023-2032, due to heightened digitalization, a tech-savvy younger population, and growing cryptocurrency interest. Countries such as China, Japan, and South Korea are leading the way in developing new and creative uses in fields like gaming, art, and entertainment. Platforms such as Binance NFT and Rarible are becoming more popular, while initiatives like the Japanese anime NFT marketplace, AnimeNFT, focus on specific audiences.
Key Players
The major key players in the Non-Fungible Token Market are:
-
YellowHeart, LLC (YellowHeart Tickets, YellowHeart Marketplace)
-
Cloudflare, Inc. (Cloudflare Stream for NFTs, Cloudflare IPFS Gateway)
-
PLBY Group, Inc. (Playboy NFT Art Collection, Playboy Rabbitars)
-
Dolphin Entertainment, Inc. (NFT Studio, Custom NFT Campaigns)
-
Funko (Funko Digital Pop! NFTs, Funko Digital Collectibles)
-
Ozone Networks, Inc. (OpenSea) (OpenSea Marketplace, OpenSea Drops)
-
Takung Art Co., Ltd. (Takung NFT Art Platform, Digital Art Trading)
-
Dapper Labs, Inc. (NBA Top Shot, CryptoKitties)
-
Gemini Trust Company, LLC. (Nifty Gateway, Gemini Exchange)
-
Onchain Labs, Inc. (Immutable X) (Immutable X Marketplace, Immutable X Mint)
-
Rarible, Inc. (Rarible Marketplace, Rarible DAO Governance Token)
-
SuperRare Labs (SuperRare Marketplace, SuperRare Spaces)
-
Enjin (Enjin Wallet, Enjin Marketplace)
-
Foundation Labs, Inc. (Foundation Marketplace, Creator NFTs)
-
Mintable (Mintable App, Mintable Pro)
-
Zora, Inc. (Zora Protocol, Zora Auction House)
-
MakersPlace (MakersPlace Marketplace, Unique Artist NFTs)
-
Decentraland (Decentraland Virtual Land NFTs, Decentraland Wearables)
-
Riot Games, Inc. (Riot Games NFTs, VALORANT Digital Collectibles)
-
The Sandbox (Sandbox LAND NFTs, Sandbox Game Assets)
Recent Developments
-
September 2023: Franklin Mint introduced a new NFT collection in collaboration with the Great American Songbook Foundation, featuring iconic music memorabilia and exclusive digital art. This project aims to connect music enthusiasts with the rich history of American music through blockchain technology.
-
May 2024: Meta (formerly Facebook) announced the integration of a new NFT marketplace on its platforms, enabling users to create, buy, and sell NFTs directly through Facebook and Instagram. This feature aims to enhance social engagement with digital collectibles.
-
October 2023: Dapper Labs launched "NFL All Day," a platform where fans can buy, sell, and trade officially licensed NFL NFT moments. This platform aims to expand the sports NFT market and enhance fan engagement with interactive digital collectibles.
-
January 2024: Twitch announced a new feature allowing creators to mint and sell NFTs as part of their channels. This integration is designed to provide new revenue streams for streamers and strengthen community engagement.
-
February 2024: Adobe expanded its suite of features for NFT creators, allowing users to directly mint and sell NFTs through Adobe Express. This initiative aims to simplify the NFT creation process for artists and designers, making digital art more accessible.
| Report Attributes | Details |
|---|---|
| Market Size in 2023 | USD 27.45 Billion |
| Market Size by 2032 | USD 390.26 Billion |
| CAGR | CAGR of 34.32% From 2024 to 2032 |
| Base Year | 2023 |
| Forecast Period | 2024-2032 |
| Historical Data | 2020-2022 |
| Report Scope & Coverage | Market Size, Segments Analysis, Competitive Landscape, Regional Analysis, DROC & SWOT Analysis, Forecast Outlook |
| Key Segments | • By Type (Physical Asset, Digital Asset) • By End User (Personal, Commercial) • By Application (Collectibles, Art, Gaming, Utilities, Metaverse, Sports, Others) |
| Regional Analysis/Coverage | North America (US, Canada, Mexico), Europe (Eastern Europe [Poland, Romania, Hungary, Turkey, Rest of Eastern Europe] Western Europe] Germany, France, UK, Italy, Spain, Netherlands, Switzerland, Austria, Rest of Western Europe]), Asia Pacific (China, India, Japan, South Korea, Vietnam, Singapore, Australia, Rest of Asia Pacific), Middle East & Africa (Middle East [UAE, Egypt, Saudi Arabia, Qatar, Rest of Middle East], Africa [Nigeria, South Africa, Rest of Africa], Latin America (Brazil, Argentina, Colombia, Rest of Latin America) |
| Company Profiles | YellowHeart, LLC., Cloudflare, Inc., PLBY Group, Inc., Dolphin Entertainment, Inc., Funko, Ozone Networks, Inc., Takung Art Co., Ltd., Dapper Labs, Inc., Gemini Trust Company, LLC., Onchain Labs, Inc., Rarible, Inc., SuperRare Labs, Enjin, Foundation Labs, Inc., Mintable, Zora, Inc., MakersPlace, Decentraland, Riot Games, Inc., The Sandbox |
| Key Drivers | • Blockchain technology drives transparency security and growth in the expanding NFT market. • The growing interconnection between the metaverse and NFTs fuels new opportunities for digital ownership and economic growth. |
| RESTRAINTS | • The volatile nature of NFTs and its impact on investor confidence. • The NFT market has sparked challenging debates regarding copyright and intellectual property (IP) rights. |
Frequently Asked Questions
Ans: North America dominated the Non-Fungible Token Market in 2023.
Ans: The Personal segment dominated the Non-Fungible Token Market.
Ans: Blockchain technology drives transparency security and growth in the expanding NFT market.
Ans: The Non-Fungible Token Market was USD 27.45 Billion in 2023 and is expected to Reach USD 390.26 Billion by 2032.
Ans: The Non-Fungible Token Market is expected to grow at a CAGR of 34.32% during 2024-2032.
Get in Touch
