Augmented Reality Market Report Scope & Overview:
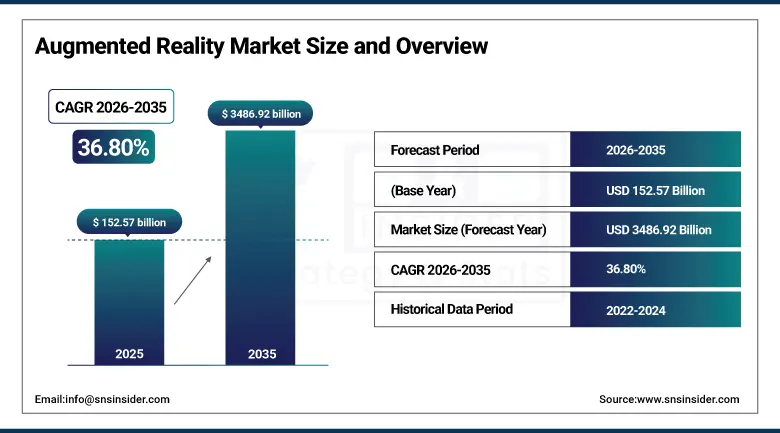
The Augmented Reality Market was valued at USD 152.57 Billion in 2025 and is expected to reach USD 3,486.92 Billion by 2035, growing at a CAGR of 36.80% from 2026–2035.
The global augmented reality market is growing at a transformative and commercially exceptional pace. The market is rapidly expanding across multiple industries with gaming, retail, and healthcare leading application adoption. Between 2020 and 2025, investments in AR technologies surged particularly in the U.S., China, and Europe, fueled by advancements in AI, 5G, and mixed reality. The AR Head-Mounted Display market is highly competitive with Microsoft HoloLens, Meta Quest, and Apple Vision Pro holding significant share while new entrants continue to reshape the competitive landscape. The rise of 5G is accelerating adoption by enabling faster data processing, low-latency applications, and improved connectivity for AR experiences that cloud rendering delivers to lightweight headsets.
In 2024, Apple commercially launched Vision Pro, marking the most significant AR/MR hardware market event since the original HoloLens introduction. Vision Pro’s visionOS platform creates a spatial computing environment whose 3D app ecosystem, eye tracking interaction, and high-resolution passthrough AR capability establishes a new premium AR hardware category that redefines consumer and enterprise expectations for immersive computing. The launch validates Apple’s decade-long investment in AR technology whose commercial significance compounds with the developer ecosystem’s spatial computing app development.
Market Size and Forecast:
-
Market Size in 2026E: USD 208.72 Billion
-
Market Size by 2035: USD 3,486.92 Billion
-
CAGR: 36.80% from 2026 to 2035
-
Fastest Growing Region: Asia Pacific
-
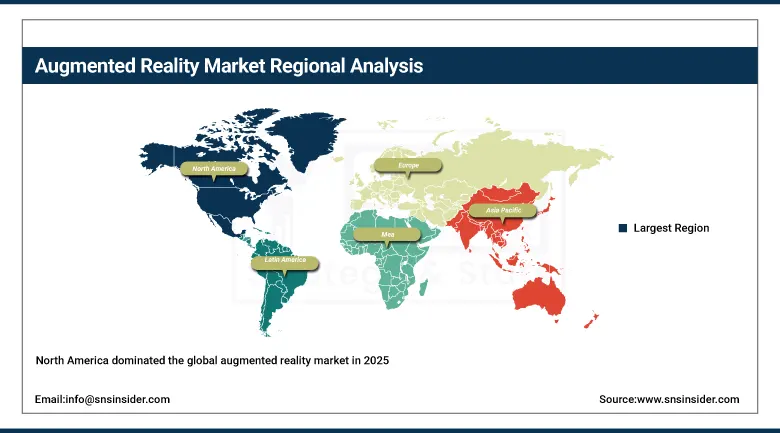
Largest Region: North America
To Get more information on Augmented Reality Market - Request Free Sample Report
Augmented Reality Market Trends:
-
Generative AI integration with AR platforms is enabling real-time scene understanding, dynamic content creation, and contextual overlay experiences.
-
Spatial computing ecosystems from Apple, Meta, and Microsoft are accelerating AR adoption through strong hardware–software network effects.
-
Industrial AR adoption is increasing for manufacturing, maintenance, and remote assistance due to measurable productivity and error reduction benefits.
-
Retail AR applications such as virtual try-on solutions are improving e-commerce conversion rates across fashion, beauty, and furniture sectors.
-
AR-based navigation and wayfinding is expanding in airports, hospitals, retail spaces, and urban environments for real-time spatial guidance.
U.S. Augmented Reality Market Outlook:
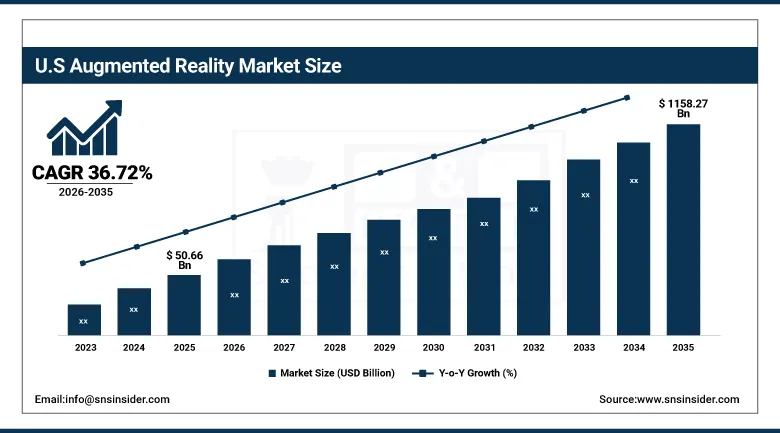
The U.S. Augmented Reality Market was valued at approximately USD 50.66 Billion in 2025 and is expected to reach approximately USD 1,158.27 Billion by 2035, growing at a CAGR of approximately 36.72%.
The U.S. is the world’s most commercially sophisticated augmented reality market within North America’s dominant revenue position. Apple, Microsoft, Meta, Google, and Snap are headquartered in the U.S. and collectively define the global AR technology frontier across hardware, software platform, and consumer application categories. The U.S. military’s Integrated Visual Augmentation System programme, the healthcare sector’s surgical AR adoption, and the industrial training sector’s AR instruction programme create the most commercially diverse enterprise AR application portfolio of any national market. The extraordinary developer ecosystem’s ARKit and ARCore application development creates the consumer AR content library that sustains smartphone AR engagement at scale.
Meta Platforms launched Meta Quest 3 in 2023 and its enhanced passthrough AR capabilities created a mixed reality platform whose colour passthrough AR enables seamless integration of digital content with the physical environment at consumer accessible price points. The Quest 3’s commercial success, selling millions of units at USD 499 price point, demonstrates the consumer AR hardware market’s progression toward mainstream accessibility whose installed base compound growth creates developer investment motivation that sustains content creation compounding with hardware adoption.
Augmented Reality Market Segment Analysis:
-
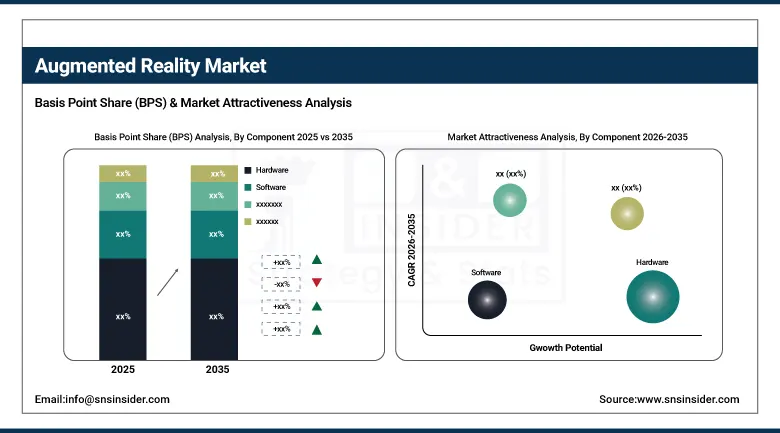
By Component, the hardware segment dominated the market with 60% share in 2025 due to increased implementation of AR headsets, smart glasses, and displays, while the software segment is the fastest growing as increasing demand for AR applications, cloud-based AR solution development, and AR app development platforms create above-average software procurement compounding with hardware installed base expansion.
-
By Device Type, the head-mounted display segment dominated the market in 2025 as the most immersive and commercially significant AR hardware category whose enterprise industrial, military, and premium consumer applications create above-average per-unit commercial value, while the smart glasses segment is the fastest growing as lightweight, always-on wearable AR form factor maturation creates enterprise field worker, logistics, and industrial maintenance application adoption that conventional HMD alternatives cannot serve with equivalent operational convenience.
-
By Application, the gaming & entertainment segment dominated the market with approximately 28% share in 2025 as the consumer AR application category with the highest engagement volume encompassing mobile AR games, location-based AR experiences, and immersive entertainment, while the healthcare & medicine segment is the fastest growing as surgical AR navigation, medical training simulation, and patient data visualization create above-average enterprise healthcare AR adoption driven by measurable clinical outcome improvement.
-
By End User, the consumer segment dominated the market with approximately 52% share in 2025 through the highest volume AR application engagement across gaming, social media filters, retail virtual try-on, and entertainment whose combined smartphone-accessible AR creates the most commercially significant aggregate end-user category, while the enterprise segment is the fastest growing as industrial AR’s measurable productivity improvement, manufacturing assembly error reduction, and remote expert collaboration cost savings create structured corporate AR investment that sustains above-average procurement growth.
By Component, hardware dominates, software grows fastest
Hardware retained the dominant component position with 60% of the augmented reality market in 2025. AR hardware’s commercial primacy reflects the physical device ecosystem’s role as the commercial foundation of every AR experience delivery system. AR HMDs, smart glasses, smartphones with AR-specific hardware including LiDAR sensors and advanced GPUs, and head-up display units collectively constitute the hardware procurement whose aggregate value substantially exceeds software and services. Apple Vision Pro’s USD 3,499 price point, Microsoft HoloLens 2’s USD 3,500 enterprise specification, and Meta Quest 3’s USD 499 consumer price create per-unit commercial values that compound with shipment volumes to define the hardware segment’s commercial leadership.
Software is the fastest-growing component because AR platform maturation, cloud-based AR solution development, and the extraordinary growth of AR application ecosystems are creating software procurement whose growth rate substantially exceeds the hardware segment’s volume trajectory. Each new ARKit or ARCore capability that enables previously impossible AR experience creates developer investment that compounds with the smartphone installed base’s AR capability. Enterprise AR software whose industrial guidance, remote collaboration, and training simulation applications create measurable ROI sustains corporate software subscription procurement whose recurring revenue compounds with programme expansion.
By Application, gaming dominates, healthcare grows fastest
Gaming and entertainment retained the dominant application position with approximately 28% of the augmented reality market in 2025. Mobile AR gaming’s mass market reach, exemplified by Pokémon GO’s extraordinary global engagement, demonstrates the AR application category whose volume of active users creates aggregate commercial revenue that enterprise and professional applications cannot match by participant count. Location-based AR entertainment, immersive gaming experiences on Meta Quest, and social media AR filter engagement collectively create consumer AR commercial scale whose combined in-app purchase, subscription, and advertising revenue sustains the application category’s dominance.
Healthcare is the fastest-growing application because surgical AR navigation, medical training simulation, anatomy visualisation, and clinical workflow AR are creating measurable clinical outcome improvements whose healthcare system investment justification creates structured procurement independent of consumer entertainment discretion. Each surgical AR system that reduces operative time, improves anatomical landmark accuracy, or reduces intraoperative complications creates clinical evidence whose peer-reviewed publication creates hospital adoption motivation.
By Device Type, HMD dominates, smart glasses grow fastest
Head-mounted displays retained the dominant device type position in the augmented reality market in 2025. HMD’s commercial leadership reflects the most immersive AR experience delivery whose wide field of view, high-resolution display, and spatial audio create the complete AR experience that partial-view smart glasses and smartphone screen alternatives cannot match. Apple Vision Pro’s extraordinary visionOS spatial computing environment, Microsoft HoloLens 2’s enterprise industrial AR capability, and Meta Quest 3’s consumer mixed reality collectively demonstrates HMD’s diverse application portfolio whose premium per-unit pricing creates above-average revenue contribution per device.
Smart glasses are the fastest-growing device type because the form factor’s lightweight wearability, always-on availability, and hands-free operation create enterprise field worker applications that conventional HMD alternatives cannot serve without unacceptable operational burden. Each logistics worker, field service technician, or manufacturing assembler that adopts smart glasses for real-time work instruction, barcode scanning overlay, or remote expert video creates daily-use enterprise AR procurement whose volume compounds with workforce deployment scale.
By End User, consumer dominates, enterprise grows fastest
Consumer end users retained the dominant position with approximately 52% of the augmented reality market in 2025. Consumer AR’s commercial scale reflects the extraordinary volume of smartphone AR interactions whose aggregate across billions of daily active smartphone users creates commercial revenue through in-app purchases, advertising, and premium content subscription that enterprise AR programmes cannot match by participant count. Social media AR filter creation and consumption on Instagram, Snapchat, and TikTok creates daily consumer AR engagement whose commercial monetization through advertising creates consistent revenue.
Enterprise is the fastest-growing end user because industrial AR’s measurable productivity improvement, manufacturing assembly error reduction quantifiable in quality cost reduction, and remote expert collaboration’s travel cost elimination create financial ROI whose measurement justifies above-average corporate AR investment. Each factory that deploys AR-guided assembly instruction creates measurable error rate reduction whose quality cost saving funds continued AR programme expansion.
Regional Analysis:
|
Region |
Major Country |
Share within Region, 2025 (%) |
|---|---|---|
|
North America |
United States |
87.4% |
|
Europe |
Germany |
22.3% |
|
Asia Pacific |
China |
44.8% |
|
Middle East & Africa |
UAE |
38.4% |
|
Latin America |
Brazil |
44.2% |
North America Augmented Reality Market Insights
North America dominated the global augmented reality market in 2025 with the highest AR technology investment and most commercially diverse application portfolio. The United States accounts for approximately 87.4% of North American revenues through Apple, Microsoft, Meta, Google, and Snap’s commercial dominance whose combined portfolio creates the global AR technology standard. The U.S.’s advanced developer ecosystem, enterprise technology adoption, and consumer technology spending collectively sustain the world’s most commercially sophisticated AR market.
Canada contributes approximately 12.6% of North American revenues through its technology sector’s AR development investment, the enterprise AR adoption in manufacturing and healthcare, and the consumer AR engagement through U.S.-developed platform ecosystems.
Get Customized Report as per Your Business Requirement - Enquiry Now
Europe Augmented Reality Market Insights
Europe is a technically sophisticated augmented reality market where industrial AR adoption in automotive and aerospace manufacturing, the healthcare system’s surgical AR investment, and enterprise training AR create structured institutional demand. Germany accounts for approximately 22.3% of European revenues through its automotive and manufacturing industry’s AR-guided assembly adoption, Volkswagen Group and BMW’s AR maintenance instruction deployment, and the industrial training sector’s AR simulation investment.
The United Kingdom, France, and the Netherlands are significant secondary markets where healthcare AR adoption, industrial maintenance AR, and the consumer entertainment sector’s AR engagement create consistent above-average per-capita AR procurement.
Asia Pacific Augmented Reality Market Insights
Asia Pacific is the fastest-growing regional augmented reality market, driven by China’s extraordinary consumer AR adoption, Japan’s industrial AR manufacturing deployment, South Korea’s technology industry’s AR platform development, and India’s rapidly growing consumer technology market. China accounts for approximately 44.8% of Asia Pacific revenues through its enormous consumer AR user base, the domestic AR hardware manufacturer development, and ByteDance’s and Alibaba’s AR commerce platform investment.
South Korea’s Samsung and LG’s AR technology development and Japan’s Sony and NTT’s enterprise AR platform create significant secondary markets whose combined procurement sustains Asia Pacific’s fastest-growing regional status.
MEA & Latin America Augmented Reality Market Insights
UAE leads MEA revenues at approximately 38.4% through its smart city AR infrastructure investment, the luxury retail sector’s virtual try-on adoption, and the technology sector’s AR application development creating structured procurement. Brazil leads Latin American revenues at approximately 44.2% through its consumer technology market’s AR engagement, the retail sector’s e-commerce AR adoption, and the enterprise sector’s industrial AR training investment.
Saudi Arabia’s Vision 2030 digital transformation creates significant MEA secondary market investment in AR for education, training, and smart city applications whose commercial scale reflects the extraordinary Saudi government technology investment programme.
Market Dynamics:
Growth Drivers: 5G enabling cloud AR rendering and enterprise industrial AR productivity improvement
5G network deployment’s ultra-low latency and high bandwidth capability is the augmented reality market’s most transformative near-term technical enabler. Cloud AR rendering whose complex 3D scene computation executes on edge servers rather than device processors creates lightweight headset form factors that achieve visual quality previously requiring bulky on-device processing hardware. Each 5G-enabled AR experience that delivers cloud-rendered photorealistic holograms to a lightweight device creates a new commercial application category that 4G latency and smartphone processing constraints previously prevented.
Enterprise industrial AR’s measurable productivity improvement creates the most commercially sustainable AR adoption driver whose financial ROI justification sustains corporate investment through technology cycle variation. Boeing’s documented 25% reduction in aircraft wiring harness assembly time with AR guidance, and surgical AR’s operative time reduction collectively demonstrate enterprise AR’s financial case whose replication across global industrial enterprises creates systematic adoption momentum.
Restraints: Hardware cost limiting mass consumer adoption and privacy concerns creating regulatory AR deployment constraints
Premium AR hardware’s cost Apple Vision Pro at USD 3,499 and Microsoft HoloLens 2 at USD 3,500 for enterprise specification. This creates consumer and SME adoption barriers whose financial threshold substantially exceeds the impulse purchase economics that consumer technology mainstream adoption historically requires. Each hardware generation’s incremental price reduction toward the USD 500-1,000 consumer accessible range creates new adoption trigger potential, but the processing power, optical quality, and battery life requirements of compelling AR experiences create manufacturing cost floors that sustain premium pricing through the forecast period’s early years.
Privacy concerns from AR devices’ continuous environment capture, facial recognition capability, and persistent recording potential create regulatory scrutiny whose GDPR, CCPA, and sector-specific data protection requirements create compliance obligations that moderate AR deployment in public spaces and sensitive enterprise environments.
Opportunities: Spatial computing platform ecosystem and AR-powered commerce creating conversion rate ROI
Spatial computing platform ecosystem development represents the most commercially transformative long-term AR opportunity whose network effect creates self-reinforcing adoption momentum. Each developer that invests in visionOS, Horizon OS, or mixed reality spatial app development creates content that sustains hardware adoption, and each hardware unit shipped creates developer commercial motivation for spatial app investment. Apple’s App Store model’s proven platform economics applied to spatial computing creates commercial precedent whose AR analogue creates extraordinary long-term value.
AR-powered commerce whose virtual try-on creates measurable conversion rate improvement and returns rate reduction creates the most financially quantifiable retail AR ROI.
Recent Developments:
-
2025: Apple enhanced its Vision Pro and visionOS ecosystem with improved spatial computing features and deeper AI integration for immersive AR experiences.
-
2025: Meta expanded its AR ecosystem with Ray-Ban Display smart glasses featuring real-time visual output, AI assistance, and navigation capabilities.
-
2025: Meta advanced its internal AR hardware strategy by accelerating development of custom AR/AI chips for next-generation spatial devices.
-
2025: Amazon progressed development of AR smart glasses (code-named “Jayhawk”) integrating display, audio, and camera features for consumer AR applications.
Augmented Reality Market key players are:
-
Apple Inc. (Vision Pro/ARKit)
-
Microsoft Corporation (HoloLens/Azure Spatial)
-
Meta Platforms Inc. (Quest/Spark AR)
-
Alphabet Inc. (Google/ARCore)
-
Qualcomm Technologies Inc.
-
Snap Inc.
-
Magic Leap Inc.
-
PTC Inc. (Vuforia)
-
Niantic Inc.
-
Samsung Electronics Co., Ltd.
-
Sony Corporation
-
Vuzix Corporation
-
RealWear Inc.
-
EPSON (Moverio Smart Glasses)
-
Honeywell International Inc.
-
Zebra Technologies Corporation
-
Lenovo Group Ltd.
-
Blippar Ltd.
-
Scope AR
-
8th Wall Inc.
Augmented Reality Market Report Scope:
| Report Attributes | Details |
|---|---|
| Market Size in 2025 | USD 152.57 Billion |
| Market Size by 2035 | USD 3,489.92 Billion |
| CAGR | CAGR of 36.80% From 2026 to 2035 |
| Base Year | 2025 |
| Forecast Period | 2026-2035 |
| Historical Data | 2022-2024 |
| Report Scope & Coverage | Market Size, Segments Analysis, Competitive Landscape, Regional Analysis, DROC & SWOT Analysis, Forecast Outlook |
| Key Segments | • By Component (Hardware, Software, Services) • By Device Type (Head-Mounted Displays/HMD, Smart Glasses, Handheld Devices/Smartphones & Tablets, Head-Up Displays) • By Application (Gaming & Entertainment, Retail & E-Commerce, Healthcare & Medicine, Manufacturing & Industrial, Education & Training, Navigation, Military & Defense, Others) • By End User (Consumer, Enterprise, Commercial) |
| Regional Analysis/Coverage | North America (US, Canada), Europe (Germany, UK, France, Italy, Spain, Russia, Poland, Rest of Europe), Asia Pacific (China, India, Japan, South Korea, Australia, ASEAN Countries, Rest of Asia Pacific), Middle East & Africa (UAE, Saudi Arabia, Qatar, South Africa, Rest of Middle East & Africa), Latin America (Brazil, Argentina, Mexico, Colombia, Rest of Latin America). |
| Company Profiles | Apple Inc. (Vision Pro/ARKit), Microsoft Corporation (HoloLens/Azure Spatial), Meta Platforms Inc. (Quest/Spark AR), Alphabet Inc. (Google/ARCore), Qualcomm Technologies Inc., Snap Inc., Magic Leap Inc., PTC Inc. (Vuforia), Niantic Inc., Samsung Electronics Co., Ltd., Sony Corporation, Vuzix Corporation, RealWear Inc., EPSON (Moverio Smart Glasses), Honeywell International Inc., Zebra Technologies Corporation, Lenovo Group Ltd., Blippar Ltd., Scope AR, 8th Wall Inc. |
Frequently Asked Questions
The Augmented Reality Market is expected to grow at a CAGR of 36.80% from 2026 to 2035.
The Augmented Reality Market was valued at USD 152.57 Billion in 2025.
5G network deployment enabling cloud AR rendering creating lightweight device experiences previously requiring bulky on-device processing.
Hardware dominated the Augmented Reality Market with 60% share in 2025, while the Software segment is the fastest growing.
North America dominated the Augmented Reality Market in 2025.
Get in Touch
