image

Smart Highways Market Size & Overview:

Smart Highways Market Revenue Analysis

Get more information on Smart Highways Market - Request Sample Report

The Smart Highways Market Size was valued at USD 57.10 Billion in 2023 and is expected to reach USD 279.53 Billion by 2032, growing at a CAGR of 19.33% over the forecast period 2024-2032.

Advancements in technology are quickly transforming the future of transportation infrastructure, leading to rapid evolution in the smart highways market. The sector is experiencing significant growth due to the rise in popularity of electric vehicles (EVs) and the increased need for more efficient traffic systems. Multiple factors, such as government efforts to cut down on carbon emissions, enhance road safety, and handle growing traffic levels, are fueling the advancement of smart highways. Numerous governments are putting money into smart infrastructure initiatives as a component of their extended city planning approaches. For instance, in 2021, USD 60 million was assigned by the U.S. Department of Transportation (DOT) for smart infrastructure projects, and the Bipartisan Infrastructure Law contains substantial funding for updating roadways. Urban areas like Las Vegas and states like California and Florida are adopting intelligent transportation systems to boost traffic efficiency and safety. The use of smart sensors and real-time data management is aiding in decreasing travel times by 20% and lowering accident rates by up to 30%. Testing of self-driving vehicles is being combined with intelligent highway systems, especially on roads such as I-10 in Texas. These technologies help protect the environment by cutting vehicle emissions by as much as 20%. by 2030, smart highways are projected to become a prevalent feature on major U.S. interstates, despite obstacles such as high initial costs and policy standardization. Governments across the Asia Pacific region are proactively investing in smart highway projects to improve transportation efficiency, safety, and sustainability. China has made remarkable advancements in Intelligent Transportation Systems (ITS) utilizing 5G technology, India's Bharatmala Pariyojana incorporates GPS-enabled sensors for real-time traffic control, and Japan's Smart Highway Vision 2030 advocates for autonomous vehicle assistance.

The implementation of intelligent roads is also anticipated to have a vital impact on advancing autonomous driving technology. by 2024, the use of autonomous vehicles (AVs) is advancing in the U.S. but is still in its initial phase. Sales are projected to hit approximately 230,000 by 2034, propelled by innovations from major companies like Waymo, GM's Cruise, and Tesla. Even though there was a decrease in the last few years because of funding constraints and technical obstacles, investments are now increasing once more, backing the continued advancement of AV technologies. Smart highways play a crucial role in providing autonomous vehicles with accurate and immediate data from their surroundings using sensors placed on different infrastructures and embedded in the road. These sensors are capable of identifying the velocity, trajectory, and location of cars, guaranteeing a secure and effective navigation for self-driving vehicles. In the future, the integration of intelligent roads and self-driving cars is expected to significantly decrease the number of traffic accidents and deaths, creating safer streets for all.

Smart Highways Market Dynamics

Drivers

  • Revolutionizing urban mobility through the smart highways market and IoT integration.

The expansion of IoT technologies allows vehicles, infrastructure, and traffic management systems to communicate seamlessly; the aspect has been one of the biggest beneficiaries to propel growth in the smart highways market. High highways with smart sensors can monitor traffic volume, identify the need for emergency assistance, and even collect user data. This data is essential for traffic management centers as it enables them to intervene promptly so that the flow of traffic can be optimized. This could mean sharing real-time traffic data with drivers through mobile apps, letting them know in advance when they're approaching congested areas or accidents. Information like this, provided in real-time, allows a driver to make choices about their route that help lessen congestion and make better roads. 5G promises even more reliable low-latency communication and is therefore likely to soon become a major factor in vehicle-to-infrastructure (V2I) communication as well. Furthermore, the use of smart traffic lights that can change timings as they receive information about current traffic conditions in real-time, is a sure way to optimize traffic flow throughout. This integration is further enhanced by an intelligent transportation system (ITS) that studies traffic patterns and anticipates changes to prevent disruptions.

  • Government investments propel growth in smart highways and intelligent transportation systems.

Smart highways are also a component of the initiative in which government have been pouring more money into recently on account of smart cities, and smarter transportation overall. Intelligent Transportation Systems have become a central focus of the national transportation policies of numerous countries. The Smart Highways market has been in the spotlight over the past few years due to several ongoing governmental projects and systems that are used by agencies for operating, building and maintenance of these highways thereby contributing towards the safety & security. For example, the provision of funds by government agencies for research and development efforts to improve traffic management systems and initiate smart highways technologies. In addition to enhancing the existing infrastructure, these investments create potential for public-private partnerships and spur innovation in Smart Highways Market segment. Further, several governmental schemes can be seen surfaced for boosting the use of environment-friendly modes of transport such as EVs. Since an ever-increasing number of EVs will be on the road, there is a demand for smart highways that integrate charging infrastructure and technologies to manage energy consumption more effectively. Smart highways and EV adoption government incentives go hand in hand.

Restraints

  • The complex regulatory landscape of smart highways, challenges and implications for implementation

Smart Highways Market has a highly fragmented regulatory landscape, with rules and practices that can vary between different categories of vehicle or type of vehicle operation (for example, public transit buses versus commercial traffic). Disparate smart highway initiatives not only generate competition between different local stakeholders: they can also sow confusion and encumber the birth and growth of sophisticated smart highway technologies that benefit from consistency in guidelines and requirements. For example, the legal landscape related to data privacy, cybersecurity and vehicle safety is changing every day. The catch here is the ever-changing scenario which becomes a challenge, specifically for corporations or government bodies searching to investigate on smart highway solutions. Smart Highways require an array of systems and devices to work together so everything can be properly managed. Here they face the issue of integration, for fewer always adhere to a single standard and this is where complications could thwart the wonders of smart highways.

Smart Highways Market Segmentation Outlook
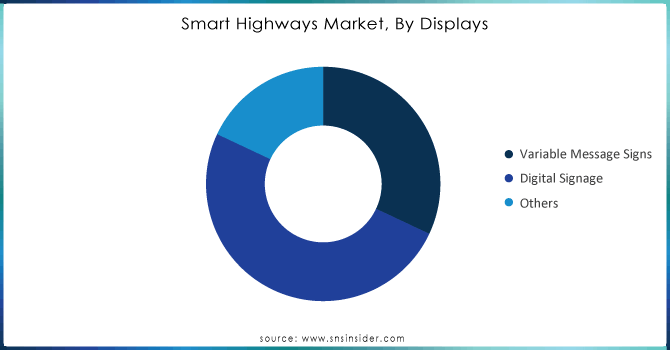
by Displays

Digital signage dominated in 2023 with a 50% market share. Digital signage, in contrast to conventional signs, makes use of electronic screens to communicate different messages, promotions, and data. The growth of this sector is boosted by the increasing popularity of connected vehicles and smart city projects, highlighting the importance of real-time data integration. Samsung and LG Electronics lead the way with cutting-edge digital signage solutions designed specifically for transportation purposes, including interactive kiosks and informative displays along highways.

Variable Message Signs (VMS) are accounted to experience the fastest CAGR during 2024-2032. It plays a vital role in intelligent highway systems by offering drivers up-to-date details on road conditions, traffic flow, accidents, and weather warnings. These electronic screens can be set to modify messages in real-time, improving traffic control and boosting safety. Cubic Corporation and DynaTraffic, top firms, have created advanced VMS solutions that sync with traffic management systems to offer precise and current information, guaranteeing efficient communication with drivers.

Smart Highways Market, By Displays

Need any customization research on Smart Highways Market - Enquiry Now

by Deployments

The Cloud led the market in 2023 with a 55% market share because of its many benefits such as scalability, affordability, and improved data accessibility. Cloud-based solutions enable centralized data management, facilitating real-time analytics and enhancing decision-making for traffic management and safety systems. Prominent firms like Cisco provide cloud-based systems that combine Internet of Things devices for intelligent traffic control, allowing for live monitoring and adjusting traffic signals accordingly.

The On-Premises is gaining a rapid CAGR during 2024-2032, as it pertains to conventional systems set up and managed inside the actual facilities of a company, like local traffic control centers. Although the on-premise option is commonly viewed as more rigid than cloud services, it offers better management of data security and system functions. Siemens, among other companies, utilizes on-site solutions with cutting-edge sensor technologies and real-time traffic management systems to provide full control over highway operations.

Smart Highways Market Regional Analysis

North America dominated the smart highways market in 2023 with a 45% market share, driven by significant investments in infrastructure modernization and advanced technologies. The presence of leading technology companies, innovative startups, and extensive government initiatives enhances the adoption of smart highway solutions. For instance, the California Department of Transportation has implemented smart traffic signals that optimize traffic flow and reduce congestion. The region's focus on sustainability and improving road safety further solidifies its leadership position, as various states prioritize the integration of renewable energy sources into highway systems and promote electric vehicle infrastructure.

The Asia-Pacific region is accounted to experience a rapid growth rate during 2024-2032 in the Smart Highways Market, fueled by urbanization, population growth, and the increasing demand for intelligent transportation solutions. For example, China’s Smart Highway Project utilizes advanced sensors and data analytics to monitor traffic patterns and enhance road safety. Additionally, initiatives in countries like Singapore focus on implementing integrated transport systems that use real-time data to manage congestion and improve overall traffic flow, positioning APAC as a leader in smart highway innovations.

Smart-Highways-Market-Regional-Analysis--2023

Key Players

The major key players in the Smart Highways Market are:

  • Cisco Systems Inc. (Cisco Connected Roadways, Cisco Industrial Ethernet Switches)

  • Huawei Technologies Co. Ltd. (Huawei Intelligent Traffic Management System, Huawei Smart Traffic Lights)

  • Alcatel-Lucent S.A. (Alcatel-Lucent Omnivista, Alcatel-Lucent Smart Traffic Management)

  • Kapsch TrafficCom AG (Kapsch Tolling Systems, Kapsch Traffic Management Systems)

  • IBM (IBM Intelligent Transportation Systems, IBM Traffic Prediction Tools)

  • Indra Sistemas S.A. (Indra Mova Solutions, Indra Smart Road Monitoring System)

  • Schneider Electric (Schneider EcoStruxure for Transportation, Schneider Smart Traffic Solutions)

  • Siemens (Siemens Sitraffic Concert, Siemens Sitraffic Guide)

  • Xerox Corporation (Xerox Vehicle Passenger Detection, Xerox Mobility Analytics)

  • LG CNS Corporation (LG CNS Smart Traffic Management, LG CNS Smart Tolling System)

  • Fujitsu (Fujitsu SPATIOWL, Fujitsu Intelligent Transport Systems)

  • Thales Group (Thales Smart Road Systems, Thales Highway Toll Collection Solutions)

  • Continental AG (Continental Road Management Solutions, Continental Vehicle-to-Infrastructure Communication)

  • Toshiba Corporation (Toshiba Traffic Management Solutions, Toshiba Mobility Analytics)

  • Sensys Networks (Sensys SNAPS Traffic Sensors, Sensys Networks Adaptive Traffic Control)

  • Econolite (Econolite Advanced Traffic Controllers, Econolite Centracs Mobility Platform)

  • Flir Systems (FLIR Thermal Traffic Cameras, FLIR TrafiOne Smart City Sensor)

  • SWARCO AG (SWARCO Traffic Signal Systems, SWARCO Dynamic Road Markings)

  • Q-Free ASA (Q-Free Advanced Traffic Management, Q-Free Tolling Solutions)

  • TransCore (TransCore RFID Toll Collection, TransCore Advanced Traffic Management Systems)

Recent Development

  • Cavnue's Smart Highway Pilot in Michigan (July 2023): Cavnue, backed by Alphabet, started constructing a 25-mile smart highway between Ann Arbor and Detroit. The road is equipped with sensors, AI, and cameras to monitor traffic conditions and send real-time updates to drivers and transportation authorities. This project aims to improve safety and reduce congestion and is planned to expand to 40 miles.

  • Netherlands' Smart Highway Project (2023): Known for its innovation in smart infrastructure, the Netherlands continues enhancing its Smart Highway initiative, featuring glow-in-the-dark markings. These markings charge during the day and illuminate at night, improving visibility and safety.

  • RoadEO's Smart Infrastructure (2023): RoadEO, a company specializing in traffic management solutions, launched its big data-driven system in 2023. It collects data from sensors and satellites to optimize traffic and road safety on smart highways, offering insights into traffic and road conditions.

  • AI-powered Traffic Systems in Mumbai (2024): India's government introduced AI-powered signal control systems to optimize traffic on key highways in Mumbai, part of a broader investment in AI-based smart traffic solutions. This technology adjusts traffic flow in real time, reducing congestion and improving efficiency.

Smart Highways Market Report Scope:

Report Attributes Details
Market Size in 2023 USD 57.10 Billion
Market Size by 2032 USD 279.53 Billion
CAGR CAGR of 19.33% From 2024 to 2032
Base Year 2023
Forecast Period 2024-2032
Historical Data 2020-2022
Report Scope & Coverage Market Size, Segments Analysis, Competitive  Landscape, Regional Analysis, DROC & SWOT Analysis, Forecast Outlook
Key Segments • By Displays (Variable Message Signs, Digital Signage, and Others)
• By Technology (Intelligent Transportation Management System, Communication System, Intelligent Management System, Monitoring System, and Others)
• By Deployments (On-Cloud and On-Premises)
Regional Analysis/Coverage North America (US, Canada, Mexico), Europe (Eastern Europe [Poland, Romania, Hungary, Turkey, Rest of Eastern Europe] Western Europe] Germany, France, UK, Italy, Spain, Netherlands, Switzerland, Austria, Rest of Western Europe]), Asia Pacific (China, India, Japan, South Korea, Vietnam, Singapore, Australia, Rest of Asia Pacific), Middle East & Africa (Middle East [UAE, Egypt, Saudi Arabia, Qatar, Rest of Middle East], Africa [Nigeria, South Africa, Rest of Africa], Latin America (Brazil, Argentina, Colombia, Rest of Latin America)
Company Profiles Cisco Systems Inc., Huawei Technologies Co. Ltd., Alcatel-Lucent S.A., Kapsch TrafficCom AG, IBM, Indra Sistemas S.A., Schneider Electric, Siemens, Xerox Corporation, LG CNS Corporation, Fujitsu, Thales Group, Continental AG, Toshiba Corporation, Sensys Networks, Econolite, Flir Systems, SWARCO AG, Q-Free ASA, TransCore
Key Drivers • Revolutionizing urban mobility through the smart highways market and IoT integration.
• Government investments propel growth in smart highways and intelligent transportation systems.
RESTRAINTS • The complex regulatory landscape of smart highways, challenges and implications for implementation

Frequently Asked Questions

Ans: The Smart Highways Market was USD 57.10 Billion in 2023 and is expected to Reach USD 279.53 Billion by 2032.

Ans: The Smart Highways Market is expected to grow at a CAGR of 19.33% during 2024-2032.

Ans: North America region dominated the Smart Highways Market with the highest revenue share of about 33.4%

Ans: One of the key advantages of smart highways is improved safety. These intelligent road networks utilize sensors, cameras, and other monitoring devices to detect and respond to potential hazards in real time. For instance, they can promptly identify accidents, traffic congestion, or adverse weather conditions, allowing authorities to take immediate action and minimize risks. Additionally, smart highways can provide drivers with real-time information about road conditions, diversions, and potential dangers, enabling them to make informed decisions and avoid accidents.

Ans: The Digital Signage segment dominated the Smart Highways Market.

Table of Content

1. Introduction

1.1 Market Definition

1.2 Scope (Inclusion and Exclusions)

1.3 Research Assumptions

2. Executive Summary

2.1 Market Overview

2.2 Regional Synopsis

2.3 Competitive Summary

3. Research Methodology

3.1 Top-Down Approach

3.2 Bottom-up Approach

3.3. Data Validation

3.4 Primary Interviews

4. Market Dynamics Impact Analysis

4.1 Market Driving Factors Analysis

4.1.1 Drivers

4.1.2 Restraints

4.1.3 Opportunities

4.1.4 Challenges

4.2 PESTLE Analysis

4.3 Porter’s Five Forces Model

5. Statistical Insights and Trends Reporting

5.1 Smart Highways Traffic Flow Metrics

     5.2 Smart Highways Safety Metrics

     5.3 Smart Highways Regulatory and Policy Metrics, by Region

     5.4 Environmental Impact Metrics

6. Competitive Landscape

6.1 List of Major Companies, by Region

6.2 Market Share Analysis, by Region

6.3 Product Benchmarking

6.3.1 Product specifications and features

6.3.2 Pricing

6.4 Strategic Initiatives

6.4.1 Marketing and promotional activities

6.4.2 Distribution and Supply Chain Strategies

6.4.3 Expansion plans and new product launches

6.4.4 Strategic partnerships and collaborations

6.5 Technological Advancements

6.6 Market Positioning and Branding

7. Smart Highways Market Segmentation, by Displays

7.1 Chapter Overview

7.2 Variable Message Signs

7.2.1 Variable Message Signs Market Trends Analysis (2020-2032)

7.2.2 Variable Message Signs Market Size Estimates and Forecasts to 2032 (USD Billion)

7.3 Digital Signage

7.3.1 Digital Signage Market Trends Analysis (2020-2032)

7.3.2 Digital Signage Market Size Estimates and Forecasts to 2032 (USD Billion)

7.3 Others

7.3.1 Others Market Trends Analysis (2020-2032)

7.3.2 Others Market Size Estimates and Forecasts to 2032 (USD Billion)

8. Smart Highways Market Segmentation, by Technology

8.1 Chapter Overview

8.2 Intelligent Transport Management System

8.2.1 Intelligent Transport Management System Market Trends Analysis (2020-2032)

8.2.2 Intelligent Transport Management System Market Size Estimates and Forecasts to 2032 (USD Billion)

8.2.3 Lane Departure Warning System (LDW)

8.2.3.1 Lane Departure Warning System (LDW) Market Trends Analysis (2020-2032)

8.2.3.2 Lane Departure Warning System (LDW) Market Size Estimates and Forecasts to 2032 (USD Billion)

8.2.4 Automatic Number Plate Recognition (ANPR)

8.2.4.1 Automatic Number Plate Recognition (ANPR) Market Trends Analysis (2020-2032)

8.2.4.2 Automatic Number Plate Recognition (ANPR) Market Size Estimates and Forecasts to 2032 (USD Billion)

8.2.5 Incident Detection System

8.2.5.1 Incident Detection System Market Trends Analysis (2020-2032)

8.2.5.2 Incident Detection System Market Size Estimates and Forecasts to 2032 (USD Billion)

8.2.6 Radio Frequency Identification (RFID)

8.2.6.1 Radio Frequency Identification (RFID) Market Trends Analysis (2020-2032)

8.2.6.2 Radio Frequency Identification (RFID) Market Size Estimates and Forecasts to 2032 (USD Billion)

8.3 Intelligent Traffic Management System

8.3.1 Intelligent Traffic Management System Market Trends Analysis (2020-2032)

8.3.2 Intelligent Traffic Management System Market Size Estimates and Forecasts to 2032 (USD Billion)

8.3.3 Lane Departure Warning System (LDW)

8.3.3.1 Lane Departure Warning System (LDW) Market Trends Analysis (2020-2032)

8.3.3.2 Lane Departure Warning System (LDW) Market Size Estimates and Forecasts to 2032 (USD Billion)

8.3.4 Automatic Number Plate Recognition (ANPR)

8.3.4.1 Automatic Number Plate Recognition (ANPR) Market Trends Analysis (2020-2032)

8.3.4.2 Automatic Number Plate Recognition (ANPR) Market Size Estimates and Forecasts to 2032 (USD Billion)

8.3.5 Incident Detection System

8.3.5.1 Incident Detection System Market Trends Analysis (2020-2032)

8.3.5.2 Incident Detection System Market Size Estimates and Forecasts to 2032 (USD Billion)

8.4 Communication System

8.4.1 Communication System Market Trends Analysis (2020-2032)

8.4.2 Communication System Market Size Estimates and Forecasts to 2032 (USD Billion)

8.4.3 Radio Network

8.4.3.1 Radio Network Market Trends Analysis (2020-2032)

8.4.3.2 Radio Network Market Size Estimates and Forecasts to 2032 (USD Billion)

8.4.4 Emergency Network

8.4.4.1 Emergency Network Market Trends Analysis (2020-2032)

8.4.4.2 Emergency Network Market Size Estimates and Forecasts to 2032 (USD Billion)

8.4.5 Data Network

8.4.5.1 Data Network Market Trends Analysis (2020-2032)

8.4.5.2 Data Network Market Size Estimates and Forecasts to 2032 (USD Billion)

8.5 Monitoring System

8.5.1 Monitoring System Market Trends Analysis (2020-2032)

8.5.2 Monitoring System Market Size Estimates and Forecasts to 2032 (USD Billion)

8.5.3 Traffic Measurement

8.5.3.1 Traffic Measurement Market Trends Analysis (2020-2032)

8.5.3.2 Traffic Measurement Market Size Estimates and Forecasts to 2032 (USD Billion)

8.5.4 Weather Management

8.5.4.1 Weather Management Market Trends Analysis (2020-2032)

8.5.4.2 Weather Management Market Size Estimates and Forecasts to 2032 (USD Billion)

8.5.5 Video Surveillance

8.5.5.1 Video Surveillance Market Trends Analysis (2020-2032)

8.5.5.2 Video Surveillance Market Size Estimates and Forecasts to 2032 (USD Billion)

9. Smart Highways Market Segmentation, by Deployment

9.1 Chapter Overview

9.2 Cloud

9.2.1 Cloud Market Trends Analysis (2020-2032)

9.2.2 Cloud Market Size Estimates and Forecasts to 2032 (USD Billion)

9.3 On-Premises

             9.3.1 On-Premises Market Trends Analysis (2020-2032)

9.3.2 On-Premises Market Size Estimates and Forecasts to 2032 (USD Billion)

10. Regional Analysis

10.1 Chapter Overview

10.2 North America

10.2.1 Trends Analysis

10.2.2 North America Smart Highways Market Estimates and Forecasts, by Country (2020-2032) (USD Billion)

10.2.3 North America Smart Highways Market Estimates and Forecasts, by Displays (2020-2032) (USD Billion)  

10.2.4 North America Smart Highways Market Estimates and Forecasts, by Technology (2020-2032) (USD Billion)

10.2.5 North America Smart Highways Market Estimates and Forecasts, by Deployment (2020-2032) (USD Billion)

10.2.6 USA

10.2.6.1 USA Smart Highways Market Estimates and Forecasts, by Displays (2020-2032) (USD Billion)

10.2.6.2 USA Smart Highways Market Estimates and Forecasts, by Technology (2020-2032) (USD Billion)

10.2.6.3 USA Smart Highways Market Estimates and Forecasts, by Deployment (2020-2032) (USD Billion)

10.2.7 Canada

10.2.7.1 Canada Smart Highways Market Estimates and Forecasts, by Displays (2020-2032) (USD Billion)

10.2.7.2 Canada Smart Highways Market Estimates and Forecasts, by Technology (2020-2032) (USD Billion)

10.2.7.3 Canada Smart Highways Market Estimates and Forecasts, by Deployment (2020-2032) (USD Billion)

10.2.8 Mexico

10.2.8.1 Mexico Smart Highways Market Estimates and Forecasts, by Displays (2020-2032) (USD Billion)

10.2.8.2 Mexico Smart Highways Market Estimates and Forecasts, by Technology (2020-2032) (USD Billion)

10.2.8.3 Mexico Smart Highways Market Estimates and Forecasts, by Deployment (2020-2032) (USD Billion)

10.3 Europe

10.3.1 Eastern Europe

10.3.1.1 Trends Analysis

10.3.1.2 Eastern Europe Smart Highways Market Estimates and Forecasts, by Country (2020-2032) (USD Billion)

10.3.1.3 Eastern Europe Smart Highways Market Estimates and Forecasts, by Displays (2020-2032) (USD Billion)  

10.3.1.4 Eastern Europe Smart Highways Market Estimates and Forecasts, by Technology (2020-2032) (USD Billion)

10.3.1.5 Eastern Europe Smart Highways Market Estimates and Forecasts, by Deployment (2020-2032) (USD Billion)

10.3.1.6 Poland

10.3.1.6.1 Poland Smart Highways Market Estimates and Forecasts, by Displays (2020-2032) (USD Billion)

10.3.1.6.2 Poland Smart Highways Market Estimates and Forecasts, by Technology (2020-2032) (USD Billion)

10.3.1.6.3 Poland Smart Highways Market Estimates and Forecasts, by Deployment (2020-2032) (USD Billion)

10.3.1.7 Romania

10.3.1.7.1 Romania Smart Highways Market Estimates and Forecasts, by Displays (2020-2032) (USD Billion)

10.3.1.7.2 Romania Smart Highways Market Estimates and Forecasts, by Technology (2020-2032) (USD Billion)

10.3.1.7.3 Romania Smart Highways Market Estimates and Forecasts, by Deployment (2020-2032) (USD Billion)

10.3.1.8 Hungary

10.3.1.8.1 Hungary Smart Highways Market Estimates and Forecasts, by Displays (2020-2032) (USD Billion)

10.3.1.8.2 Hungary Smart Highways Market Estimates and Forecasts, by Technology (2020-2032) (USD Billion)

10.3.1.8.3 Hungary Smart Highways Market Estimates and Forecasts, by Deployment (2020-2032) (USD Billion)

10.3.1.9 Turkey

10.3.1.9.1 Turkey Smart Highways Market Estimates and Forecasts, by Displays (2020-2032) (USD Billion)

10.3.1.9.2 Turkey Smart Highways Market Estimates and Forecasts, by Technology (2020-2032) (USD Billion)

10.3.1.9.3 Turkey Smart Highways Market Estimates and Forecasts, by Deployment (2020-2032) (USD Billion)

10.3.1.10 Rest of Eastern Europe

10.3.1.10.1 Rest of Eastern Europe Smart Highways Market Estimates and Forecasts, by Displays (2020-2032) (USD Billion)

10.3.1.10.2 Rest of Eastern Europe Smart Highways Market Estimates and Forecasts, by Technology (2020-2032) (USD Billion)

10.3.1.10.3 Rest of Eastern Europe Smart Highways Market Estimates and Forecasts, by Deployment (2020-2032) (USD Billion)

10.3.2 Western Europe

10.3.2.1 Trends Analysis

10.3.2.2 Western Europe Smart Highways Market Estimates and Forecasts, by Country (2020-2032) (USD Billion)

10.3.2.3 Western Europe Smart Highways Market Estimates and Forecasts, by Displays (2020-2032) (USD Billion)  

10.3.2.4 Western Europe Smart Highways Market Estimates and Forecasts, by Technology (2020-2032) (USD Billion)

10.3.2.5 Western Europe Smart Highways Market Estimates and Forecasts, by Deployment (2020-2032) (USD Billion)

10.3.2.6 Germany

10.3.2.6.1 Germany Smart Highways Market Estimates and Forecasts, by Displays (2020-2032) (USD Billion)

10.3.2.6.2 Germany Smart Highways Market Estimates and Forecasts, by Technology (2020-2032) (USD Billion)

10.3.2.6.3 Germany Smart Highways Market Estimates and Forecasts, by Deployment (2020-2032) (USD Billion)

10.3.2.7 France

10.3.2.7.1 France Smart Highways Market Estimates and Forecasts, by Displays (2020-2032) (USD Billion)

10.3.2.7.2 France Smart Highways Market Estimates and Forecasts, by Technology (2020-2032) (USD Billion)

10.3.2.7.3 France Smart Highways Market Estimates and Forecasts, by Deployment (2020-2032) (USD Billion)

10.3.2.8 UK

10.3.2.8.1 UK Smart Highways Market Estimates and Forecasts, by Displays (2020-2032) (USD Billion)

10.3.2.8.2 UK Smart Highways Market Estimates and Forecasts, by Technology (2020-2032) (USD Billion)

10.3.2.8.3 UK Smart Highways Market Estimates and Forecasts, by Deployment (2020-2032) (USD Billion)

10.3.2.9 Italy

10.3.2.9.1 Italy Smart Highways Market Estimates and Forecasts, by Displays (2020-2032) (USD Billion)

10.3.2.9.2 Italy Smart Highways Market Estimates and Forecasts, by Technology (2020-2032) (USD Billion)

10.3.2.9.3 Italy Smart Highways Market Estimates and Forecasts, by Deployment (2020-2032) (USD Billion)

10.3.2.10 Spain

10.3.2.10.1 Spain Smart Highways Market Estimates and Forecasts, by Displays (2020-2032) (USD Billion)

10.3.2.10.2 Spain Smart Highways Market Estimates and Forecasts, by Technology (2020-2032) (USD Billion)

10.3.2.10.3 Spain Smart Highways Market Estimates and Forecasts, by Deployment (2020-2032) (USD Billion)

10.3.2.11 Netherlands

10.3.2.11.1 Netherlands Smart Highways Market Estimates and Forecasts, by Displays (2020-2032) (USD Billion)

10.3.2.11.2 Netherlands Smart Highways Market Estimates and Forecasts, by Technology (2020-2032) (USD Billion)

10.3.2.11.3 Netherlands Smart Highways Market Estimates and Forecasts, by Deployment (2020-2032) (USD Billion)

10.3.2.12 Switzerland

10.3.2.12.1 Switzerland Smart Highways Market Estimates and Forecasts, by Displays (2020-2032) (USD Billion)

10.3.2.12.2 Switzerland Smart Highways Market Estimates and Forecasts, by Technology (2020-2032) (USD Billion)

10.3.2.12.3 Switzerland Smart Highways Market Estimates and Forecasts, by Deployment (2020-2032) (USD Billion)

10.3.2.13 Austria

10.3.2.13.1 Austria Smart Highways Market Estimates and Forecasts, by Displays (2020-2032) (USD Billion)

10.3.2.13.2 Austria Smart Highways Market Estimates and Forecasts, by Technology (2020-2032) (USD Billion)

10.3.2.13.3 Austria Smart Highways Market Estimates and Forecasts, by Deployment (2020-2032) (USD Billion)

10.3.2.14 Rest of Western Europe

10.3.2.14.1 Rest of Western Europe Smart Highways Market Estimates and Forecasts, by Displays (2020-2032) (USD Billion)

10.3.2.14.2 Rest of Western Europe Smart Highways Market Estimates and Forecasts, by Technology (2020-2032) (USD Billion)

10.3.2.14.3 Rest of Western Europe Smart Highways Market Estimates and Forecasts, by Deployment (2020-2032) (USD Billion)

10.4 Asia-Pacific

10.4.1 Trends Analysis

10.4.2 Asia-Pacific Smart Highways Market Estimates and Forecasts, by Country (2020-2032) (USD Billion)

10.4.3 Asia-Pacific Smart Highways Market Estimates and Forecasts, by Displays (2020-2032) (USD Billion)  

10.4.4 Asia-Pacific Smart Highways Market Estimates and Forecasts, by Technology (2020-2032) (USD Billion)

10.4.5 Asia-Pacific Smart Highways Market Estimates and Forecasts, by Deployment (2020-2032) (USD Billion)

10.4.6 China

10.4.6.1 China Smart Highways Market Estimates and Forecasts, by Displays (2020-2032) (USD Billion)

10.4.6.2 China Smart Highways Market Estimates and Forecasts, by Technology (2020-2032) (USD Billion)

10.4.6.3 China Smart Highways Market Estimates and Forecasts, by Deployment (2020-2032) (USD Billion)

10.4.7 India

10.4.7.1 India Smart Highways Market Estimates and Forecasts, by Displays (2020-2032) (USD Billion)

10.4.7.2 India Smart Highways Market Estimates and Forecasts, by Technology (2020-2032) (USD Billion)

10.4.7.3 India Smart Highways Market Estimates and Forecasts, by Deployment (2020-2032) (USD Billion)

10.4.8 Japan

10.4.8.1 Japan Smart Highways Market Estimates and Forecasts, by Displays (2020-2032) (USD Billion)

10.4.8.2 Japan Smart Highways Market Estimates and Forecasts, by Technology (2020-2032) (USD Billion)

10.4.8.3 Japan Smart Highways Market Estimates and Forecasts, by Deployment (2020-2032) (USD Billion)

10.4.9 South Korea

10.4.9.1 South Korea Smart Highways Market Estimates and Forecasts, by Displays (2020-2032) (USD Billion)

10.4.9.2 South Korea Smart Highways Market Estimates and Forecasts, by Technology (2020-2032) (USD Billion)

10.4.9.3 South Korea Smart Highways Market Estimates and Forecasts, by Deployment (2020-2032) (USD Billion)

10.4.10 Vietnam

10.4.10.1 Vietnam Smart Highways Market Estimates and Forecasts, by Displays (2020-2032) (USD Billion)

10.4.10.2 Vietnam Smart Highways Market Estimates and Forecasts, by Technology (2020-2032) (USD Billion)

10.4.10.3 Vietnam Smart Highways Market Estimates and Forecasts, by Deployment (2020-2032) (USD Billion)

10.4.11 Singapore

10.4.11.1 Singapore Smart Highways Market Estimates and Forecasts, by Displays (2020-2032) (USD Billion)

10.4.11.2 Singapore Smart Highways Market Estimates and Forecasts, by Technology (2020-2032) (USD Billion)

10.4.11.3 Singapore Smart Highways Market Estimates and Forecasts, by Deployment (2020-2032) (USD Billion)

10.4.12 Australia

10.4.12.1 Australia Smart Highways Market Estimates and Forecasts, by Displays (2020-2032) (USD Billion)

10.4.12.2 Australia Smart Highways Market Estimates and Forecasts, by Technology (2020-2032) (USD Billion)

10.4.12.3 Australia Smart Highways Market Estimates and Forecasts, by Deployment (2020-2032) (USD Billion)

10.4.13 Rest of Asia-Pacific

10.4.13.1 Rest of Asia-Pacific Smart Highways Market Estimates and Forecasts, by Displays (2020-2032) (USD Billion)

10.4.13.2 Rest of Asia-Pacific Smart Highways Market Estimates and Forecasts, by Technology (2020-2032) (USD Billion)

10.4.13.3 Rest of Asia-Pacific Smart Highways Market Estimates and Forecasts, by Deployment (2020-2032) (USD Billion)

10.5 Middle East and Africa

10.5.1 Middle East

10.5.1.1 Trends Analysis

10.5.1.2 Middle East Smart Highways Market Estimates and Forecasts, by Country (2020-2032) (USD Billion)

10.5.1.3 Middle East Smart Highways Market Estimates and Forecasts, by Displays (2020-2032) (USD Billion)  

10.5.1.4 Middle East Smart Highways Market Estimates and Forecasts, by Technology (2020-2032) (USD Billion)

10.5.1.5 Middle East Smart Highways Market Estimates and Forecasts, by Deployment (2020-2032) (USD Billion)

10.5.1.6 UAE

10.5.1.6.1 UAE Smart Highways Market Estimates and Forecasts, by Displays (2020-2032) (USD Billion)

10.5.1.6.2 UAE Smart Highways Market Estimates and Forecasts, by Technology (2020-2032) (USD Billion)

10.5.1.6.3 UAE Smart Highways Market Estimates and Forecasts, by Deployment (2020-2032) (USD Billion)

10.5.1.7 Egypt

10.5.1.7.1 Egypt Smart Highways Market Estimates and Forecasts, by Displays (2020-2032) (USD Billion)

10.5.1.7.2 Egypt Smart Highways Market Estimates and Forecasts, by Technology (2020-2032) (USD Billion)

10.5.1.7.3 Egypt Smart Highways Market Estimates and Forecasts, by Deployment (2020-2032) (USD Billion)

10.5.1.8 Saudi Arabia

10.5.1.8.1 Saudi Arabia Smart Highways Market Estimates and Forecasts, by Displays (2020-2032) (USD Billion)

10.5.1.8.2 Saudi Arabia Smart Highways Market Estimates and Forecasts, by Technology (2020-2032) (USD Billion)

10.5.1.8.3 Saudi Arabia Smart Highways Market Estimates and Forecasts, by Deployment (2020-2032) (USD Billion)

10.5.1.9 Qatar

10.5.1.9.1 Qatar Smart Highways Market Estimates and Forecasts, by Displays (2020-2032) (USD Billion)

10.5.1.9.2 Qatar Smart Highways Market Estimates and Forecasts, by Technology (2020-2032) (USD Billion)

10.5.1.9.3 Qatar Smart Highways Market Estimates and Forecasts, by Deployment (2020-2032) (USD Billion)

10.5.1.10 Rest of Middle East

10.5.1.10.1 Rest of Middle East Smart Highways Market Estimates and Forecasts, by Displays (2020-2032) (USD Billion)

10.5.1.10.2 Rest of Middle East Smart Highways Market Estimates and Forecasts, by Technology (2020-2032) (USD Billion)

10.5.1.10.3 Rest of Middle East Smart Highways Market Estimates and Forecasts, by Deployment (2020-2032) (USD Billion)

10.5.2 Africa

10.5.2.1 Trends Analysis

10.5.2.2 Africa Smart Highways Market Estimates and Forecasts, by Country (2020-2032) (USD Billion)

10.5.2.3 Africa Smart Highways Market Estimates and Forecasts, by Displays (2020-2032) (USD Billion)  

10.5.2.4 Africa Smart Highways Market Estimates and Forecasts, by Technology (2020-2032) (USD Billion)

10.5.2.5 Africa Smart Highways Market Estimates and Forecasts, by Deployment (2020-2032) (USD Billion)

10.5.2.6 South Africa

10.5.2.6.1 South Africa Smart Highways Market Estimates and Forecasts, by Displays (2020-2032) (USD Billion)

10.5.2.6.2 South Africa Smart Highways Market Estimates and Forecasts, by Technology (2020-2032) (USD Billion)

10.5.2.6.3 South Africa Smart Highways Market Estimates and Forecasts, by Deployment (2020-2032) (USD Billion)

10.5.2.7 Nigeria

10.5.2.7.1 Nigeria Smart Highways Market Estimates and Forecasts, by Displays (2020-2032) (USD Billion)

10.5.2.7.2 Nigeria Smart Highways Market Estimates and Forecasts, by Technology (2020-2032) (USD Billion)

10.5.2.7.3 Nigeria Smart Highways Market Estimates and Forecasts, by Deployment (2020-2032) (USD Billion)

10.5.2.8 Rest of Africa

10.5.2.8.1 Rest of Africa Smart Highways Market Estimates and Forecasts, by Displays (2020-2032) (USD Billion)

10.5.2.8.2 Rest of Africa Smart Highways Market Estimates and Forecasts, by Technology (2020-2032) (USD Billion)

10.5.2.8.3 Rest of Africa Smart Highways Market Estimates and Forecasts, by Deployment (2020-2032) (USD Billion)

10.6 Latin America

10.6.1 Trends Analysis

10.6.2 Latin America Smart Highways Market Estimates and Forecasts, by Country (2020-2032) (USD Billion)

10.6.3 Latin America Smart Highways Market Estimates and Forecasts, by Displays (2020-2032) (USD Billion)  

10.6.4 Latin America Smart Highways Market Estimates and Forecasts, by Technology (2020-2032) (USD Billion)

10.6.5 Latin America Smart Highways Market Estimates and Forecasts, by Deployment (2020-2032) (USD Billion)

10.6.6 Brazil

10.6.6.1 Brazil Smart Highways Market Estimates and Forecasts, by Displays (2020-2032) (USD Billion)

10.6.6.2 Brazil Smart Highways Market Estimates and Forecasts, by Technology (2020-2032) (USD Billion)

10.6.6.3 Brazil Smart Highways Market Estimates and Forecasts, by Deployment (2020-2032) (USD Billion)

10.6.7 Argentina

10.6.7.1 Argentina Smart Highways Market Estimates and Forecasts, by Displays (2020-2032) (USD Billion)

10.6.7.2 Argentina Smart Highways Market Estimates and Forecasts, by Technology (2020-2032) (USD Billion)

10.6.7.3 Argentina Smart Highways Market Estimates and Forecasts, by Deployment (2020-2032) (USD Billion)

10.6.8 Colombia

10.6.8.1 Colombia Smart Highways Market Estimates and Forecasts, by Displays (2020-2032) (USD Billion)

10.6.8.2 Colombia Smart Highways Market Estimates and Forecasts, by Technology (2020-2032) (USD Billion)

10.6.8.3 Colombia Smart Highways Market Estimates and Forecasts, by Deployment (2020-2032) (USD Billion)

10.6.9 Rest of Latin America

10.6.9.1 Rest of Latin America Smart Highways Market Estimates and Forecasts, by Displays (2020-2032) (USD Billion)

10.6.9.2 Rest of Latin America Smart Highways Market Estimates and Forecasts, by Technology (2020-2032) (USD Billion)

10.6.9.3 Rest of Latin America Smart Highways Market Estimates and Forecasts, by Deployment (2020-2032) (USD Billion)

11. Company Profiles

11.1 Cisco Systems Inc.

11.1.1 Company Overview

11.1.2 Financial

11.1.3 Products/ Services Offered

11.1.4 SWOT Analysis

11.2 Huawei Technologies Co. Ltd.

11.2.1 Company Overview

11.2.2 Financial

11.2.3 Products/ Services Offered

11.2.4 SWOT Analysis

11.3 Alcatel-Lucent S.A.

11.3.1 Company Overview

11.3.2 Financial

11.3.3 Products/ Services Offered

11.3.4 SWOT Analysis

11.4 Kapsch TrafficCom AG

11.4.1 Company Overview

11.4.2 Financial

11.4.3 Products/ Services Offered

11.4.4 SWOT Analysis

11.5 IBM

11.5.1 Company Overview

11.5.2 Financial

11.5.3 Products/ Services Offered

11.5.4 SWOT Analysis

11.6 Indra Sistemas S.A.

11.6.1 Company Overview

11.6.2 Financial

11.6.3 Products/ Services Offered

11.6.4 SWOT Analysis

11.7 Schneider Electric

11.7.1 Company Overview

11.7.2 Financial

11.7.3 Products/ Services Offered

11.7.4 SWOT Analysis

11.8 Siemens

             11.8.1 Company Overview

11.8.2 Financial

11.8.3 Products/ Services Offered

11.8.4 SWOT Analysis

11.9 Xerox Corporation

             11.9.1 Company Overview

11.9.2 Financial

11.9.3 Products/ Services Offered

11.9.4 SWOT Analysis

11.10 LG CNS Corporation

11.10.1 Company Overview

11.10.2 Financial

11.10.3 Products/ Services Offered

11.10.4 SWOT Analysis

12. Use Cases and Best Practices

13. Conclusion

An accurate research report requires proper strategizing as well as implementation. There are multiple factors involved in the completion of good and accurate research report and selecting the best methodology to compete the research is the toughest part. Since the research reports we provide play a crucial role in any company’s decision-making process, therefore we at SNS Insider always believe that we should choose the best method which gives us results closer to reality. This allows us to reach at a stage wherein we can provide our clients best and accurate investment to output ratio.

Each report that we prepare takes a timeframe of 350-400 business hours for production. Starting from the selection of titles through a couple of in-depth brain storming session to the final QC process before uploading our titles on our website we dedicate around 350 working hours. The titles are selected based on their current market cap and the foreseen CAGR and growth.


The 5 steps process:

Step 1: Secondary Research:

Secondary Research or Desk Research is as the name suggests is a research process wherein, we collect data through the readily available information. In this process we use various paid and unpaid databases which our team has access to and gather data through the same. This includes examining of listed companies’ annual reports, Journals, SEC filling etc. Apart from this our team has access to various associations across the globe across different industries. Lastly, we have exchange relationships with various university as well as individual libraries.

Secondary Research

Step 2: Primary Research

When we talk about primary research, it is a type of study in which the researchers collect relevant data samples directly, rather than relying on previously collected data.  This type of research is focused on gaining content specific facts that can be sued to solve specific problems. Since the collected data is fresh and first hand therefore it makes the study more accurate and genuine.

We at SNS Insider have divided Primary Research into 2 parts.

Part 1 wherein we interview the KOLs of major players as well as the upcoming ones across various geographic regions. This allows us to have their view over the market scenario and acts as an important tool to come closer to the accurate market numbers. As many as 45 paid and unpaid primary interviews are taken from both the demand and supply side of the industry to make sure we land at an accurate judgement and analysis of the market.

This step involves the triangulation of data wherein our team analyses the interview transcripts, online survey responses and observation of on filed participants. The below mentioned chart should give a better understanding of the part 1 of the primary interview.

Primary Research

Part 2: In this part of primary research the data collected via secondary research and the part 1 of the primary research is validated with the interviews from individual consultants and subject matter experts.

Consultants are those set of people who have at least 12 years of experience and expertise within the industry whereas Subject Matter Experts are those with at least 15 years of experience behind their back within the same space. The data with the help of two main processes i.e., FGDs (Focused Group Discussions) and IDs (Individual Discussions). This gives us a 3rd party nonbiased primary view of the market scenario making it a more dependable one while collation of the data pointers.

Step 3: Data Bank Validation

Once all the information is collected via primary and secondary sources, we run that information for data validation. At our intelligence centre our research heads track a lot of information related to the market which includes the quarterly reports, the daily stock prices, and other relevant information. Our data bank server gets updated every fortnight and that is how the information which we collected using our primary and secondary information is revalidated in real time.

Data Bank Validation

Step 4: QA/QC Process

After all the data collection and validation our team does a final level of quality check and quality assurance to get rid of any unwanted or undesired mistakes. This might include but not limited to getting rid of the any typos, duplication of numbers or missing of any important information. The people involved in this process include technical content writers, research heads and graphics people. Once this process is completed the title gets uploader on our platform for our clients to read it.

Step 5: Final QC/QA Process:

This is the last process and comes when the client has ordered the study. In this process a final QA/QC is done before the study is emailed to the client. Since we believe in giving our clients a good experience of our research studies, therefore, to make sure that we do not lack at our end in any way humanly possible we do a final round of quality check and then dispatch the study to the client.

Key Segments:

By Displays

By Technology

  • Intelligent Transport Management System

    • Lane Departure Warning System (LDW)

    • Automatic Number Plate Recognition (ANPR)

    • Incident Detection System

    • Radio Frequency Identification (RFID)

  • Intelligent Traffic Management System

    • Lane Departure Warning System (LDW)

    • Automatic Number Plate Recognition (ANPR)

    • Incident Detection System

  • Communication System

    • Radio Network

    • Emergency Network

    • Data Network

  • Monitoring System

    • Traffic Measurement

    • Weather Management

    • Video Surveillance

By Deployments

  • On-Cloud

  • On-Premises

Request for Segment Customization as per your Business Requirement: Segment Customization Request

REGIONAL COVERAGE:

North America

  • US

  • Canada

  • Mexico

Europe

  • Eastern Europe

    • Poland

    • Romania

    • Hungary

    • Turkey

    • Rest of Eastern Europe

  • Western Europe

    • Germany

    • France

    • UK

    • Italy

    • Spain

    • Netherlands

    • Switzerland

    • Austria

    • Rest of Western Europe

Asia Pacific

  • China

  • India

  • Japan

  • South Korea

  • Vietnam

  • Singapore

  • Australia

  • Rest of Asia Pacific

Middle East & Africa

  • Middle East

    • UAE

    • Egypt

    • Saudi Arabia

    • Qatar

    • Rest of the Middle East

  • Africa

    • Nigeria

    • South Africa

    • Rest of Africa

Latin America

  • Brazil

  • Argentina

  • Colombia

Request for Country Level Research Report: Country Level Customization Request

Available Customization

With the given market data, SNS Insider offers customization as per the company’s specific needs. The following customization options are available for the report:

  • Product Analysis

  • Criss-Cross segment analysis (e.g. Product X Application)

  • Product Matrix which gives a detailed comparison of the product portfolio of each company

  • Geographic Analysis

  • Additional countries in any of the regions

  • Company Information

  • Detailed analysis and profiling of additional market players (Up to five)


  •            5000 (33% Discount)


  •            8950 (40% Discount)


  •            3050 (23% Discount)

Start a Conversation

Hi! Click one of our member below to chat on Phone