Mobile Engagement Market Report Scope & Overview:
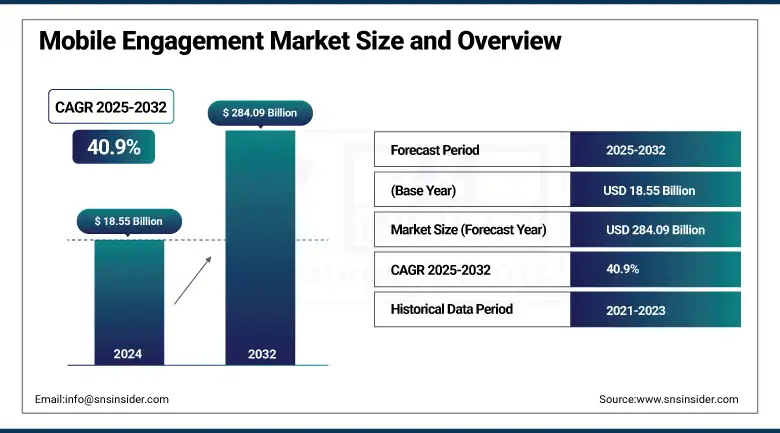
The Mobile Engagement Market size was valued at USD 18.55 billion in 2024 and is expected to reach USD 284.09 billion by 2032, expanding at a CAGR of 40.9% over the forecast period of 2025-2032.
As businesses strive to deliver personalized, real-time communication with customers to provide the best experience, it is gaining traction in the mobile engagement industry. It includes push notifications, SMS, in-app messaging, emails, and app content as solutions to support multi-channel user engagement. BFSI, retail, and telecoms are leveraging these tools to drive retention and conversions. The market is dominated by large enterprises, while SMEs are the fastest-growing segment as they are undergoing digital transformation. Geography-wise, North America is leading while Asia-Pacific is fast catching up. Some of the prominent mobile engagement market companies are Urban Airship, Braze, IBM, and Salesforce, among others. Innovation in new AI-Powered, Data-Driven Solutions for deeper Customer Connection is majorly fueling the demand for the market.
According to research, mobile engagement platforms reduce customer churn by up to 25%, with 59% of enterprises using them across 3+ digital channels, and 5G regions seeing 37% higher mobile campaign interaction.
Mobile Engagement Market Size and Forecast:
-
Market Size in 2024: USD 18.55 Billion
-
Market Size by 2032: USD 284.09 Billion
-
CAGR: 40.9% from 2025 to 2032
-
Base Year: 2024
-
Forecast Period: 2025–2032
-
Historical Data: 2021–2023
To Get more information On Mobile Engagement Market - Request Free Sample Report
Mobile Engagement Market Trends:
-
Rapid smartphone penetration and increased mobile internet usage are significantly driving mobile engagement platform adoption.
-
Growing demand for personalized customer experiences through AI-powered messaging, push notifications, and in-app engagement tools is accelerating market growth.
-
Expansion of omnichannel marketing strategies is encouraging businesses to integrate SMS, email, chatbots, and social media into unified engagement platforms.
-
Increasing e-commerce and mobile commerce (m-commerce) activities are fueling the need for real-time customer interaction solutions.
-
Rising adoption of cloud-based engagement platforms is enhancing scalability, analytics capabilities, and campaign automation efficiency.
-
Advancements in data analytics, machine learning, and customer behavior tracking are enabling predictive engagement and higher customer retention rates.
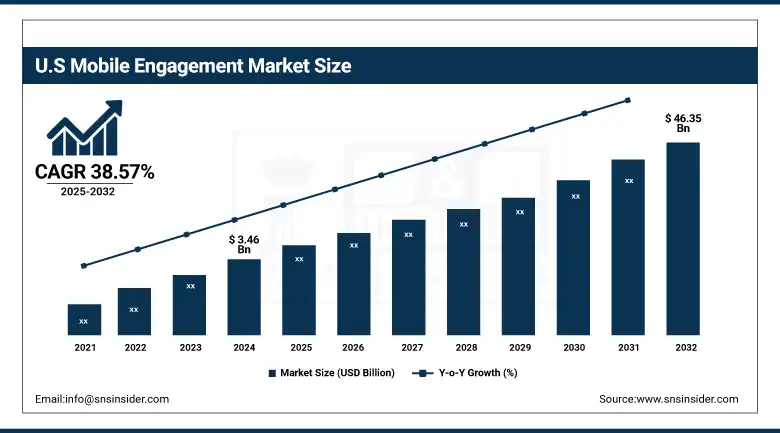
U.S. Mobile Engagement Market Size Outlook:
The U.S. Mobile Engagement Market reached USD 3.46 billion in 2024 and is projected to grow to USD 46.35 billion by 2032, with a CAGR of 38.57% over 2025-2032. The U.S. is the most dominant due to its technological infrastructure, high penetration of smartphones, and adoption of mobile apps across verticals, such as retail, BFSI, and telecom. Large investments in digital marketing and customer experience technologies further propel growth. Factors driving the market are the growing demand for individualized communication, such as via push notifications, SMS, in-app messaging, and emails, facilitating customer engagement and customer loyalty. In addition, e-commerce is on the rise, and the improved merger of artificial intelligence and machine learning allows for hyper-personalized, real-time interactions. The U.S. digital ecosystem is well-matured, and possessing some very innovative vendors has made the country a leader for mobile engagement solutions globally.
Mobile Engagement Market Drivers:
-
Increasing Adoption of Personalized and Real-Time Mobile Communication Channels Drives Customer Engagement Growth
High adoption of custom-made and immediate ways of communication is the major factor accelerating the mobile engagement market growth. Businesses use push notifications, SMS, in-app messaging, and email campaigns to send targeted content based on what the customer likes, thus creating more customer satisfaction and loyalty. Now, AI and machine learning are being used to provide better predictive analytics to hyper-personalize experiences. Furthermore, omnichannel strategies are emerging to facilitate smooth experiences on various devices. In today’s fast-paced digital era, enterprises invest heavily in mobile engagement technologies to meet consumer demand for instant, relevant brand interactions, driving widespread adoption.
Mobile Engagement Market Restraints:
-
Data Privacy Concerns and Regulatory Compliance Limit the Expansion of Mobile Communication Platforms
A major restraint is privacy and data protection regulations. Demand for data privacy is rising among users, while legislation including GDPR and CCPA calls for stringent data collection and usage standards. This forces companies to invest in compliance mechanisms, which not only increases the cost of operations but also causes some delay in deployment. In addition, the fast-changing privacy policies breed uncertainty, limiting the scope of actionable insights. Such restraint, however, will also serve to delay the growth of mobile engagement, especially among smaller organizations that may not have the disposable resources to ensure full compliance while still engaging on a one-to-one basis.
Mobile Engagement Market Opportunities:
-
Rising Demand for AI-Driven Automation and Predictive Analytics Opens New Growth Opportunities
AI and mobile communication can benefit a lot and expand together. Tools infused with AI improve the accuracy of targeting, performance of campaign placement, and timely delivery of custom messages through automation, directly increasing engagement rates and return on adverts. Innovations, such as sophisticated chatbots and machine learning algorithms that facilitate live evaluation of customer behavior have made it easy for businesses to anticipate customer needs and act accordingly. This will be complemented by increasing investments in AI technologies in various sectors, making way for the mobile engagement solutions innovations that provide the best customer experience or operational efficiency.
Mobile Engagement Market Challenges:
-
Managing Multi-Channel Coordination and Avoiding Customer Overload Remain Key Operational Challenges
The biggest challenge is managing engagement using various channels without bombarding customers. On the contrary, over-communication can make people experience message fatigue, unsubscribe, and lose interest in your brand. This necessitates a high level of orchestration, and orchestration would require integration with real-time data sources on the other end of the spectrum to ensure consistency of messaging while respecting user preferences. In recent mobile engagement market trends, work on frequency capping and sentiment analysis using AI has been witnessed to mitigate customer overloading.
Mobile Engagement Market Segmentation Analysis:
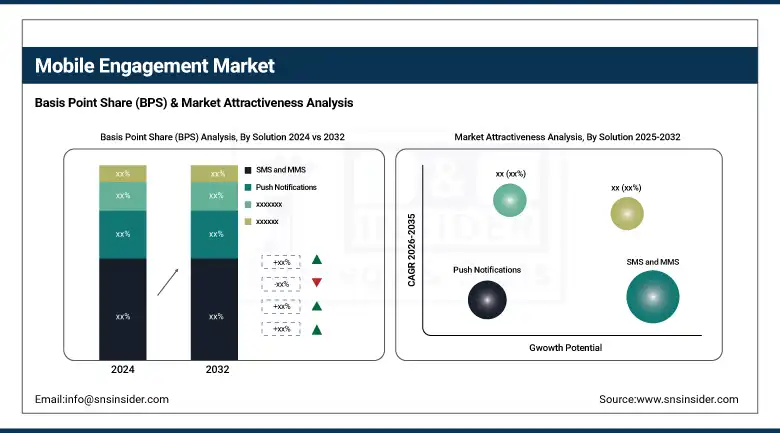
By Solution
The SMS and MMS segment held the highest revenue share of 22.40% during 2024. Due to the wide availability and high open rates of SMS and MMS, even in parts of the globe with limited internet access. This category is extremely useful for transaction alerts, messages, and promotional messages in the BFSI and retail sectors. To boost user engagement, some of the companies like Twilio and Sinch are introducing new SMS APIs, MMS with rich multimedia features. The section is further accelerated by the increase in mobile banking due to its real-time communication requirements.
The push notifications segment will grow at the highest CAGR of 41.83%, due to the increasing need for real-time personalized communication. Push notifications are especially useful for businesses as they can help with re-engagement, updates, and offers, especially in apps. One of the main drivers is that app usage is on the rise and consumer expectations is demanding on time content. The effectiveness of push notifications in boosting app stickiness and causing user actions makes it inevitable that they emerge as a crucial constituent of mobile engagement, particularly for the retail, media, and e-commerce platforms.
Recently, Braze debuted automation and segmentation capabilities, while OneSignal unveiled predictive notification delivery.
By Organization Size
The large enterprises segment contributed a 56.19% revenue share in 2024. They prioritize personalization grounded in data to be ahead of the curve on competition. Salesforce and Oracle have added AI-driven automation and customer journey mapping features to their respective mobile engagement suites over the past few weeks. Phone engagement tools are not just needed but are fundamental in mobile engagement for large enterprises as their scale and levels of complexity are higher, and it becomes impractical to reach such a huge customer base spanning many regions and platforms without one.
SMEs are projected to grow at the highest CAGR of 41.73%, as digital transformation becomes critical to business sustainability and competitiveness. SaaS-based mobile engagement platforms, such as MoEngage and CleverTap have made personalized communication strategies more affordable to smaller firms. These tools enable SMEs to level the playing field with bigger competitors by providing targeted messaging, behavioral analytics, and automated workflows. This initiative aims to enhance customer retention while maximizing ROI and ensuring greater visibility and efficiency for our marketing investments across various strategic projects.
By End-User Industry
The BFSI segment holds the largest mobile engagement market share of 24.49% in 2024, due to the sector's requirement for secure delivery of timely and tailored customer communication. Banks and insurers use mobile engagement to offer alerts or promotions and provide immediate support via SMS, push, and in-app messages. Vibes and Upland Software have offered solutions for the financial services segment with an emphasis on data privacy and compliance. As mobile banking usage increases and customers expect 24/7 access to their money, the demand for powerful mobile engagement tools is rising
According to research, BFSI users show the highest opt-in rate for mobile alerts, with 72% in North America enabling app notifications.
The retail segment is expected to witness the fastest CAGR of 43.21%, propelling the growth owing to increasing focus on omnichannel customer experience and personalized promotions. Mobile engagement is used by retailers for flash sales, loyalty programs, and cart abandonment reminders. Just over the past few months, Braze and Urban Airship have announced launches of features for retailers, including dynamic product recommendations and location-based notifications. A big reason is consumer behavior towards mobile shopping and digital touchpoints. Increasing competition has led retailers across verticals to invest in mobile engagement platforms for customer loyalty & repeat purchases, which is a significant segment contributing to the market growth.
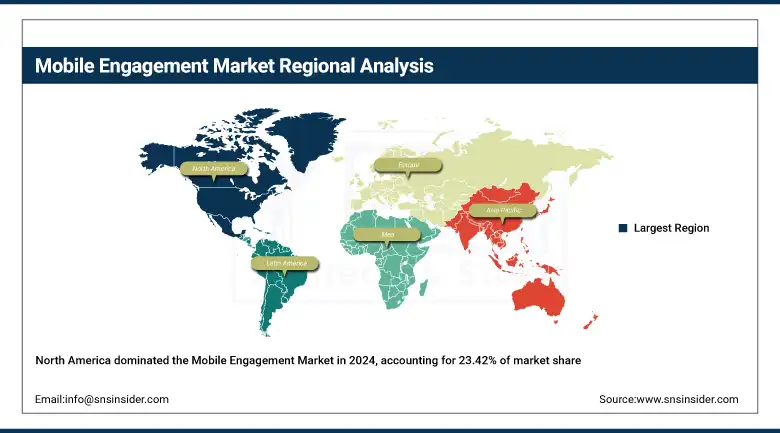
Mobile Engagement Market Regional Analysis:
North America is a market leader with a 23.42% share, an advanced digital infrastructure, higher smartphone penetration, and the adoption of emerging technologies like AI and ML. The presence of a large number of tech giants in the region is the reason why the U.S. dominates the mobile marketing market globally, while the rising demand for personalized mobile marketing among customers to strengthen engagement with users is largely driving the growth of the market in Europe.
Get Customized Report as per Your Business Requirement - Enquiry Now
The U.S. dominates the region due to its robust digital ecosystem, large mobile user base, and significant investments by enterprises in data-driven mobile marketing technologies.
Europe is continuing to experience steady growth in mobile engagement due to rising mobile commerce, GDPR-based data strategies, and increased consumer expectations for personalized experiences. While BFSI and the retail industry have channeled their investments for omnichannel engagement to enhance customer loyalty and interaction on mobile platforms.
The U.K. is the leader in Europe based on high mobile penetration and a relatively mature e-commerce landscape and strong enterprise adoption of customer engagement technologies.
Asia Pacific is the fastest-growing region with a CAGR of 41.54%, due to the area's huge mobile user bases, increased available internet, and rapid adoption of digitalization among developing economies in the region. The need for mobile engagement solutions in the region is further fueled by rapid urbanization and mobile-first consumer behavior.
China rules due to the size of its smartphone user population, the app economy, and government actions to drive both digital infrastructure and business transformation.
The Middle East & Africa and Latin America are witnessing the increasing adoption of mobile engagement because of growing smartphone penetration, digital transformation trends, and mobile-first strategies, with the UAE and Brazil taking the lead to having well-established infrastructure and robust digital ecosystems.
Mobile Engagement Market Key Players:
The major key players of the Mobile Engagement Market are Urban Airship, BRAZE (Appboy), IBM Corporation, Vibes, Upland Software, Salesforce, Marketo Engage, Selligent, Oracle, and MoEngage.
Key Developments:
-
In May 2024, Braze introduced new channel integrations and feature enhancements at Forge 2024, advancing its platform's capabilities to drive customer engagement and deliver greater personalization.
-
In May 2024, IBM introduced new AI assistant functionality and feature innovations at Think 2024, hoping to improve enterprise productivity, simplify automation, and reinforce its position in AI-powered enterprise solutions.
| Report Attributes | Details |
|---|---|
| Market Size in 2024 | USD 18.55 Billion |
| Market Size by 2032 | USD 284.09 Billion |
| CAGR | CAGR of 40.9% From 2025 to 2032 |
| Base Year | 2024 |
| Forecast Period | 2025-2032 |
| Historical Data | 2021-2023 |
| Report Scope & Coverage | Market Size, Segments Analysis, Competitive Landscape, Regional Analysis, DROC & SWOT Analysis, Forecast Outlook |
| Key Segments | •By Solution (SMS and MMS, Push Notifications, In-App Messaging, E-mails, App/Web Content, Others) •By Organization Size (Large Enterprises, Small and Medium Enterprises (SMEs) •By End-User Industry (BFSI, Media and Entertainment, Retail, Travel and Hospitality, IT and Telecom, Others) |
| Regional Analysis/Coverage | North America (US, Canada, Mexico), Europe (Germany, France, UK, Italy, Spain, Poland, Turkey, Rest of Europe), Asia Pacific (China, India, Japan, South Korea, Singapore, Australia, Rest of Asia Pacific), Middle East & Africa (UAE, Saudi Arabia, Qatar, South Africa, Rest of Middle East & Africa), Latin America (Brazil, Argentina, Rest of Latin America) |
| Company Profiles | Urban Airship, BRAZE (Appboy), IBM Corporation, Vibes, Upland Software, Salesforce, Marketo Engage, Selligent, Oracle, MoEngage |
Get in Touch
