Monitoring Tools Market Report Scope & Overview:
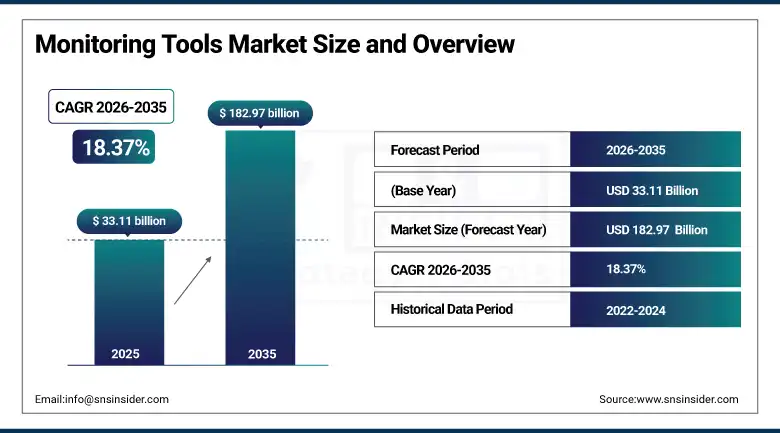
The Monitoring Tools market was valued at USD 33.11 Billion in 2025 and is expected to reach USD 182.97 Billion by 2035, growing at a CAGR of 18.37% from 2026–2035.
The global monitoring tools market is experiencing a period of extraordinary expansion driven by the convergence of digital transformation imperatives, cloud infrastructure proliferation, and the irreversible enterprise shift toward AI-powered observability that is fundamentally redefining what organisations expect from their IT performance management tooling. Traditional reactive monitoring approaches that detected problems after they impacted business operations are giving way to proactive observability platforms that apply machine learning to telemetry data streams from applications, infrastructure, networks, and end-user experience to predict and prevent service degradation before customers are affected, shifting IT operations from a cost centre focused on incident response to a strategic function focused on continuous performance optimisation and business resilience.
Gartner’s prediction that through 2026 organisations that invest in AI-augmented monitoring and observability platforms will experience 60% fewer critical production incidents and reduce mean time to resolution by 75% relative to organisations relying on traditional threshold-based monitoring tools is providing the quantified business case that is driving the rapid replacement of legacy monitoring infrastructure with modern AI-powered observability platforms across enterprises of all sizes and industries globally.
Market Size and Forecast
-
Market Size in 2026E: USD 39.19 Billion
-
Market Size by 2035: USD 182.97 Billion
-
CAGR: 18.37% from 2026 to 2035
-
Fastest Growing Region: Asia Pacific
-
Largest Region: North America
To Get more information On Monitoring Tools Market - Request Free Sample Report
Monitoring Tools Market Trends
-
Rapid adoption of AI-powered anomaly detection and root cause analysis capabilities within monitoring platforms that use machine learning to distinguish meaningful performance deviations from normal operational variability in complex distributed systems, dramatically reducing the alert fatigue that plagues operations teams relying on threshold-based monitoring tools by surfacing only the anomalies that genuinely require human attention while automatically correlating related symptoms to pinpoint root causes faster than manual investigation processes allow.
-
Growing convergence of previously separate monitoring tool categories including application performance monitoring, infrastructure monitoring, network performance monitoring, digital experience monitoring, and security information and event management into unified observability platforms that share a common data ingestion layer, analysis engine, and workflow automation framework, reducing the tool sprawl, data silo, and context switching costs that managing separate monitoring tools for each IT domain historically imposed on operations teams.
-
Accelerating adoption of OpenTelemetry as the open-source standard for generating, collecting, and exporting telemetry data across application and infrastructure environments, enabling organisations to instrument their systems once and feed multiple observability platform backends without vendor-specific instrumentation lock-in, while simultaneously creating a shared data model that facilitates correlation across monitoring domains.
-
Rising demand for business observability capabilities that extend monitoring beyond technical IT metrics into business process performance indicators, customer journey completion rates, revenue impact of service incidents, and sustainability metrics, enabling technical operations teams to communicate the business consequences of performance issues in terms that non-technical executives understand and prioritise resource allocation decisions accordingly.
-
Expansion of monitoring tool adoption among small and medium enterprises driven by the availability of SaaS-delivered monitoring platforms with consumption-based pricing that make comprehensive observability accessible to organisations without large IT operations budgets or dedicated site reliability engineering teams, dramatically expanding the total addressable market beyond the large enterprise segment that historically dominated monitoring tool purchasing.
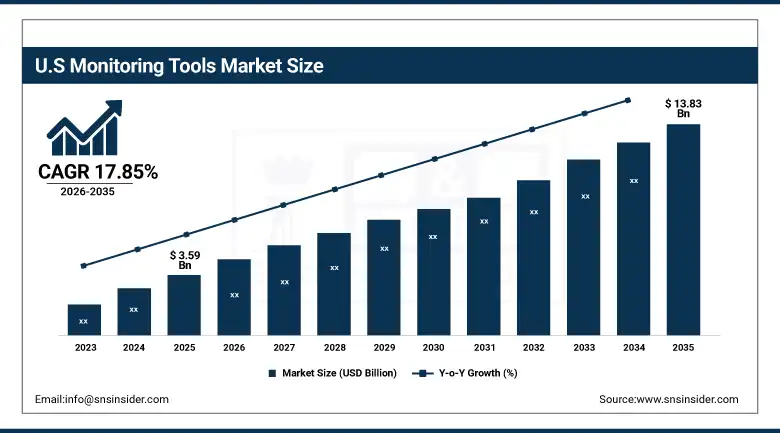
The U.S. Monitoring Tools Market Outlook
The U.S. Monitoring Tools Market was valued at approximately USD 3.59 Billion in 2025 and is expected to reach approximately USD 13.83 Billion by 2035, growing at a CAGR of 17.85%.
The United States monitoring tools market is defined by the extraordinary concentration of technology companies, digital-first enterprises, and cloud infrastructure operators whose operational requirements drive the most demanding monitoring tool adoption and whose feedback shapes product roadmap priorities for the global monitoring tool vendor community. The hyperscale technology companies including Amazon, Microsoft, Google, and Meta have built the world’s most sophisticated internal monitoring and observability platforms to manage their own infrastructure, while simultaneously commercialising monitoring capabilities as cloud platform services that make enterprise-grade observability accessible to their customers through AWS CloudWatch, Azure Monitor, and Google Cloud Operations Suite.
The rapid adoption of generative AI applications in enterprise settings across the United States is creating a new monitoring challenge category as organisations instrument their AI model inference infrastructure, prompt processing pipelines, AI output quality metrics, and AI safety guardrail effectiveness in real time, driving demand for AI observability capabilities that leading monitoring tool vendors are racing to incorporate into their platform offerings ahead of the substantial commercial opportunity that enterprise AI infrastructure monitoring represents.
Monitoring Tools Market Segment Highlights
-
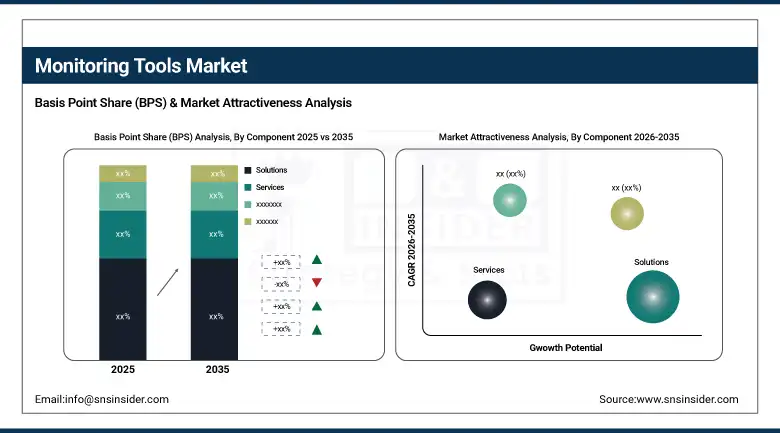
By Component, Solutions dominated the Monitoring Tools Market with approximately 76.5% revenue share in 2025; Services is the fastest-growing segment at a CAGR of approximately 19.7%.
-
By Deployment, Cloud-Based solutions dominated the market with approximately 72.4% revenue share in 2025; On-Premises is the fastest-growing deployment segment at a CAGR of approximately 23.4%.
-
By Enterprise Size, Large Enterprises dominated with approximately 62.5% revenue share in 2025; Small & Medium Enterprises are the fastest-growing segment at a CAGR of approximately 18.4%.
By Component, Solutions dominate, Services grows fastest
Solutions retained the dominant component position with approximately 76.5% of the Monitoring Tools Market in 2025, reflecting the fundamental enterprise requirement for comprehensive monitoring platform deployments that cover the full spectrum of infrastructure, application, network, and user experience telemetry collection, analysis, and alerting capabilities that modern IT operations demand. The monitoring solutions market is characterised by the ongoing platform consolidation trend where previously separate application performance monitoring, infrastructure monitoring, log management, distributed tracing, and digital experience monitoring capabilities are being unified within single commercial platforms that eliminate the data silo, context switching, and integration maintenance costs of running multiple point solutions.
Services is the fastest-growing segment at a CAGR of approximately 19.7% through 2035, propelled by the growing complexity of enterprise monitoring platform implementations that require substantial professional services engagement to design the observability strategy, configure the monitoring platform architecture, migrate from legacy monitoring tools, train operations teams on new workflows, and establish the monitoring governance processes needed to sustain monitoring effectiveness as application and infrastructure environments evolve. Managed monitoring services are growing particularly rapidly as a component of the services segment, as organisations with limited internal site reliability engineering capacity outsource the operational management of their monitoring platform configuration, alert tuning, and performance analysis to specialist managed service providers that can deliver consistent monitoring quality without requiring the internal talent investment that building equivalent in-house monitoring operations capability demands.
By Deployment, Cloud-Based dominates deployment, On-Premises fastest growing
Cloud-Based monitoring solutions held approximately 72.4% of the Monitoring Tools Market in 2025, reflecting the structural alignment between cloud-delivered monitoring platforms and the cloud-first application and infrastructure environments that the majority of enterprise IT organisations have adopted as their target architecture, where the natural observability instrumentation approach is to stream telemetry data to cloud-based analysis and storage platforms that can scale elastically with the monitored environment without requiring organisations to provision and maintain their own monitoring infrastructure capacity. The SaaS delivery model’s commercial advantages including predictable subscription pricing, continuous feature updates without upgrade cycles, and consumption-based scaling that matches monitoring cost to actual infrastructure scope have made cloud-based monitoring the default procurement choice for new monitoring investments across enterprise IT organisations of all sizes and industry verticals.
On-Premises is the fastest-growing deployment segment at a CAGR of approximately 23.4% through 2035, driven by the paradox that while cloud monitoring is the dominant and growing deployment model, the fastest growth rate belongs to the on-premises segment because the regulated industry verticals that require on-premises data processing for compliance reasons are now investing heavily in modern on-premises monitoring infrastructure to replace the ageing legacy tools that have historically served these environments, catching up with the monitoring capability level that cloud-based organisations have enjoyed for several years. Financial services firms subject to data residency regulations, healthcare organisations managing HIPAA-protected patient data telemetry, and government agencies with classified infrastructure monitoring requirements are each investing in modern on-premises observability platforms from vendors including Elastic, Prometheus-based open-source stacks, and the on-premises deployment options of commercial vendors including Dynatrace Managed and Splunk Enterprise that deliver AI-powered observability capabilities within controlled data environments.
Regional Analysis
|
Region |
Major Country |
Share within Region, 2025 (%) |
|---|---|---|
|
North America |
United States |
87.4% |
|
Europe |
Germany |
22.3% |
|
Asia Pacific |
China |
61.7% |
|
Middle East & Africa |
Saudi Arabia |
38.4% |
|
Latin America |
Brazil |
44.2% |
North America Monitoring Tools Market Insights
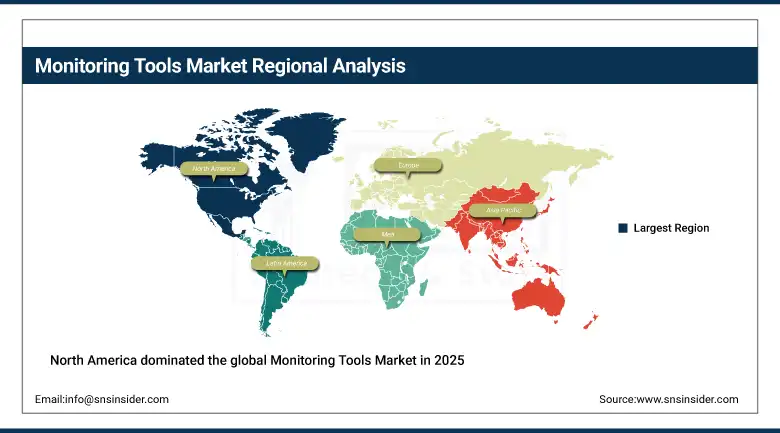
North America dominated the global Monitoring Tools Market in 2025, with the United States accounting for approximately 87.4% of North American revenues, driven by the region’s concentration of both the world’s largest enterprise software buyers across financial services, healthcare, technology, and retail and the venture-backed monitoring tool vendors including Datadog, Dynatrace, New Relic, PagerDuty, and LogicMonitor that are defining the global monitoring platform market from their U.S. headquarters. The U.S. market benefits from the exceptional density of cloud-native enterprises, digital transformation investment, and site reliability engineering talent that collectively create the most demanding and commercially sophisticated monitoring tool adoption environment globally, where organisations are consistently willing to invest in premium monitoring capabilities that deliver measurable improvements in service reliability, incident response time, and infrastructure cost efficiency.
Get Customized Report as per Your Business Requirement - Enquiry Now
Europe Monitoring Tools Market Insights
Europe is a technically sophisticated and rapidly growing monitoring tools market where the GDPR data processing compliance environment, combined with strong enterprise IT governance traditions and significant cloud infrastructure investment across financial services, manufacturing, and telecommunications, is driving sustained monitoring tool adoption growth across both established enterprise buyers and the growing European cloud-native startup ecosystem. Germany accounts for approximately 22.3% of European monitoring tool revenues as the region’s largest national market, anchored by the monitoring infrastructure investments of major industrial technology companies including SAP, Siemens, and Deutsche Telekom alongside the Mittelstand enterprise software companies that are undergoing digital transformation programmes creating new cloud application portfolios requiring modern observability tooling. The European monitoring tools market is being shaped by the growing adoption of open-source observability foundations including Prometheus, Grafana, and OpenTelemetry across the region’s technically sophisticated DevOps communities, creating a distinctive market dynamic where commercial monitoring vendors must demonstrate compelling value beyond open-source capabilities to win enterprise procurement against well-supported open-source alternatives that European organisations are often more willing to deploy at scale than their North American counterparts.
Asia Pacific Monitoring Tools Market Insights
Asia Pacific is the fastest-growing regional monitoring tools market, driven by China’s extraordinary digital economy scale creating massive monitoring infrastructure demand across the technology platforms, financial services institutions, and digital commerce operators that together constitute the world’s second-largest internet economy, India’s rapidly growing technology services sector and domestic digital economy creating strong monitoring tool adoption across both IT services companies and the expanding cohort of Indian internet businesses, and Japan and South Korea’s sophisticated technology enterprises investing in monitoring modernisation as they transition from legacy on-premises IT infrastructure to hybrid and cloud-native application environments. China accounts for approximately 61.7% of Asia Pacific monitoring tool revenues and represents the most dynamic growth market in global monitoring infrastructure, as the combination of the world’s largest mobile internet user base generating unprecedented application performance monitoring requirements, government digital infrastructure investment creating massive public sector monitoring demand, and the competitive intensity of Chinese financial technology and e-commerce platforms driving site reliability engineering investment creates a monitoring tool market growing at rates that far exceed the global average. South Korea’s highly connected digital economy and Japan’s manufacturing and financial services digital transformation programmes represent mature secondary Asia Pacific markets where growing cloud infrastructure adoption is creating sustained monitoring platform replacement and expansion demand.
Latin America and MEA Monitoring Tools Market Insights
Latin America and the Middle East and Africa are rapidly growing monitoring tools markets where digital transformation acceleration, cloud infrastructure expansion, and the growing business criticality of digital applications across financial services, telecommunications, and government services are driving first-generation enterprise monitoring platform investments in markets that previously operated with minimal monitoring infrastructure. Brazil accounts for approximately 44.2% of Latin American monitoring tool revenues through a technology sector characterised by the region’s most sophisticated cloud infrastructure adoption, a large financial services industry investing heavily in digital banking platform reliability, and a growing e-commerce sector whose consumer-facing application performance requirements make monitoring investment a direct revenue protection priority. Saudi Arabia leads Middle East and Africa monitoring tool revenues at approximately 38.4% of the regional total, driven by Vision 2030’s digital government and smart economy agenda creating large-scale cloud infrastructure deployments across government ministries and state-owned enterprises that require enterprise-grade monitoring infrastructure, combined with the monitoring investments of the Saudi telecommunications sector undergoing 5G network deployment and digital service expansion.
Market Dynamics
Growth Drivers: AI-powered observability adoption replacing reactive monitoring, cloud infrastructure complexity demanding modern distributed system monitoring, and digital business criticality elevating monitoring investment priority across all industries
The primary structural growth drivers for the Monitoring Tools Market are the irreversible enterprise transition to distributed cloud-native application architectures that have rendered traditional monitoring approaches functionally inadequate for the technical complexity they must address, combined with the AI-powered observability platform wave that is delivering genuinely transformative improvements in mean time to detection, mean time to resolution, and incident prevention that create measurable and compelling returns on monitoring investment for every organisation that makes the transition from legacy threshold-based monitoring to modern machine learning-enhanced observability. The World Economic Forum’s estimate that digital service outages cost the global economy over USD 1.7 trillion annually, with each hour of major digital platform downtime at large enterprises costing hundreds of thousands to millions of dollars in direct revenue loss, customer compensation, and reputational damage, provides the stark financial context that is driving board-level prioritisation of monitoring investment as a core business resilience capability rather than a pure IT operations support function. The generative AI application deployment wave is creating an entirely new category of monitoring infrastructure requirement as organisations instrument the performance, quality, cost, and safety dimensions of their AI model serving infrastructure in real time, generating new telemetry categories and analysis requirements that existing monitoring platforms are extending to address and new specialist AI observability vendors are positioning to serve.
Restraints: Monitoring tool sprawl and integration complexity, skilled site reliability engineering talent shortage, and data volume growth straining monitoring platform economics
A significant restraint on the Monitoring Tools Market is the tool sprawl problem that has accumulated across enterprise IT organisations that have independently adopted separate monitoring tools for application performance, infrastructure, network, security, log management, and end-user experience without a coherent observability strategy, creating a monitoring landscape of incompatible data models, siloed analysis environments, and redundant telemetry collection that consumes disproportionate operational budget and engineering attention relative to the monitoring value it delivers. The global shortage of site reliability engineering and DevOps talent creates a workforce constraint that limits organisations’ ability to fully implement, optimise, and operationalise the advanced monitoring and observability capabilities that modern platforms provide, as the engineering expertise needed to instrument complex distributed systems comprehensively, configure machine learning-based anomaly detection effectively, and establish the engineering culture of ownership around system observability is scarce and expensive in every major technology talent market.
Opportunities: Generative AI observability creating new monitoring category, SME market expansion through SaaS consumption pricing, and security observability convergence creating unified threat and performance monitoring platform opportunities
The convergence of security monitoring and IT performance observability into unified platforms that correlate technical performance telemetry with security event data in real time represents one of the most commercially significant platform expansion opportunities in the monitoring market, as organisations recognise that the same telemetry infrastructure that monitors application performance and infrastructure health also contains the data signals needed for security threat detection, anomaly identification, and incident forensics, creating compelling economic and operational arguments for security and operations teams to share a common observability data platform rather than maintaining separate security information and event management and IT operations monitoring infrastructure. The SME market expansion opportunity enabled by consumption-based SaaS monitoring pricing is creating the conditions for the monitoring tool market’s total addressable market to expand dramatically beyond its historical large enterprise concentration, as tens of millions of small and medium businesses with cloud-hosted applications and infrastructure recognise that monitoring investment that was previously economically inaccessible is now available at price points that fit their operational budgets while delivering meaningful protection for the digital business capabilities on which their revenue increasingly depends.
Recent Developments:
-
2025: Dynatrace expanded its AI-powered monitoring platform with new cloud-native and hybrid infrastructure monitoring capabilities, enabling enterprises to leverage Davis AI for real-time performance analytics, automated root cause analysis, and integrated security observability across their full IT environment stack spanning cloud, on-premises, and edge deployments.
-
2025: Dynatrace introduced platform innovations at its Perform event, demonstrating AI-enhanced insight generation, predictive performance management, and business resilience features that extend the platform’s observability capabilities from infrastructure and application monitoring into business outcome monitoring with direct revenue and customer experience impact correlation.
-
2025: Datadog released a major platform update at its DASH 2025 conference, expanding infrastructure and cloud network monitoring capabilities, introducing LLM workload observability features for generative AI application monitoring, and delivering deeper telemetry integration for hybrid and multi-cloud environment performance management across enterprise customer deployments.
Monitoring Tools Market Key Players are:
-
Cisco Systems, Inc. (AppDynamics)
-
Dynatrace, Inc.
-
Datadog, Inc.
-
Splunk Inc.
-
New Relic, Inc.
-
NETSCOUT Systems, Inc.
-
Elastic N.V.
-
Broadcom Inc.
-
PagerDuty, Inc.
-
LogicMonitor, Inc.
-
IBM Corporation
-
Microsoft Corporation (Azure Monitor)
-
Amazon Web Services (CloudWatch)
-
Google Cloud (Cloud Operations Suite)
-
SolarWinds Corporation
-
Zabbix LLC
-
Nagios Enterprises
-
Prometheus / Grafana Labs
-
Sumo Logic
-
Honeycomb.io
Monitoring Tools Market Report Scope:
| Report Attributes | Details |
|---|---|
| Market Size in 2025 | USD 33.11 Billion |
| Market Size by 2035 | USD 182.97 Billion |
| CAGR | CAGR of 18.37% From 2026 to 2035 |
| Base Year | 2025 |
| Forecast Period | 2026-2035 |
| Historical Data | 2022-2024 |
| Report Scope & Coverage | Market Size, Segments Analysis, Competitive Landscape, Regional Analysis, DROC & SWOT Analysis, Forecast Outlook |
| Key Segments | • By Component (Solutions, Services) • By Deployment (Cloud-Based, On-Premises) • By Enterprise Size (Large Enterprises, Small & Medium Enterprises) • By End-User (IT & Telecom, BFSI, Healthcare, Manufacturing, Government, Retail, Others) |
| Regional Analysis/Coverage | North America (US, Canada), Europe (Germany, UK, France, Italy, Spain, Russia, Poland, Rest of Europe), Asia Pacific (China, India, Japan, South Korea, Australia, ASEAN Countries, Rest of Asia Pacific), Middle East & Africa (UAE, Saudi Arabia, Qatar, South Africa, Rest of Middle East & Africa), Latin America (Brazil, Argentina, Mexico, Colombia, Rest of Latin America). |
| Company Profiles | Cisco Systems, Inc. (AppDynamics), Dynatrace, Inc., Datadog, Inc., Splunk Inc., New Relic, Inc., NETSCOUT Systems, Inc., Elastic N.V., Broadcom Inc., PagerDuty, Inc., LogicMonitor, Inc., IBM Corporation, Microsoft Corporation (Azure Monitor), Amazon Web Services (CloudWatch), Google Cloud (Cloud Operations Suite), SolarWinds Corporation, Zabbix LLC, Nagios Enterprises, Prometheus / Grafana Labs, Sumo Logic, and Honeycomb.io. |
Frequently Asked Questions
North America dominated the Monitoring Tools Market in 2025, with the United States as the leading national market within the region.
Solutions dominated with approximately 76.5% revenue share in 2025.
The rapid enterprise adoption of AI-powered observability platforms driven by the inadequacy of legacy monitoring tools for cloud-native distributed application environments, combined with the growing business criticality of digital platforms that makes monitoring investment a direct revenue protection priority and the SaaS delivery model democratising access to enterprise-grade monitoring capabilities across organisations of all sizes.
The Monitoring Tools Market was valued at USD 33.11 Billion in 2025.
The Monitoring Tools Market is expected to grow at a CAGR of 18.37% from 2026 to 2035.
Get in Touch
