Network Security Sandbox Market Size & Overview:
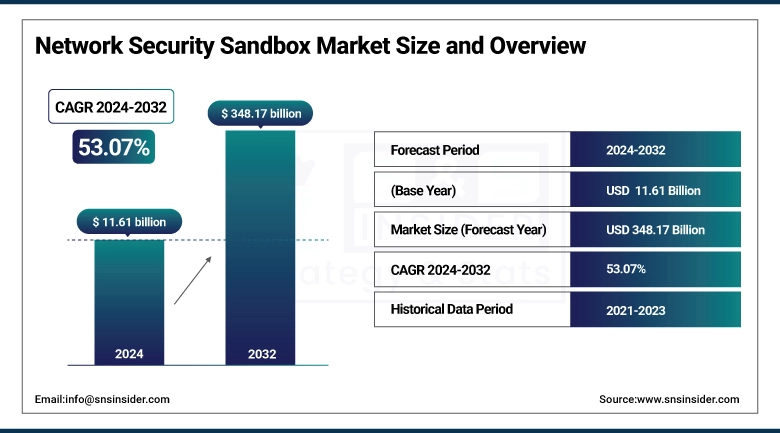
The Network Security Sandbox Market size was worth USD 11.61 billion in 2024 and is predicted to reach USD 348.17 billion by 2032, expanding at a CAGR of 53.07% over 2025-2032.
The Network Security Sandbox Market growth is rising owing to the surging cyber threats, accelerating cloud and IoT adoption, and stringent regulatory requirements. Organizations are focusing on proactive threat detection and malware quarantine in secure environments and thus have a higher requirement for sandbox solutions for overall network security enhancement and protecting sensitive data.
According to research, 67% of companies are relocating applications to the cloud, and 90% affirm that adoption of AI is prompted by cloud transition. Meanwhile, Europe saw a 57% hike in ransomware attacks on small and medium-sized businesses in 2023, reflecting the growing need for sophisticated cybersecurity solutions, such as network security sandboxes.
To Get more information on Network Security Sandbox Market - Request Free Sample Report
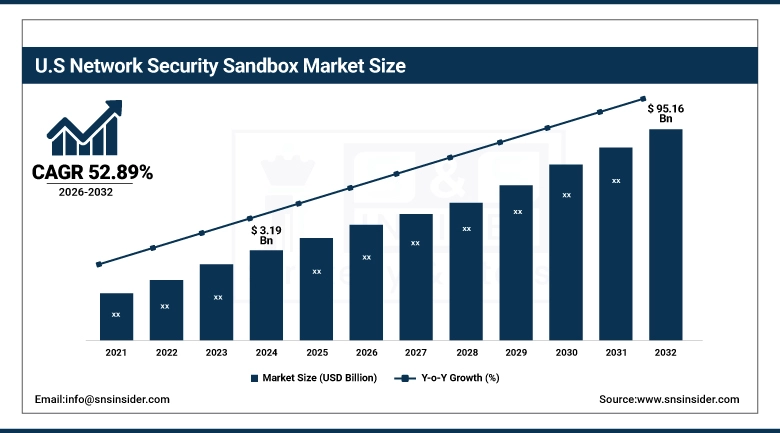
The U.S. Network Security Sandbox Market was valued at USD 3.19 billion in 2024 and is expected to reach USD 95.16 billion by 2032, growing at a CAGR of 52.89% from 2025-2032.
The U.S. Network Security Sandbox Market size is driven by the surging cyberattacks, strict data protection rules, and high cloud usage. The companies are largely investing in sophisticated sandbox technology to identify and tackle advanced threats, for offering strong network security and compliance.
Federal agencies have recorded approximately 10% rise in cyber incidents from fiscal year 2022 to 2023, which reached around 32,211 incidents, according to the Cybersecurity and Infrastructure Security Agency (CISA).
Furthermore, with the U.S. government have spent over USD 15 billion on cybersecurity in 2023 alone, which include amount spent on cloud security, along with the continuous growth expected for efficient sandbox solutions.
Network Security Sandbox Market Dynamics:
Drivers:
-
Growing Cyberattack Sophistication is Compelling Companies to Deploy Advanced Security Layers Including Network Sandboxing Solutions
Malware, zero-day exploits, and ransomware are going ahead of the conventional detection, prompting companies to spend more on sophisticated threat analysis tools. Network security sandboxes provide safe execution and monitoring of suspicious code in sandboxed environments, allowing for concealed threats to be detected early. With cloud computing and IoT devices gaining more and more popularity, the attack surface has grown multifold, multiplying the need for real-time behavior-based threat analysis. The surging complexities and volume of threats are boosting the need of enterprises and government for sandboxing as an active solution for security.
Phishing threats have increased, with 94% of organizations facing attempts at phishing attacks in 2023. This trend indicates the demand for reliable security measures including sandboxing solutions, to secure against such ever-changing threats.
Restraints:
-
Limited Effectiveness Against Encrypted Traffic and Evasion Methods Reduces Sandbox Reliability in Advanced Network Environments
Modern malware is now dependent on encrypted communications and sandbox-aware programming from detection. Encrypted payloads highly hide malicious activities, and several other attacks modify execution patterns when a sandbox environment is identified. This diminishes accuracy and comprehensiveness of threat analysis, resulting in possible false negatives. In addition, attackers are often constantly changing their methodology to avoid being detected through behavioral monitoring, and thus reducing the long-term efficacy of static sandbox technology. These constraints undermine the reliability of sandboxing as an infallible measure and drive organizations to find add-on products for end-to-end threat protection.
Opportunities:
-
Combining Artificial Intelligence and Machine Learning is Boosting the Proficiency and Precision of Sandbox-based Threat Detection
AI and ML technologies are being largely incorporated into sandboxing platforms to detect threats smartly and more adaptively. These technologies allow systems to learn from patterns and behavior further improving previously unknown threats' detection and decreasing false positives. Real-time behavioral analysis using AI offers faster decision-making and automatic response capability. This is not only improving security stance but also inviting businesses to next-generation sandbox solutions. With the growing AI capabilities, new windows of innovation are thrown open, and sandbox platforms become smarter and autonomous threat detection systems.
For instance, Fortinet's FortiSandbox 5.0 employs a sophisticated AI-driven engine with machine learning algorithms specifically designed with unsupervised learning and artificial neural networks. This combination speeds up threat analysis and enhances detection, allowing organizations to address the emerging complexity of cybersecurity challenges today.
Challenges:
-
Advanced Integration with Current Security Infrastructure Generates Deployment Resistance and Operational Silos in the Enterprise Environment
Most organizations possess multi-layered, heterogeneous security environments, making it easy to integrate sandbox tools as an administrative task. Incompatibility between SIEM solutions, intrusion detection systems, and firewalls can result in operational inefficiencies or data gaps. Additionally, non-standard deployments of sandboxes typically equate to fragmented threat intelligence and slow incident response. Firms need to invest time and expertise to ensure consistency across tools, which could delay implementation and affect overall effectiveness. Integration issues including this detract from the allure of sandboxing, particularly within heavily interlinked or legacy environments.
Network Security Sandbox Market Segmentation Analysis:
By Component
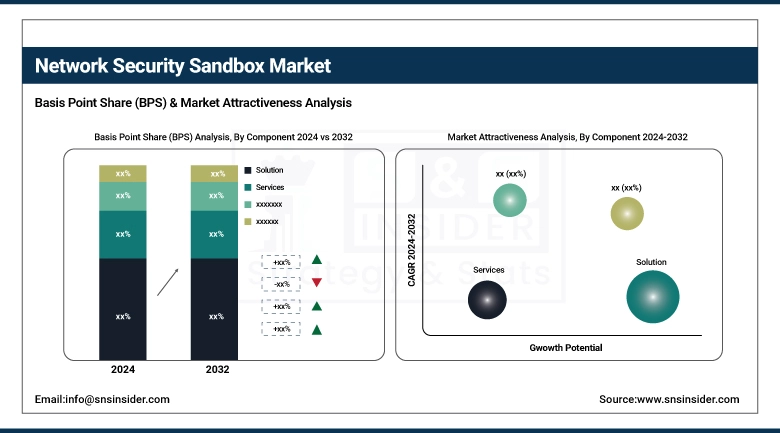
The solution segment led the Network Security Sandbox Market in 2024 with approximately 68% revenue share based on growing enterprise requirements for threat detection platforms. Sandbox solutions are the top priority for organizations to detect sophisticated malware and zero-day threats ahead of time. Demand for real-time, scalable threat intelligence systems supporting existing cybersecurity platforms has encouraged broad adoption of sandbox solutions instead of legacy security tools within industries including finance, healthcare, and telecom.
The services segment will register the fastest growth CAGR of 54.74% during 2025-2032 as a result of growing demand for managed security services and consulting services. With complex sandboxing solutions, organizations look for skilled services for deployment, configuration, monitoring, and threat intelligence. This is further driven by the growing outsourcing trend of cybersecurity operations, especially by mid-sized enterprises and organizations that lack internal security experience.
By Enterprise Size
Large Enterprise maintained the largest revenue market share of around 62% in 2024, driven by their large investments in sophisticated security infrastructure. Larger groups with extensive networks and crucial data at stake are projected to incorporate robust sandboxing technologies to tackle rising threats of cyberattacks. Large organizations, largescale IT spending, and compliance needs also boost the adoption of active and behavior-based threat detection platforms across global business operations.
SMEs are expected to expand with the fastest CAGR of 54.55% from 2025-2032 due to rising cyberattacks on small and mid-sized companies. With rising awareness of sophisticated threats and affordable cloud-based sandbox solutions, SMEs are increasingly investing in sophisticated cybersecurity solutions. Government programs and regulatory demands also prompt upgrading cybersecurity, stimulating demand from smaller companies that have so far been using simple security controls.
By End Use
The BFSI segment led the Network Security Sandbox Market in 2024 with a revenue share of 30% owing to the high exposure of the sector to targeted attacks and compliance requirements. Banks and other financial institutions need intense threat detection to protect confidential information and ensure continuity of operations. Demand for protection against zero-day attacks, along with standards compliance, such as PCI DSS and GDPR, fuels steady investment in sophisticated sandboxing technologies.
The defense sector is anticipated to grow at the fastest CAGR of 55.89% over 2025-2032 due to the increasing cyberwarfare and nation-state attacks. Governments are prioritizing cybersecurity resiliency by using behavior-based threat detection on military and intelligence networks. Defense infrastructure's mission-critical nature requires cutting-edge solutions such as sandboxing to identify and eliminate highly evasive and advanced cyber threats in real-time.
Network Security Sandbox Market Regional Outlook:
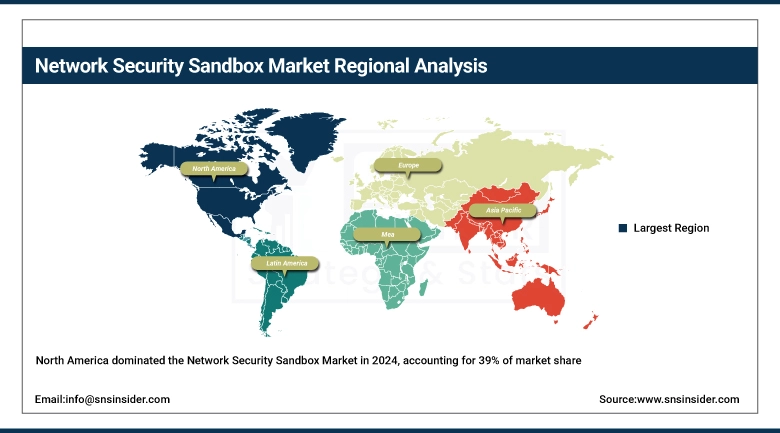
North America led the Network Security Sandbox Market in 2024 with the biggest revenue share of around 39% driven by the availability of advanced cybersecurity infrastructure, stringent government regulations, and high enterprise adoption of advanced security solutions. The strong IT industry present in the region, along with the high rate of research and development investments, further stimulates high demand for sandbox technologies to effectively detect and prevent new cyber threats.
Get Customized Report as per Your Business Requirement - Enquiry Now
The U.S. led the Network Security Sandbox Market owing to the sophisticated cybersecurity infrastructure, enterprise-high adoption, robust regulations, and extensive R&D investments.
Asia Pacific will develop at the fastest CAGR of around 55.56% during 2025-2032 caused by rapid digitalization, growing cyberattacks, and increased network security consciousness in developing economies. Surging internet penetration, boosting cloud computing adoption, and government initiatives to improve cybersecurity infrastructure are drivers of high growth. Moreover, the growing IT sector and rising investments by local and international players drive market growth in this region.
China is leading the Asia Pacific Network Security Sandbox Market because of speedy digitalization, increasing cyber attacks, robust government support, and enormous investment in cyber security technologies.
Europe's Network Security Sandbox Market is accelerated by increasing cyber attacks, stringent data protection laws, and accelerating use of advanced cyber security technologies by all industries that collectively drive persistent growth and investment in security infrastructure.
Germany is leading the European Network Security Sandbox Market because of its strong industry base, high level of cybersecurity adoption, strong regulatory environment, and high technology investments.
The Middle East & Africa and Latin America Network Security Sandbox Market is growing significantly due to the surging number of cyberattacks, growing digital adoption, increasing IT infrastructure, and enhanced consciousness towards cybersecurity solutions among enterprises and government agencies within these regions.
Key Players:
The leading network security sandbox market companies are Cisco DevNet, VMware (Broadcom), Fortinet, Inc., McAfee, LLC, Palo Alto Networks, Trend Micro Incorporated, Forcepoint, Juniper Networks, Inc., Check Point Software Technologies Ltd., Sophos Ltd., Lastline Inc., Symantec Corporation, SonicWall, FireEye, Inc., Blue Coat, Network Security Investigations Inc., VMRay, and Sophos OEM.
Recent Developments:
-
In 2024, Cisco introduced a new sandbox for CDO, allowing users to manage firewall policies and interact with the AI Assistant using natural language.
-
In April 2024, Palo Alto Networks disclosed a critical vulnerability (CVE-2024-3400) in PAN-OS, allowing arbitrary file creation leading to OS command injection. They provided guidance on collecting forensic evidence and verifying Threat Prevention signatures.
-
In October 2024, Juniper announced a new solution integrating security and networking configuration under a common cloud and AI umbrella, aiming to deliver superior visibility and control across network and security domains.
-
In May 2024, the company enhanced its CloudGuard WAF with an API discovery feature, strengthening organizations' cloud assets and earning recognition in GigaOm's Radar for Application and API Security.
| Report Attributes | Details |
|---|---|
| Market Size in 2024 | USD 11.61 Billion |
| Market Size by 2032 | USD 348.17 Billion |
| CAGR | CAGR of 53.07% From 2025 to 2032 |
| Base Year | 2024 |
| Forecast Period | 2025-2032 |
| Historical Data | 2021-2023 |
| Report Scope & Coverage | Market Size, Segments Analysis, Competitive Landscape, Regional Analysis, DROC & SWOT Analysis, Forecast Outlook |
| Key Segments | •By Component(Solution, Services) •By Enterprise Size(SMEs, Large Enterprises) •By End Use(BFSI, IT & Telecom, Retail, Education, Public Sector, Defense, Others) |
| Regional Analysis/Coverage | North America (US, Canada, Mexico), Europe (Germany, France, UK, Italy, Spain, Poland, Turkey, Rest of Europe), Asia Pacific (China, India, Japan, South Korea, Singapore, Australia, Rest of Asia Pacific), Middle East & Africa (UAE, Saudi Arabia, Qatar, South Africa, Rest of Middle East & Africa), Latin America (Brazil, Argentina, Rest of Latin America) |
| Company Profiles | Cisco DevNet, VMware (Broadcom), Fortinet, Inc., McAfee, LLC, Palo Alto Networks, Trend Micro Incorporated, Forcepoint, Juniper Networks, Inc., Check Point Software Technologies Ltd., Sophos Ltd., Lastline Inc., Symantec Corporation, SonicWall, FireEye, Inc., Blue Coat, Network Security Investigations Inc., VMRay, Sophos OEM |
Frequently Asked Questions
North America led the Network Security Sandbox Market in 2024 with a 39% revenue share, driven by advanced cybersecurity infrastructure and strong regulatory frameworks.
The solution segment dominated in 2024, capturing 68% of market revenue due to rising demand for real-time malware detection across industries.
Increasing cyber threats, cloud adoption, and sophisticated attacks like zero-day exploits are driving demand for sandbox-based proactive threat detection solutions.
The global Network Security Sandbox Market was valued at USD 11.61 billion in 2024, reflecting growing enterprise investment in advanced cybersecurity solutions.
The market is expected to grow at a CAGR of 53.07% from 2025 to 2032, reaching USD 348.17 billion by 2032.
Get in Touch
