New Energy Vehicle (NEV) Taxi Market Size & Overview:
Get More Information on New Energy Vehicle Taxi Market - Request Sample Report
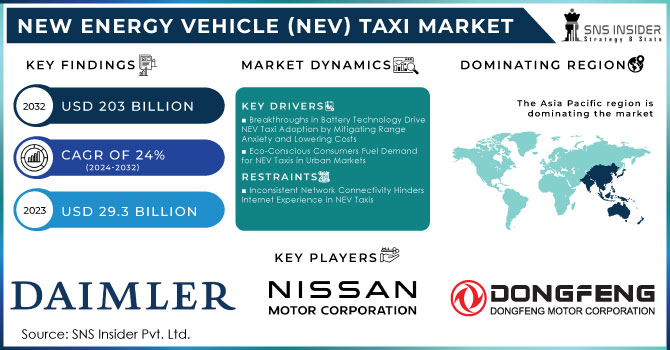
The New Energy Vehicle (NEV) Taxi Market Size was valued at USD 29.3 billion in 2023 and is expected to reach USD 203 billion by 2032 and grow at a CAGR of 24% over the forecast period 2024-2032.
The demand for NEV taxis is surging due to growing eco-consciousness and a push for sustainable transportation. Environmental concerns and dwindling fossil fuels are driving the industry towards electric alternatives like NEVs. These electric taxis boast zero emissions, minimizing their environmental impact. Governments worldwide are enacting stricter regulations to curb greenhouse gasses and promote EVs. The rising need for comfortable, safe, and convenient public transport fuels market growth. NEV taxis offer a reliable and affordable option for passengers, drivers, and fleet owners, while also creating jobs and fostering socioeconomic development. Integration of smart mobility solutions like AI, IoT, and cloud computing is another growth driver. Manufacturers are leveraging these technologies to enhance fleet management, passenger experience, and safety. The increased investments in charging infrastructure expansion are expected to propel market growth. Governments are heavily investing in charging stations to support NEV adoption.
MARKET DYNAMICS:
KEY DRIVERS:
-
Breakthroughs in Battery Technology Drive NEV Taxi Adoption by Mitigating Range Anxiety and Lowering Costs
Battery breakthroughs are fueling the NEV taxi revolution. Advancements in battery chemistry and design, like lithium-ion and solid-state tech, are boosting range and reducing "range anxiety." Faster charging stations also ease concerns, allowing taxis to operate all day without extended downtime. Plus, battery production costs are dropping due to economies of scale and competition. This translates to cheaper electric taxis, making them more competitive with traditional gas-powered vehicles. Government incentives further sweeten the deal for taxi operators.
-
Eco-Conscious Consumers Fuel Demand for NEV Taxis in Urban Markets
RESTRAINTS:
-
Inconsistent Network Connectivity Hinders Internet Experience in NEV Taxis
OPPORTUNITIES:
-
NEV taxis can seamlessly connect with smart traffic management systems and data sharing networks in developing smart cities.
-
Improvements in battery range and charging infrastructure can ease range anxiety and extend NEV taxi operation times.
CHALLENGES:
-
High Upfront Costs of NEV Taxis Hinder Fleet Adoption by Taxi Operators
The high upfront costs of NEV taxis are a major hurdle for taxi companies. Even though electric vehicles boast lower operational costs in the long run, the initial investment to buy them and set up charging stations can be overwhelming. This financial burden often outweighs the capacity of smaller and mid-sized taxi operators, hindering their transition to NEV fleets.
IMPACT OF RUSSIA-UKRAINE WAR
The war in Russia-Ukraine has disrupted the NEV taxi market’s smooth growth. The conflict has hampered the supply chain in the automotive industry, particularly for semiconductors, leading to production delays and a shortage of NEV taxis about 5-10%. This limited supply, coupled with rising fuel prices due to the war, could push potential taxi operators towards holding onto existing gasoline taxis. The sanctions imposed on Russia, a major supplier of key commodities like palladium and neon gas used in chip production, could further inflate costs and hinder NEV taxi production. Thus, the war's emphasis on energy security could accelerate the global shift towards alternative fuels, potentially boosting the demand for eco-friendly NEV taxis in the long run.
IMPACT OF ECONOMIC SLOWDOWN
Economic downturn can slowdown the NEV taxi market. Lower consumer spending means fewer taxi rides overall, potentially leaving NEV taxis empty and hurting profits. Limited government budgets might lead to cuts in subsidies that make NEV taxis more affordable. This could make them less attractive compared to cheaper gasoline taxis, especially considering the higher upfront cost of NEVs. The economic downturns can discourage investment in charging infrastructure, making it less convenient to use NEV taxis. The impact can be substantial. A 20% drop in spending could lead to a similar decrease in taxi demand, and a 30% subsidy cut could increase NEV taxi costs by 5-10% for fleet operators, impacting their buying decisions. However, the slowdown's effect might not be uniform.
KEY MARKET SEGMENTS:
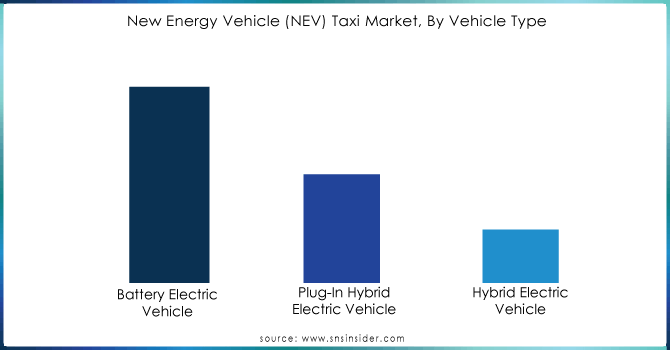
By Vehicle Type
-
Battery Electric Vehicle
-
Plug-In Hybrid Electric Vehicle
-
Hybrid Electric Vehicle
Battery Electric Vehicle is the dominating sub-segment in the new energy vehicle taxi market by vehicle type holding around 60% of market share. BEVs offer the most significant environmental benefits with zero tailpipe emissions. Advancements in battery technology are steadily increasing range, addressing "range anxiety" concerns. Government incentives often favour BEVs, further promoting their adoption.
Get Customized Report as per your Business Requirement - Request For Customized Report
By Range Type
-
Intercity
-
Intracity
Intracity is the dominating sub-segment in the new energy vehicle taxi market by range type holding around 70-80% of market share. NEV taxis primarily operate within cities for shorter trips. Intracity models prioritize movability and efficiency over extended range, making them ideal for urban environments. However, intercity NEV taxis might gain traction in specific regions with adequate charging infrastructure along major routes.
By Vehicle Class
-
Hatchback
-
Sedan
-
Utility Vehicle
Sedan is the dominating sub-segment in the new energy vehicle taxi market by vehicle class holding around 50-60% of market share. Sedans offer a good balance of passenger space, comfort, and efficiency, making them suitable for various taxi needs. Hatchbacks might be preferred by some operators for their lower upfront cost and movability in tight city streets. Utility vehicles could see niche adoption for larger passenger capacity or luggage requirements.
By Ownership Type
-
Company Owned
-
Individually Owned/Private
Company-owned NEV taxis is the dominating sub-segment in the new energy vehicle taxi market by ownership type holding around 50-60% of market share with stricter regulations for driver qualifications, vehicle maintenance, and safety. This ownership structure allows established taxi service providers to ensure compliance and manage large fleets efficiently. Additionally, government subsidies for bulk purchases of NEVs can make company ownership a financially attractive option.
By Vehicle Level
-
Entry & Mid-Level
-
Premium
Entry & Mid-Level is the dominating sub-segment in the new energy vehicle taxi market by vehicle type holding around 70% of market share. To maximize profitability, taxi operators often prioritize affordability. Entry and mid-level NEV taxis offer a good balance of features, performance, and cost compared to premium models. However, some high-end taxi services might utilize premium NEV taxis to cater to a specific client.
REGIONAL ANALYSES
The Asia-Pacific is the dominating region in the New Energy Vehicle Taxi Market, holding 50-70% of market share. This dominance stems from strong government support for EVs, with leading manufacturers like BYD and Tesla residing in China. Additionally, densely populated cities create a massive market for NEV taxis.
Europe is the second highest region in this market with 20-30% share, driven by stringent emission regulations and established electric vehicle charging infrastructure. Consumers are also increasingly opting for sustainable transportation.
North America is the fastest growing region in this market. Rising fuel costs, growing government incentives, and the popularity of ride-hailing services adopting EVs all contribute to this rapid growth.

REGIONAL COVERAGE:
North America
-
US
-
Canada
-
Mexico
Europe
-
Eastern Europe
-
Poland
-
Romania
-
Hungary
-
Turkey
-
Rest of Eastern Europe
-
-
Western Europe
-
Germany
-
France
-
UK
-
Italy
-
Spain
-
Netherlands
-
Switzerland
-
Austria
-
Rest of Western Europe
-
Asia Pacific
-
China
-
India
-
Japan
-
South Korea
-
Vietnam
-
Singapore
-
Australia
-
Rest of Asia Pacific
Middle East & Africa
-
Middle East
-
UAE
-
Egypt
-
Saudi Arabia
-
Qatar
-
Rest of the Middle East
-
-
Africa
-
Nigeria
-
South Africa
-
Rest of Africa
-
Latin America
-
Brazil
-
Argentina
-
Colombia
-
Rest of Latin America
KEY PLAYERS
The major key players are Tesla, Inc., Dongfeng Nissan Passenger Vehicle Company, BYD Company, Daimler AG, Nissan Motor Corporation, Jianghuai Automobile Co Ltd (JAC), Toyota Motor Corporation, Amazon (Washington), Changan Automobile Co. Ltd, Lyft Inc., Beijing Automotive, Anhui, Uber Technologies, Industry Holding Co. Ltd. (BAIC), Beiqi Foton Motor Co. Ltd and other key players.
RECENT DEVELOPMENTS:
-
In October 2023: BYD India, a major electric vehicle maker, has partnered with OHM e-Logistics, an electric cab service with cargo and fleet management expertise. Together, they will deliver 300 electric taxis across India in the next six months.
| Report Attributes | Details |
|---|---|
| Market Size in 2023 | US$ 29.3 Billion |
| Market Size by 2032 | US$ 203 Billion |
| CAGR | CAGR of 24% From 2024 to 2032 |
| Base Year | 2023 |
| Forecast Period | 2024-2032 |
| Historical Data | 2020-2022 |
| Report Scope & Coverage | Market Size, Segments Analysis, Competitive Landscape, Regional Analysis, DROC & SWOT Analysis, Forecast Outlook |
| Key Segments | • By Vehicle Type (Battery Electric Vehicle, Plug-In Hybrid Electric Vehicle, Hybrid Electric Vehicle) • By Range Type (Intercity, Intracity) • By Vehicle Class (Hatchback, Sedan, Utility Vehicle) • By Ownership Type (Company Owned, Individually Owned/Private) • By Vehicle Level (Entry & Mid-Level, Premium) |
| Regional Analysis/Coverage | North America (US, Canada, Mexico), Europe (Eastern Europe [Poland, Romania, Hungary, Turkey, Rest of Eastern Europe] Western Europe] Germany, France, UK, Italy, Spain, Netherlands, Switzerland, Austria, Rest of Western Europe]), Asia Pacific (China, India, Japan, South Korea, Vietnam, Singapore, Australia, Rest of Asia Pacific), Middle East & Africa (Middle East [UAE, Egypt, Saudi Arabia, Qatar, Rest of Middle East], Africa [Nigeria, South Africa, Rest of Africa], Latin America (Brazil, Argentina, Colombia, Rest of Latin America) |
| Company Profiles | Tesla, Inc., Dongfeng Nissan Passenger Vehicle Company, BYD Company, Daimler AG, Nissan Motor Corporation, Jianghuai Automobile Co Ltd (JAC), Toyota Motor Corporation, Amazon (Washington), Changan Automobile Co. Ltd, Lyft Inc., Beijing Automotive, Anhui, Uber Technologies, Industry Holding Co. Ltd. (BAIC), Beiqi Foton Motor Co. Ltd |
| Key Drivers | • Breakthroughs in Battery Technology Drive NEV Taxi Adoption by Mitigating Range Anxiety and Lowering Costs • Eco-Conscious Consumers Fuel Demand for NEV Taxis in Urban Markets |
| RESTRAINTS | • Inconsistent Network Connectivity Hinders Internet Experience in NEV Taxis |
Frequently Asked Questions
Ans: Environmental concerns, government incentives, and falling battery costs are driving growth.
Ans: Asia-Pacific is the leading region.
Ans: Battery Electric Vehicles are the dominant electric vehicle type.
Ans: The New Energy Vehicle Taxi Market was valued at USD 29.3 billion in 2023.
Ans: The expected CAGR of the global New Energy Vehicle Taxi Market during the forecast period is 24%.
Get in Touch
