Noise Monitoring Devices Market Report Scope & Overview:
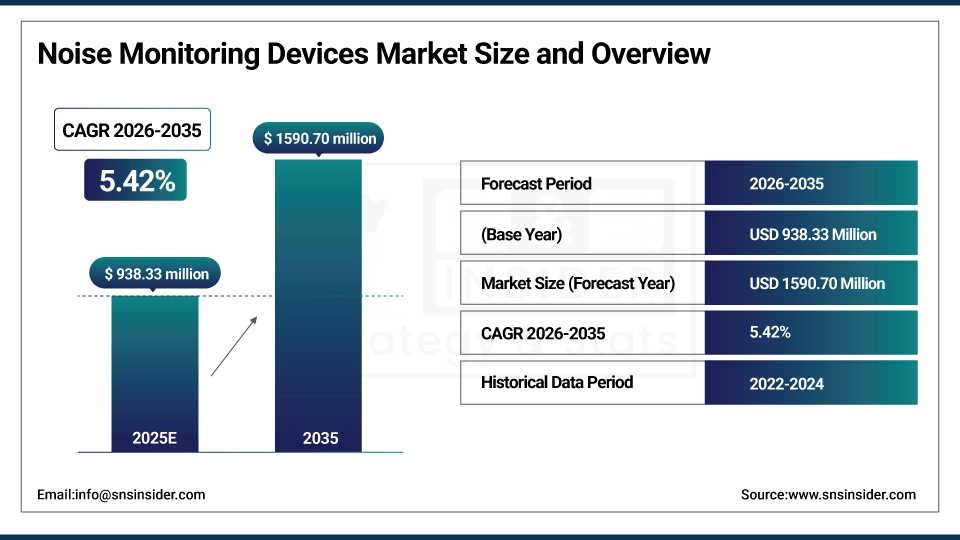
The Noise Monitoring Devices Market was valued at USD 938.33 million in 2025 and is expected to reach USD 1590.70 million by 2035, growing at a CAGR of 5.42% from 2026-2035.
The rising awareness on noise pollution, and the adverse effects of noise on health and environment, is driving the growth of the noise monitoring devices market. The rising urbanization, industrialization, and transportation network is fuelling the demand for precise noise monitoring within cities, airports, railways, and industrial areas. Government regulations along with persistent need for environmental standards are prompting the businesses and municipalities to go for advanced monitoring solutions. IoT-based, real-time, wireless technological innovations in noise monitoring devices are also increasing efficiency and precision of data.
Noise Monitoring Devices Market Size and Forecast
-
Market Size in 2025: USD 938.33 Million
-
Market Size by 2035: USD 1590.70 Million
-
CAGR: 5.42% from 2026 to 2035
-
Base Year: 2025
-
Forecast Period: 2026–2035
-
Historical Data: 2022–2024
To Get more information on Noise Monitoring Devices Market - Request Free Sample Report
Noise Monitoring Devices Market Trends
-
Rising environmental regulations and workplace safety standards are driving the noise monitoring devices market.
-
Growing adoption across manufacturing, construction, transportation, and urban planning sectors is boosting market growth.
-
Expansion of smart cities and industrial IoT initiatives is fueling deployment.
-
Increasing focus on real-time monitoring, data logging, and compliance reporting is shaping adoption trends.
-
Advancements in acoustic sensors, wireless connectivity, and AI-based analytics are enhancing accuracy and efficiency.
-
Rising awareness of noise pollution impacts on health and productivity is supporting market expansion.
-
Collaborations between device manufacturers, regulatory bodies, and environmental agencies are accelerating innovation and global adoption.
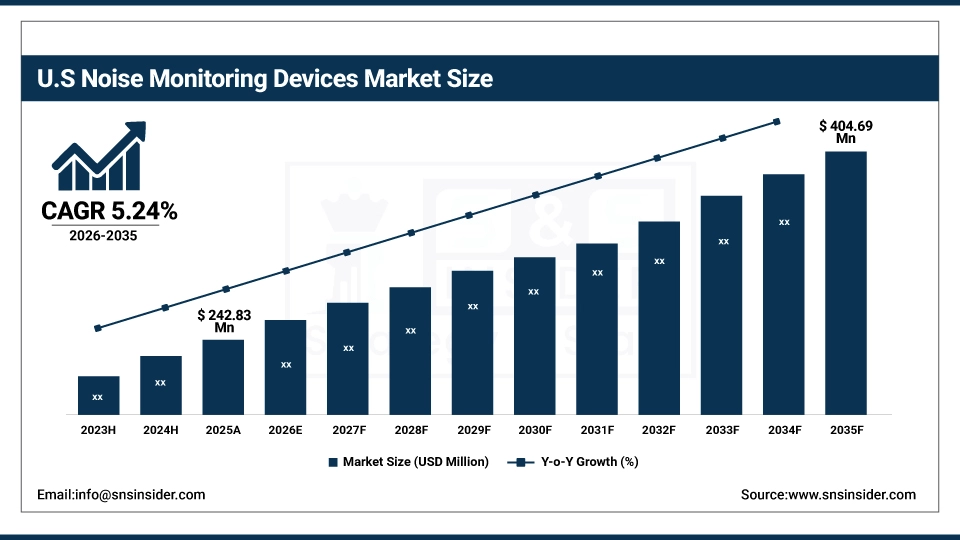
U.S. Noise Monitoring Devices Market was valued at USD 242.83 million in 2025 and is expected to reach USD 404.69 million by 2035, growing at a CAGR of 5.24% from 2026-2035.
The U.S. Noise Monitoring Devices Market is growing due to rising urbanization, strict environmental regulations, and increasing awareness of noise pollution’s health impacts. Adoption of smart city initiatives and advanced IoT-enabled monitoring solutions further drives demand across industrial and public sectors.
Noise Monitoring Devices Market Growth Drivers:
-
Stringent global regulations on environmental noise levels are driving extensive adoption of advanced noise monitoring devices across diverse industries
As global regulation to reduce noise pollution heightens, industries, transport hubs and city infrastructure developers are forced to add noise monitoring devices for effective noise control. Because of the unyielding compliance guidelines that apply particularly to construction sites, airport, rail road and industrial plants, governments and environmental regulatory agencies encode these measures as never before. That implies endless, beat by beat, detection, and reporting up to the second, for no penalties, and a populace covered by safety. IoT based noise detection systems enable logging of data, predictive analysis and automatic alerts.
Additionally, the World Health Organization (WHO) Environmental Noise Guidelines provide recommendations for protecting human health from exposure to environmental noise from transportation, industrial, and other sources, serving as a framework for national policies and regulatory compliance
Noise Monitoring Devices Market Restraints:
-
Technical complexity and need for skilled personnel to operate noise monitoring systems hinder widespread implementation across certain market segments
High-end noise monitoring technology can regularly need trained personnel for installation, configuration, calibration, and data interpretation. One of the issues with smaller organizations and public sector bodies is that they may not have sufficient technical skills and therefore, installed systems maybe not make best use of them. Also, incorporating these devices into current facility management or environmental monitoring systems can be complex, especially when there are no trained personnel. Poor maintenance which may lead to non-functional devices that provide inaccurate readings or cause unnecessary downtime can seriously undermine compliance initiatives. This in turn leads to high adoption time as continuous technical support and specialized training is needed to use such technology, which is not easily available in most regions and industries where access to skilled workforce resources is limited.
Noise Monitoring Devices Market Opportunities:
-
Integration of IoT and AI technologies in noise monitoring devices opens avenues for real-time analytics and predictive environmental management
Noise monitoring system powered by IoT and AI offers a major growth opportunity with improved real time analytics, predictive capabilities, and remote accessibility. These technologies allow constant capturing of noise data and automated anomaly detection and prediction to make decisions early on. Noise monitoring can be easily integrated through other environmental management platforms that industries may be using to achieve an optimally efficient operational climate, along with compliance assurance mechanism. AI Contribution in Environmental MonitoringOver the past few decades the AI-based solutions for the environmental monitoring for the smart city projects, mega infrastructure development are getting initiated and integrated.
For instance, the City of Mesa, Arizona, under its Smart City initiatives, leverages data-driven insights to improve citizen quality of life, employing IoT technologies across transportation and infrastructure. Mesa has deployed over 1,500 IoT-connected devices citywide to monitor environmental parameters, traffic, and noise levels, enhancing operational efficiency and community engagement
Noise Monitoring Devices Market Segment Analysis
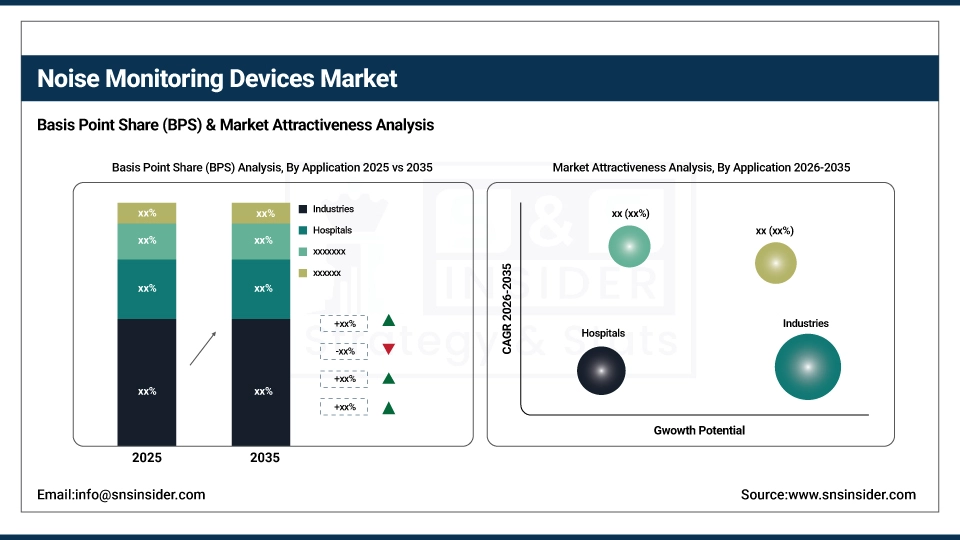
By Application
Industries segment dominated the market with a 27% share in 2025 owing to strict regulation on noise in the working environment, high levels of occupational safety and mandates for compliance in manufacturing and heavy industrial environment. Noise in industrial environments needs monitoring for both the protection of employees from hearing loss along with the need to ensure that legal noise exposure levels are not being exceeded, which can result in penalties. Strong, continuous demand for noise monitoring solutions from oil & gas, mining, automotive and chemical industries.
Residential Areas segment is forecast to grow at the fastest CAGR of about 8.42% from 2026–2035 due to increasing urbanization, smart city development and growing noise-related health concerns. Municipalities and housing developers are turning to monitoring systems to monitor community well-being, complaints, and environmental standards. Low-cost, small and connected noise meters are pushing uptake around the world in apartments, gated communities, and mixed-use urban developments.
By Component
Hardware segment held the largest revenue share of about 73% in 2025 as it plays a vital part in making sure accurate calibration in noise measurement as well as compliance reporting. This led to its dominance due to the high adoption of advanced sound level meters, fixed monitoring stations, and portable devices in numerous industries, construction sites, and urban infrastructure projects. The innovative hardware which offers high durability, reliability, and integration further established its dominance in noise monitoring devices market.
Software segment is projected to grow at the fastest CAGR of about 7.06% from 2026–2035 owing to the growing demand for cloud-based analytics, real-time data visualization, and remote device management. The adoption is further fueled by developments in AI–based recognition of noise patterns, predictive modelling, and automated compliance. Software offers better decision-making capabilities, easy connectivity to IoT platforms and affordable solutions for monitoring, hence, leading to rapid growth of the market, especially in smart city and industrial applications.
By Type of Noise
Class 1 Standard 51 segment accounted for the largest share of about 62% in 2025 as it offers greater accuracy and meets strict noise assessment standards globally. This method is used extensively in legal, environmental, and industrial compliance evaluation where there is ground truth needed high accuracy is required. While Class 1 devices remain the professional standard, offering the verified, court-admissible data desired by industries, airports and municipalities worldwide, they will also maintain their market share as the workhorse of choice for such applications.
Class 2 Standard 52 segment is expected to register the fastest CAGR of about 6.60% from 2026–2035 owing to its affordability and is more preferential for general-purpose noise measurements. Provides good enough accuracy to monitor community noise, use in educational environments, and for non-critical industry applications. The most commonly seen sound monitoring devices in most residential projects, small businesses, and developing markets are likely fuelling the demand due to the low cost nature of these devices when compared to other proximity sound monitoring setups.
By Connectivity
Ethernet-based segment led the market with a 32% share in 2025 as the technology is reliable, provides high-speed data transfer, which makes it the most widely used in permanent monitoring installations. Ethernet is favored in industries, airports, and municipal authorities for continuous data transmission without signal loss. The ability to integrate it with advanced analytics platforms and the need for the least maintenance make it perfect for mission-critical noise monitoring operations that require seamless operations.
Cellular-based segment is projected to grow at the fastest CAGR of about 6.92% from 2026–2035 due to its flexibility, remote access, and ease of use at diverse deployment locations. This is also much more accessible as there is no requirement for fixed network infrastructure so it is perfect for temporary projects, mobile monitoring, hard to reach places etc. The proliferation of 4G/5G networks, plus cloud-based platform integration, is also lifting demand for it in environmental, industrial and municipal usages.
Noise Monitoring Devices Market Regional Analysis
North America Noise Monitoring Devices Market Insights
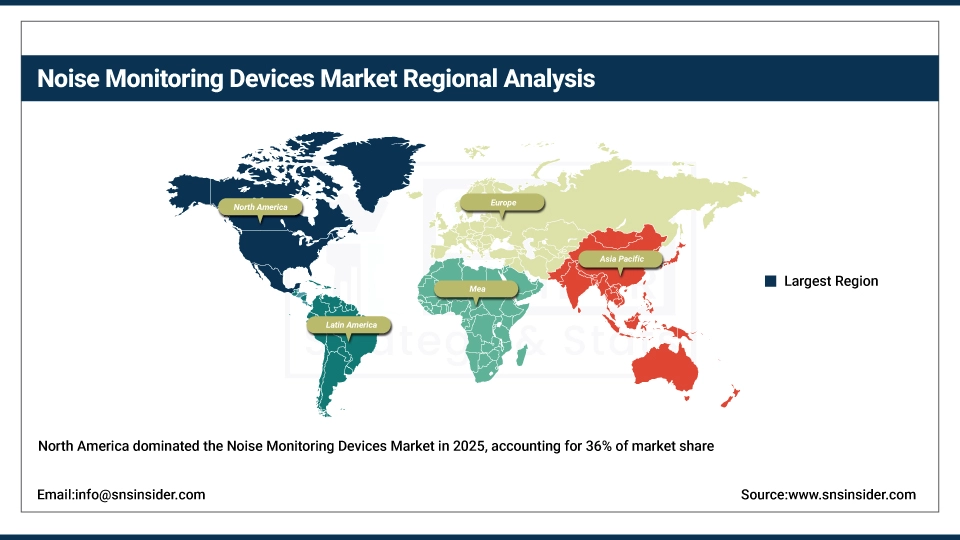
North America accounted for the largest share of about 36% in 2025 owing to rigid environmental noise regulations, high level of industrial safety standards, and advanced monitoring infrastructure. The demand has been driven by adoption across industries, transportation hubs, and urban projects, alongside strong government enforcement. The region further cement its leadership owing to better technological advancements, high awareness level toward health impacts of noise pollution, and massive investment in smart city initiatives.
Get Customized Report as per Your Business Requirement - Enquiry Now
Asia Pacific Noise Monitoring Devices Market Insights
Asia Pacific is projected to grow at the fastest CAGR of about 7.52% from 2026–2035 owing to rapid urbanization, large-scale infrastructure development, and high industrial activities. The increasing awareness level toward the health effects of noise pollution, along with strict regulatory frameworks, is driving the growth of the market. Wide adoption of noise monitoring devices across developed as well as developing countries in the region are driven by expanding smart city programs, increasing manufacturing sectors, and affordability of technology.
Europe Noise Monitoring Devices Market Insights
Europe holds a strong position in the noise monitoring devices market due to strict environmental regulations, developed industrial infrastructure, and the growing adoption of noise monitoring devices in construction, transportation, and urban planning as awareness of the potential health impacts of noise and sustainability initiatives further drive the use of noise monitoring devices in Europe.
Middle East & Africa and Latin America Noise Monitoring Devices Market Insights
Middle East & Africa show steady growth in the noise monitoring devices market, driven by urban expansion, infrastructure projects, and rising environmental awareness, while Latin America benefits from increasing regulatory measures, industrial activities, and adoption of smart monitoring technologies in urban areas.
Noise Monitoring Devices Market Competitive Landscape:
Brüel & Kjær
Brüel&Kjær (B&K), the global leader in sound & vibration measurement solutions, has delivered cutting edge precision instruments, software and integrated systems for environmental, industrial and laboratory applications. The company provides noise and vibration data acquisition, analysis and monitoring in a single or multiple sectors in order to ensure compliance with regulations, occupational safety and product testing. B&K enables engineers and environmental professionals around the world with hardware-software integration, automated calibration, and intuitive interfaces that facilitate efficient workflows, accurate measurements, and actionable insights.
-
2025: Brüel & Kjær launched the Type 2245 sound level meter, offering accurate noise measurement, automatic calibration, and intuitive operation for efficient environmental monitoring workflows.
-
2025: The LAN‑XI Open API enables flexible integration of noise and vibration data acquisition hardware with any software ecosystem for seamless monitoring and analytics.
Pulsar Instruments
Pulsar Instruments specialize in manufacturing high quality environmental noise and occupational measurement solutions, sound level meters, dosimeters and analysers Their commitment to precision and dependability, along with its innovative, real-time data collection tool are contributing to workplace safety, environmental monitoring and regulatory compliance. Pulsar integrates state-of-the-art technology for noise analysis, reporting and visualization in the field and laboratory workflows. Pulsar delivers high quality & accessible noise measurement solutions for your industries around the world, with robust devices and global distribution support.
-
2024: Pulsar Instruments launched the Pulsar Nova Pro Environmental Noise Analyser, delivering comprehensive, accurate real-time noise measurements for environmental and occupational applications.
-
2023: Pulsar expanded its global network with two new authorised distributors in the Middle East, enhancing deployment of noise measurement solutions.
Cirrus Research Plc
Cirrus Research Plc, Britain, will provide sound measurement instruments, software, and integrated solutions for industrial, environmental and motorsport applications. In its products, emphasis is given to accurate, real-time monitoring, data logging, and analysis of noise and vibration. With CirrusAll, the focus is on ease of use, customize-able reporting, and powerful capabilities such as open APIs, mobile access, and specialized modes for specific applications. Combining hardware reliability with the versatility of software integration, Cirrus aids compliance, safety and efficiency in professional noise and vibration assessment around the globe.
-
2023: Cirrus Research launched Quantum 2.3, introducing Motorsport Track Mode, open API for real-time noise/weather/vibration data, dark mode, browser interface, audio playback, and customizable notifications.
Key Players
Some of the Noise Monitoring Devices Market Companies
-
Brüel & Kjaer
-
3M Communications
-
SINUS Messtechnik GmbH
-
Honeywell International Inc.
-
Casella Inc.
-
FLIR Systems
-
RION Co. Ltd.
-
CESVA INSTRUMENTS SLU
-
ACOEM Group
-
Pulsar Instruments
-
SKF Group
-
PCE Instruments
-
Cirrus Research Plc
-
NTi Audio
-
Larson Davis
-
Svantek
-
KIMO
-
TSI Incorporated
-
Envirosuite
-
Sonitus Systems
| Report Attributes | Details |
|---|---|
| Market Size in 2025 | USD 938.33 Million |
| Market Size by 2035 | USD 1590.70 Million |
| CAGR | CAGR of 5.42% From 2026 to 2035 |
| Base Year | 2025 |
| Forecast Period | 2026-2035 |
| Historical Data | 2022-2024 |
| Report Scope & Coverage | Market Size, Segments Analysis, Competitive Landscape, Regional Analysis, DROC & SWOT Analysis, Forecast Outlook |
| Key Segments | • By Vertical Application(Railways, Airports, Recreational Areas, Industries, Hospitals, Residential Areas, Others) • By Component(Hardware, Software) • By Connectivity(Ethernet-based, Wi-Fi 55-based, USB Cable-based, Cellular-based) • By Type of Noise(Class 1 Standard 51, Class 2 Standard 52) |
| Regional Analysis/Coverage | North America (US, Canada), Europe (Germany, UK, France, Italy, Spain, Russia, Poland, Rest of Europe), Asia Pacific (China, India, Japan, South Korea, Australia, ASEAN Countries, Rest of Asia Pacific), Middle East & Africa (UAE, Saudi Arabia, Qatar, South Africa, Rest of Middle East & Africa), Latin America (Brazil, Argentina, Mexico, Colombia, Rest of Latin America). |
| Company Profiles | Brüel & Kjaer, 3M Communications, SINUS Messtechnik GmbH, Honeywell International Inc., Casella Inc., FLIR Systems, RION Co. Ltd., CESVA INSTRUMENTS SLU, ACOEM Group, Pulsar Instruments, SKF Group, PCE Instruments, Cirrus Research Plc, NTi Audio, Larson Davis, Svantek, KIMO, TSI Incorporated, Envirosuite, Sonitus Systems |
Frequently Asked Questions
North America dominated the market in 2025 with a 36% share, supported by strict regulations, advanced infrastructure, and widespread adoption across industries.
The Class 1 Standard 51 segment dominated the market with 62% share in 2025 due to high precision, regulatory compliance, and professional-grade applications.
Stringent global noise regulations, rising urbanization, and increased awareness of noise-related health impacts are the primary drivers of the Noise Monitoring Devices Market growth.
The Noise Monitoring Devices Market was valued at USD 938.33 million in 2025, with strong demand from industries, transportation hubs, and smart city projects worldwide.
The Noise Monitoring Devices Market is projected to grow at a CAGR of 5.42% from 2026 to 2035, driven by rising urbanization and stricter noise regulations.
Get in Touch
