OLED Market Key Insights:
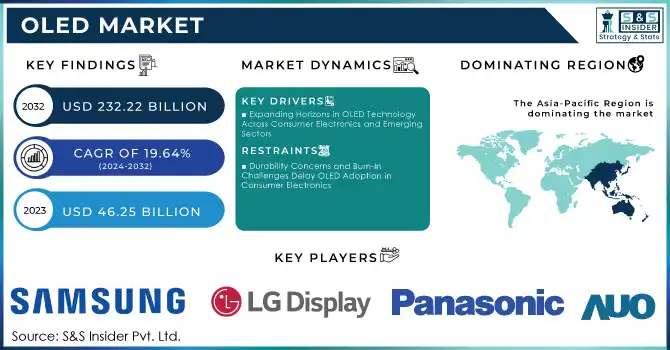
The OLED Market Size was valued at USD 46.25 Billion in 2023 and is expected to grow to USD 232.22 Billion by 2032 and grow at a CAGR of 19.64% over the forecast period of 2024-2032.
Get E-PDF Sample Report on OLED Market - Request Sample Report
The OLED (Organic Light Emitting Diode) market is experiencing remarkable growth, driven by advancements in display technologies and their expanding applications across various sectors. Innovations like stretchable OLEDs and wireless transparent OLEDs are broadening their use in industries ranging from automotive displays to smart textiles. LG's introduction of a wireless transparent OLED, recognized as one of TIME's Best Inventions of 2024, highlights the continued evolution in OLED technology. In the consumer electronics sector, OLEDs have become increasingly popular due to their superior contrast ratios, color accuracy, and energy efficiency, making them the preferred choice for high-end televisions and devices. This has led to significant price reductions in OLED TVs, such as the 77-inch Samsung S84D Series 4K OLED TV, which has seen discounts as high as USD 1,500, reducing its price from USD 3,300 to USD 1,800, making OLED technology more accessible.
This has further fueled the OLED sector's growth, as these companies advance the necessary driver technologies. Additionally, China's OLED smartphone display market now accounts for over half of the global market share, reinforcing the widespread adoption of OLED across consumer electronics. The automotive sector is also benefiting from OLED innovation, with LTPS LCD technology expected to surge from a 5% market share to over 50% in automotive displays. The integration of OLED in electric vehicles (EVs) is another major factor driving the market, as these displays enhance the design and functionality of automotive interiors. With miniaturization and AI integration further propelling OLED's use in wearable devices and IoT products, the future outlook for the OLED market remains strong, poised for continued growth across multiple industries.
OLED Market Dynamics
Drivers
-
Expanding Horizons in OLED Technology Across Consumer Electronics and Emerging Sectors
The OLED market is experiencing remarkable growth, driven by consumer demand for high-quality display technology in a range of consumer electronics such as TVs, smartphones, and laptops. OLED displays are gaining popularity due to their exceptional picture quality, delivering deep blacks, vibrant colors, and energy efficiency, surpassing traditional LED screens. This trend is especially evident in the television sector, with OLED TVs becoming the preferred choice for many consumers seeking premium viewing experiences. According to recent data, OLED TV panel shipments are set to grow by 22% in 2024, reaching 6.48 million units, up from 5.3 million in 2023, with major brands like LG, Samsung, and Sony leading the charge. In addition to televisions, OLED technology is expanding into other devices such as smartphones, laptops, and wearables. Apple’s recent release of the OLED-equipped iPad Pro showcases the growing adoption of OLED in mobile tech. However, the transition to OLED is not without hurdles. For instance, Apple has delayed the release of an OLED MacBook Air due to the high costs and supply chain challenges involved, indicating that pricing remains a crucial factor in broader OLED adoption. Despite these challenges, continuous improvements in OLED manufacturing processes and cost reductions are expected to boost the technology’s accessibility and drive further market penetration in the coming years, expanding its reach across both consumer and emerging tech sectors like automotive displays.
Restraints
-
Durability Concerns and Burn-In Challenges Delay OLED Adoption in Consumer Electronics
One significant restraint in the OLED market is the durability issue, particularly the susceptibility of OLED displays. This occurs when static images remain on the screen for prolonged periods, causing permanent damage to specific areas of the display. Burn-in can significantly impact the user experience, especially for applications involving static content such as digital signage or devices with fixed user interfaces like laptops and smartphones. Although OLED technology offers excellent contrast, deeper blacks, and vibrant colors, its potential for burn-in limits its adoption in certain consumer electronics. For instance, the OLED MacBook Air, originally expected to launch in 2024, has been delayed, partly due to concerns about the durability of OLED panels and their ability to withstand long-term usage in such devices concern has led some manufacturers to delay the rollout of OLED products. For example, Apple is reportedly pushing back the release of its OLED MacBook Air beyond 2027, with high costs and technical challenges, including burn-in, playing a part in the decision. The delay signals that while there is growing interest in OLED technology across various sectors, manufacturers remain cautious about its long-term viability in high-end and everyday-use devices.
OLED Market Segment Analysis
By Product
In 2023, the OLED display segment led the OLED market, capturing around 74% of total market revenue. OLED displays are widely used in smartphones, smart TVs, laptops, wearable devices, and automotive displays due to their superior advantages over LCD and LED technologies. These benefits include higher contrast ratios, faster response times, thinner profiles, and better power efficiency.
Key factors driving the growth of the OLED display market include strong demand in consumer electronics, especially in high-end smartphones like those from Apple and Samsung, as well as in the premium smart TV segment. Additionally, OLED displays are becoming increasingly popular in the automotive industry for digital dashboards and in-car entertainment systems. The wearable device market, including smartwatches and fitness trackers, also drives demand. However, challenges like high production costs and shorter lifespan due to material degradation may limit widespread adoption in lower-cost devices.
By Technology
In 2023, AMOLED (Active Matrix Organic Light Emitting Diode) technology dominated the OLED market, capturing approximately 80% of the revenue share. AMOLED displays stand out for their superior image quality, offering vibrant colors, deep blacks, and high contrast ratios, making them ideal for premium smartphones, tablets, and smart TVs. The ability to control each pixel individually enhances the display’s performance, especially for high-resolution devices. Additionally, AMOLED screens are energy-efficient, consuming less power than LCD displays, particularly when showing darker content, which is a key advantage for smartphones and wearables where battery life is essential. The technology also supports flexible display, curved, and bendable displays, enabling innovations like foldable smartphones and compact wearables. Major manufacturers like Apple and Samsung have widely adopted AMOLED technology in their flagship devices, driving growth in both the smartphone and smart TV segments.
OLED Market Regional Outlook
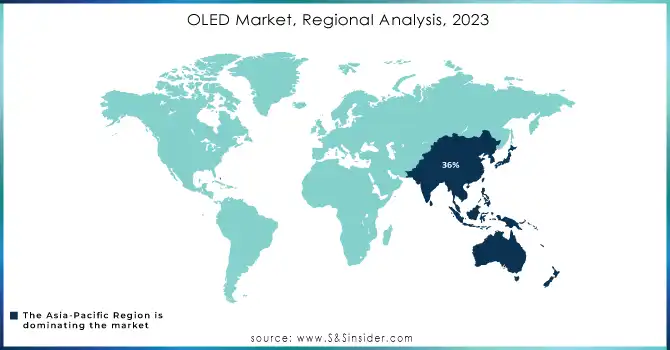
In 2023, the Asia-Pacific (APAC) region held a dominant 36% share of the OLED market, driven by strong manufacturing capabilities, high consumer demand, and technological innovations. Leading OLED manufacturers such as Samsung Electronics, LG Display, BOE Technology, and Sony are at the forefront of AMOLED and OLED production, catering to growing demand in smartphones, OLED TVs, and wearables. The region’s infrastructure and economies of scale have positioned it as the global hub for OLED technology. Consumer electronics demand, especially for premium smartphones from Apple, Samsung, and Xiaomi, has significantly contributed to market growth. APAC is also pioneering developments in flexible OLED displays and foldable smartphones, with key innovations from South Korea, China, and Japan. The automotive sector’s increasing adoption of OLED dashboards and infotainment systems, alongside the expanding wearable devices market, further enhances the region’s leadership in the OLED market.
In 2023, North America emerged as the fastest-growing region in the OLED market, driven by the increasing adoption of advanced display technologies in sectors like consumer electronics, automotive, and wearables. Key drivers for growth include technological advancements, with companies like Apple, Tesla, and Microsoft investing in OLED technology for high-performance applications such as smartphones, smartwatches, and automotive displays. Automotive integration is expanding, with OLED screens being used in digital dashboards, infotainment systems, and head-up displays by major manufacturers like Tesla and General Motors. OLED displays are preferred for their energy efficiency and vibrant visuals, with companies like Apple leading the charge. Additionally, North America’s focus on energy efficiency has accelerated the shift toward AMOLED displays, making them ideal for smartphones and wearables. Both the U.S. and Canada are key players in driving this innovation.
Get Customized Report as Per Your Business Requirement - Request For Customized Report
Key Players
Some of the major players in OLED Market with product:
-
Samsung Electronics Co., Ltd. (OLED Displays, Galaxy smartphones)
-
LG Display Co., Ltd. (OLED TVs, OLED Lighting Panels)
-
Sony Corporation (OLED TVs, Professional Displays)
-
Panasonic Corporation (OLED TVs)
-
BOE Technology Group Co., Ltd. (OLED Panels for smartphones and tablets)
-
AU Optronics Corp. (OLED Displays for laptops and automotive)
-
Universal Display Corporation (OLED Materials and Technologies)
-
RiTdisplay Corporation (PMOLED Displays)
-
TCL Technology Group Corporation (OLED TVs and Display Panels)
-
Visionox Technology Inc. (OLED Panels for smartphones and wearables)
-
Sharp Corporation (OLED Displays for smartphones)
-
Konica Minolta, Inc. (OLED Lighting Panels)
-
Acuity Brands, Inc. (OLED Lighting Solutions)
-
OSRAM Licht AG (OLED Automotive Lighting)
-
Pioneer Corporation (OLED Automotive Displays)
-
EverDisplay Optronics (Shanghai) Limited (AMOLED Displays)
-
Japan Display Inc. (OLED Panels for automotive and mobile devices)
-
AIXTRON SE (OLED Production Equipment)
-
Applied Materials, Inc. (OLED Manufacturing Equipment)
-
Tianma Microelectronics Co., Ltd. (OLED Displays for consumer electronics)
List of key suppliers for raw materials used in OLED production:
-
Universal Display Corporation
-
Merck Group
-
Idemitsu Kosan Co., Ltd.
-
LG Chem
-
Samsung SDI
-
Sumitomo Chemical
-
Dupont
-
BASF
-
Toshiba Materials Co., Ltd.
-
Heraeus
Recent Development
-
On November 8, 2024, LG Display unveiled a new flexible OLED screen capable of stretching up to 50% and attaching to fabric, paving the way for applications in wearable tech and automotive displays. The 12-inch prototype, displayed at LG Science Park in Seoul, features a 100 ppi resolution and can endure over 10,000 stretches, marking a significant advancement in interactive display technology.
-
On November 12, 2024, Samsung Display revealed plans to boost its small and mid-sized OLED panel production by 10% in 2025, reaching 475.6 million units. The company aims to focus on high-value products like IT rigid OLED and foldable displays, including a 150% increase in foldable panels for the Galaxy Z Fold series.
-
On November 11, 2024, MSI launched two new flagship gaming monitors, the MPG 491CQPX (49-inch, 5120 x 1440p resolution) and MPG 321URXW (32-inch), both featuring QD-OLED panels with up to 240Hz refresh rate for an enhanced gaming experience.
| Report Attributes | Details |
|---|---|
| Market Size in 2023 | USD 46.25 Billion |
| Market Size by 2032 | USD 232.22 Billion |
| CAGR | CAGR of 19.64% From 2024 to 2032 |
| Base Year | 2023 |
| Forecast Period | 2024-2032 |
| Historical Data | 2020-2022 |
| Report Scope & Coverage | Market Size, Segments Analysis, Competitive Landscape, Regional Analysis, DROC & SWOT Analysis, Forecast Outlook |
| Key Segments | • By Product (OLED Display, OLED Lighting) • By Technology (AMOLED, PMOLED) • By Panel Type (Rigid, Flexible, Others) • By Display Size (Below 6 Inches, 6 to 20 Inches, 21 to 50 Inches, More than 50 Inches) • By Application( Smartphones & Tablets, PC Monitors & Laptops, Television Sets, Digital Signage/Large Format Displays, Smart Wearables, Automotive Display, Others) |
| Regional Analysis/Coverage | North America (US, Canada, Mexico), Europe (Eastern Europe [Poland, Romania, Hungary, Turkey, Rest of Eastern Europe] Western Europe] Germany, France, UK, Italy, Spain, Netherlands, Switzerland, Austria, Rest of Western Europe]), Asia Pacific (China, India, Japan, South Korea, Vietnam, Singapore, Australia, Rest of Asia Pacific), Middle East & Africa (Middle East [UAE, Egypt, Saudi Arabia, Qatar, Rest of Middle East], Africa [Nigeria, South Africa, Rest of Africa], Latin America (Brazil, Argentina, Colombia, Rest of Latin America) |
| Company Profiles | Samsung Electronics Co., Ltd., LG Display Co., Ltd., Sony Corporation, Panasonic Corporation, BOE Technology Group Co., Ltd., AU Optronics Corp., Universal Display Corporation, RiTdisplay Corporation, TCL Technology Group Corporation, Visionox Technology Inc., Sharp Corporation, Konica Minolta, Inc., Acuity Brands, Inc., OSRAM Licht AG, Pioneer Corporation, EverDisplay Optronics (Shanghai) Limited, Japan Display Inc., AIXTRON SE, Applied Materials, Inc., and Tianma Microelectronics Co., Ltd. |
| Key Drivers | • Expanding Horizons in OLED Technology Across Consumer Electronics and Emerging Sectors |
| Restraints | • Durability Concerns and Burn-In Challenges Delay OLED Adoption in Consumer Electronics |
Get in Touch
