Flexible Display Market Report Scope & Overview:
To get more information on Flexible Display Market - Request Sample Report
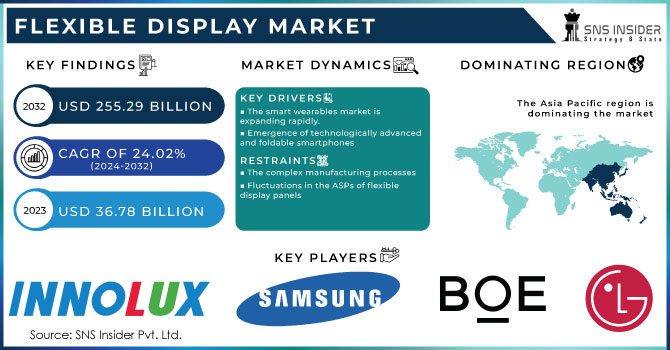
The Flexible Display Market Size was valued at USD 36.78 billion in 2023 and is expected to reach USD 255.29 billion by 2032 and grow at a CAGR of 24.02% over the forecast period 2024-2032.
The flexible display market is majorly driven by the consumer electronics market due to the production of mobile, unbreakable, and lighter electronics products. Flexible screens have become one of the most important alternatives for the next generation of devices. It can be highly valued for its additional functions, new applications, or design. For example, the Galaxy Z Fold series developed by Samsung, has visibly set the standards for foldable phones. The worldwide shipments of foldable phones including flip and fold reached 21.4 million units by 2023 from 14.2 million units by 2022 having an increase of more than 50% over 2022. Foldable phone shipments are estimated to reach 48.1 million units by 2027 with a CAGR of 27.6%. The forecast indicates the strength and volume of phones in the overall mobile phone market.
Moreover, the market demand for flexible displays is driven by the rapidly increasing pace of the smart wearable industry. Thus, manufacturers continue to invest actively in expanding their manufacturing capacity to meet the demand. Shipments of wearable devices experienced significant growth at the beginning of 2024 and increased by 8.8% in Q1 of 2024 to an all-time high of 113.1 million units. For example, Xiaomi with 43.4% year-over-year growth became the second-largest vendor by shipping 18.3 million wearable devices.
The automotive industry is currently experiencing a strong change owing to the development of new technologies and the shifting of consumers’ preferences. Flexible displays are becoming demandable equipment as they tend to provide higher functionality, improved safety, and a better look at automotive devices. Thus, one of the most important drivers behind their adoption in the industry is the increased popularity of advanced driver-assistance systems and in-car-infotainment systems. Now, the Lexus ES 300h luxury hybrid saloon is making its popular, convenient, and safe model, even safer and more convenient for drivers. This technology had been a world-first on a high-volume production car when it was made available on the ES in Japan, now this feature is offered as an option for the UK market ES Takumi model.
MARKET DYNAMICS
Drivers
- The smart wearables market is expanding rapidly.
Flexible displays are in high demand in wearable devices as they can substantially contribute to the development of more comfortable solutions. It means that such displays enable the creation of wearables that will better fit the human body. For example, it is possible to make a smartwatch with a flexible display that could occupy the entire wrist or part of an arm and thus provide users with more possibilities to interact with information. Nowadays, people search for devices that would allow them to control their heart rate, activity, sleep, and other important health parameters. Thus, flexible displays permit making lightweight, comfortable, and aesthetically beautiful devices that can be worn all day long. Many makers of smart bands are anticipating expanding their product lineup to include handheld displays. Small display screens are used in smart wearable products like watches and bracelets. The importance of smart wearables is expanding incorporating the newest industry applications, such as augmented and virtual reality (AR VR), which present new business potential for OLED display manufacturers. Large-sized display panel producers like Taiwan's AU Optronics Corp. and Innolux Corp. may benefit from the rising market for smart wearables. Businesses could make investments to concentrate on these apps, which would eventually boost their income.
- Emergence of technologically advanced and foldable smartphones
One of the main advances in the scope of smartphone design is the development of foldable devices that have high performance, convenient screen sizes and are more technologically advanced. This solution uses a flexible display that can be used when the smartphone is folded and open to two or three times the size. Such a model resolves the existing problem, which arose in connection with the increasing tendency to expand the screens of smartphones in the application. It created the risk of presenting extremely awkward and inconvenient devices for users. Instead, foldable phones provide both a small screen for folding and convenient use and a large screen that opens up many opportunities for users. The consideration of these advantages can be summarized in the statement that due to the introduction of foldable smartphones, a demand for flexible displays has been observed, which becomes one of the prospects for the group.
Restraints
- The complex manufacturing processes
The manufacture of flexible screens is a multi-stage, complicated process. Other rival display technologies now provide better design capabilities and need fewer production steps. The performance of rigid display and electronics technologies now on the market must be matched by flexible display technology. Many organic compounds used in flexible electronics and screens are flammable and sensitive to oxygen. Moisture and oxygen exposure shorten a material's lifespan. Consequently, they offer less defense. These materials also frequently function at high voltages and sluggish speeds. Extreme temperatures also affect them negatively.
- Fluctuations in the ASPs of flexible display panels
The ASPs and shipping volumes of flexible display panels are the two main factors that affect the producers' revenues, especially the costs and volume changes that have an impact on this. Flexible display panel prices and shipping quantities are influenced by several variables, including raw material costs, yield rates, supply and demand, competition, pricing tactics, and transportation costs. The ASP of raw materials and flexible display panels has experienced significant changes in the flexible display sector. The ASP of flexible display panels may drop if production capacity quickly increases. In contrast, ASP may rise if supply cannot keep up with rising demand.
KEY MARKET SEGMENTATION
By Panel Size
The flexible display market by panel size is dominated by the up to 6” segment in terms of market share i.e. above 39% in 2023. Factors such as the compact size, ease of carry, and cost-effectiveness both for manufacturers and consumers have contributed to the segment growth.
The 20-50” segment is expected to emerge as the fastest-growing segment by a consistent CAGR over the forecast period. The market’s growth is driven by the demand for new automotive displays with advanced technology for better use. Moreover, the growth is due to manufacturers who are launching new products. For example, LG Electronics launched the LG OLED Flex model LX3 in September 2022, a 42-inch OLED screen that can bend.
By Substrate Material
In 2023, the plastic segment had the largest market share of more than 48.5%, and it is expanding at a steady CAGR. As plastic offers better scales, robustness, and weight, its demand as a material for flexible displays is increasing. Secondly, the preference for plastic to be used in the manufacture of low-cost and highly flexible exhibits in the electronics industry. However, glass substrates are waterproof, and gas-resistant which makes them durable. Hence, the glass substrate material is growing at a faster rate during the forecast period. The players in the display market are working on creating a durable glass substrate since the plastic substrates are prone to scratching, creasing, and donning of color with time
By Display Size
The OLED segment was the leading in 2023 with a market share of more than 50.15% and is expected to grow at the highest rate during the forecast period. The OLED flexible displays can be highly flexible, consume less energy, and therefore are increasingly adopted in smartphones. OLED flexible displays are sleeker and lighter than the LCD as they do not require a backlight or filters.
LED displays may become challenging for users in the coming years, as their reading performance declines in changing lighting conditions. On the other hand, the rising adoption of flexible display-based e-readers to drive the growth of the Electronic Paper Display segment in the coming years.
REGIONAL ANALYSIS
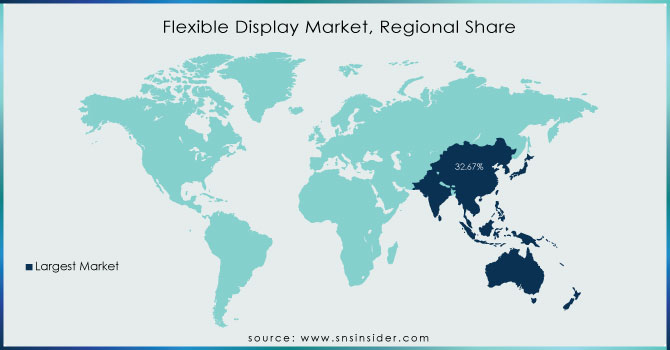
Asia Pacific accounted for more than 32.67 % of the overall revenue in 2023 and it is expected to grow at a stable CAGR during the forecast period. The demand for the flexible display market in the region is driven by the increasing number of electronic devices that are compact and lighter in weight. Besides, such growth is explained by the prevalence of smartphones and other advanced technologies, such as displays and the increasing use of augmented reality. Numerous electronics manufacturers like Samsung and LG are equally helping the regional growth. Moreover, the region’s population is also sizeable, so the demand for displays is not missing. The leading countries that have adopted flexible displays include Japan, South Korea, China, and India. China is the largest flexible OLED screen producer worldwide.
North America is growing fast in the regional analysis with a market share of over 27.15% in 2023. The demand for flexible displays in North America is high due to devices with high energy consumption capacity. The market in Europe is equally developing and shows substantial growth in demand because the automotive industry requires a sufficient number of flexible displays.
Need any customization research on Flexible Display Market - Enquiry Now
KEY PLAYERS
The Major Player are LG Display Co., Ltd. (South Korea), Samsung Electronics (South Korea), Innolux Corp. (Taiwan), AU Optronics (Taiwan), Japan Display Inc. (Japan), BOE Technology Group Co., Ltd. (China), Sharp Corp. (Japan), Visionox Corporation (China), E Ink Holdings, Inc. (Taiwan), Corning Incorporated (US), E. |. du Pont de Nemours and Company (US), FlexEnable Limited (UK), Kateeva (US), Cambrios Technologies Corp. (US), Royole Corporation (US) and other players are listed in a final report.
RECENT DEVELOPMENTS
- In May 2023, LG introduced new OLED TVs in India, including flexible OLED models for gamers and the world's first 97-inch OLED TV. This demonstrates LG's commitment to innovation and leadership in the OLED display market.
- In August 2023, reports emerged suggesting that Samsung is working on rollable screen smartphones. This aligns with Samsung's history of showcasing innovative display technologies and indicates the company's continued focus on pushing the boundaries of display design.
- In July 2023, iReader announced the upcoming launch of a foldable e-reader with an E Ink Carta 1200 display. This development highlights the growing interest in flexible displays for e-reader applications, offering potential benefits such as larger reading areas and compact portability.
- In February 2024, news surfaced about Samsung's development of a phone that can be bent onto the wrist and worn like a watch. This concept showcases Samsung's exploration of new form factors and the potential of flexible displays to enable innovative wearable devices.
| Report Attributes | Details |
| Market Size in 2023 | US$ 36.78 Bn |
| Market Size by 2032 | US$ 255.29 Bn |
| CAGR | CAGR of 24.02% From 2024 to 2032 |
| Base Year | 2023 |
| Forecast Period | 2024-2032 |
| Historical Data | 2020-2022 |
| Report Scope & Coverage | Market Size, Segments Analysis, Competitive Landscape, Regional Analysis, DROC & SWOT Analysis, Forecast Outlook |
| Key Segments | • By Panel Size (Up to 6”,6-20", 20-50" Above 50”) • By Substrate Material (Glass, Plastic, Others) • By Technology (OLED Display, E-paper Display, Quantum dot LED Display, LED-Backlit LCD) • By Application (smartphones & tablets, television & digital signage, automotive & transportation, e-reader, smartwatches & wearables, others) |
| Regional Analysis/Coverage | North America (USA, Canada, Mexico), Europe (Germany, UK, France, Italy, Spain, Netherlands, Rest of Europe), Asia-Pacific (Japan, South Korea, China, India, Australia, Rest of Asia-Pacific), The Middle East & Africa (Israel, UAE, South Africa, Rest of Middle East & Africa), Latin America (Brazil, Argentina, Rest of Latin America) |
| Company Profiles | LG Display Co., Ltd. (South Korea), Samsung Electronics (South Korea), Innolux Corp. (Taiwan), AU Optronics (Taiwan), Japan Display Inc. (Japan), BOE Technology Group Co., Ltd. (China), Sharp Corp. (Japan), Visionox Corporation (China), E Ink Holdings, Inc. (Taiwan), Corning Incorporated (US), E. |. du Pont de Nemours and Company (US), FlexEnable Limited (UK), Kateeva (US), Cambrios Technologies Corp. (US), Royole Corporation (US) |
| Key Drivers |
|
| Market Restraints |
|
Frequently Asked Questions
Asia Pacific, regionally dominates the Flexible Display Market in 2023.
The smartphones & tablets segment by application is dominating the Flexible Display Market.
The rise in demand for flexible displays in the automotive sector is majorly raising the growth of the Flexible Display Market.
The Flexible Display Market size was USD 36.78 billion in 2023 and is expected to Reach USD 255.29 billion by 2032.
The Flexible Display Market is expected to grow at a CAGR of 24.02%.
Get in Touch
