Online Art Market Report Scope & Overview:
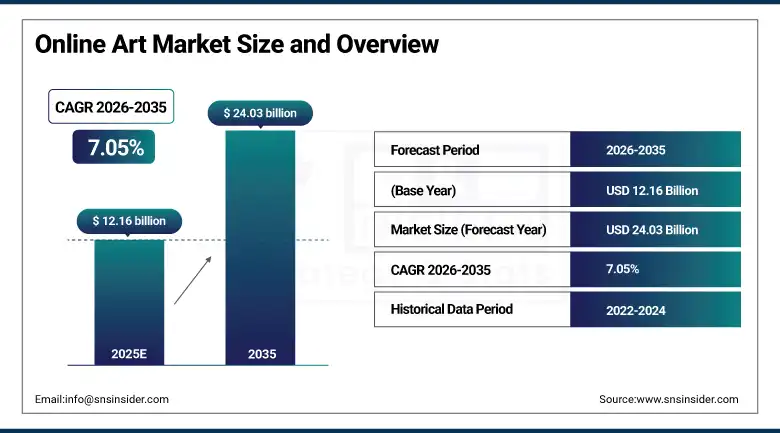
Online Art Market was valued at USD 12.16 billion in 2025 and is expected to reach USD 24.03 billion by 2035, growing at a CAGR of 7.05% from 2026–2035.
The global Online Art Market has undergone a structural transformation over the past decade from a niche alternative channel for art collectors into a mainstream, high-growth commerce platform that is progressively displacing traditional gallery, auction house, and art fair transaction channels for a growing proportion of global art sales across all price segments and art categories. The permanent shift toward digital commerce that was catalysed by pandemic-era physical gallery closures, which forced auction houses including Christie's and Sotheby's to pivot their highest-value sales entirely online in 2020 and discover that digital bidding platforms attracted new buyer demographics and broader global participation than equivalent physical auction events, has created a structural market expansion that has sustained above-trend growth even as physical art venues fully reopened. Online mediums have constituted about 18% of art transactions in the U.S. as of 2024, substantially higher than pre-pandemic rates, indicating a trend towards art transactions via the internet among consumers and institutions. These include a broad range of transactional platforms from the online platforms of established auction houses to specific online art marketplaces such as Artsy, Saatchi Art, and Singulart. In addition, there are online stores for artworks sold directly by the artists themselves as well as print-on-demand websites like Fine Art America, NFT markets and art rental subscriptions. These platforms all cater to a collection of collectors globally who own up to 63% digital art, according to recent survey data. With increasing acceptance of photography, digital art, and NFTs as valid forms of art investments, the number of art categories collectable online continues to grow and attract new generations of digital natives.
7.05% CAGR for Online Art Market between 2026-2035 results from the gradual but consistent move of global art trade to digital trading platforms owing to their higher degree of convenience, broader geographical scope, transparent pricing, authentication, and more democratic access compared to the traditional physical gallery and auction house setting in which only the affluent and geographically located groups of collectors participated in the art market. Increased adoption of blockchain authentication, AR virtual preview technology, and AI-driven art discovery and recommendations is making up for the experience and trust gap that caused reluctance among collectors to make transactions involving expensive art works without physically inspecting them first.
Online Art Market Size and Forecast
-
Market Size in 2025: USD 12.16 Billion
-
Market Size by 2035: USD 24.03 Billion
-
CAGR: 7.05% from 2026 to 2035
-
Base Year: 2025
-
Forecast Period: 2026–2035
-
Historical Data: 2022–2024
To Get more information On Online Art Market - Request Free Sample Report
Online Art Market Trends
-
Growing adoption of augmented reality virtual try-before-you-buy features within online art platforms, enabling collectors to visualise how specific artworks would appear on their home or office walls at actual scale using smartphone AR overlays before committing to purchase, substantially improving buyer confidence for mid-value purchases without physical inspection.
-
Accelerating integration of blockchain-based provenance tracking and authentication certification for physical artworks sold through online platforms, providing buyers with immutable ownership history and authenticity guarantees that address the counterfeiting and attribution concerns historically limiting online art sales at higher price points.
-
Rising adoption of AI-powered art discovery and recommendation systems on major online art platforms, analysing collector purchase history, viewing patterns, and preference signals to surface relevant artworks from the millions of listings available on large platform catalogues, dramatically improving the discovery experience for both emerging and established artists.
-
Growing significance of social media and influencer marketing in driving online art discovery and purchase, particularly through Instagram, TikTok, and Pinterest where visual platform formats enable artists to build substantial collector communities and drive direct online store sales without gallery representation or platform intermediary fees.
-
Expanding market for photography as a collectible art category through online channels, where digital-native presentation advantages, the affordability of limited-edition prints relative to unique paintings and sculptures, and the visual discovery capabilities of online platforms are driving rapid adoption among younger and first-time collectors.
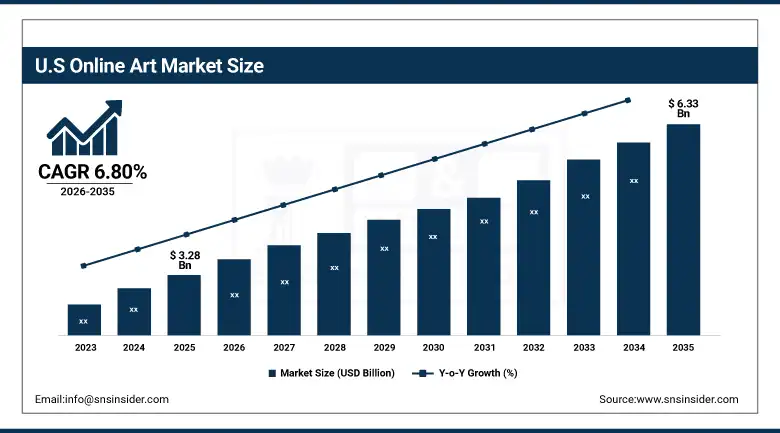
U.S. Online Art Market was valued at USD 3.28 billion in 2025 and is expected to reach USD 6.33 billion by 2035, growing at a CAGR of 6.80% during 2026–2035.
The United States represents the world's largest and most commercially sophisticated online art market, characterised by the highest per-capita spending on art among major economies with Americans estimated to spend over USD 30 billion annually across all art market channels, the deepest institutional and commercial collector base of any national market, and the headquarters of the world's leading online art market platforms including Artsy, Saatchi Art, Christie's and Sotheby's digital operations, and the NFT marketplace ecosystem centred in New York. U.S. online art market leadership is sustained by the technology sector's wealth creating a new generation of tech-affluent collectors who are comfortable with and prefer online transaction channels, the growth of art as an alternative investment vehicle attracting both UHNW individual investors and institutional asset allocators, and the vibrant contemporary and emerging art scene in New York, Los Angeles, and Miami that generates the new artwork supply that online platforms market to global collector audiences.
The launch of 'Artists for Kamala', an exclusive online exhibition organized by Artsy and showcasing 164 works of art created by celebrated artists such as Jeff Koons in 2025 revealed how major online art portals possessed distinctive power in uniting citizens on a civic level for promoting a unique culture and were able to mobilize artist groups as well as the collectors of artwork. This phenomenon whereby online art portals are transformed from mere transactional intermediaries into unique art institutions having their own aesthetics and collector base can be considered as one of the most important factors behind the sustenance of the U.S. online art market during the forecast period.
Online Art Market Segment Insights
-
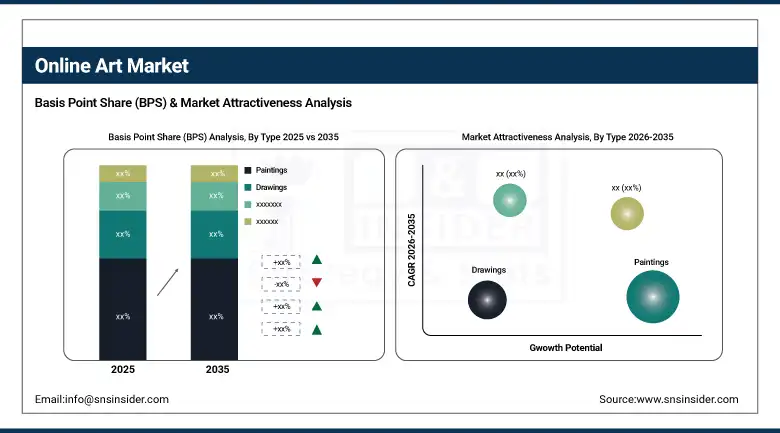
According to Type, Paintings dominated with approximately 35% market share in 2025, maintaining dominance through traditional appeal, strong investment value, and high buyer confidence; Photography is expected to grow at the fastest CAGR of approximately 9.61% from 2026 to 2035 driven by its affordability, digital-native format, and appeal among younger collectors.
-
In terms of Customer Type, Domestic Customers dominated with approximately 65% revenue share in 2025 through familiarity with local artists, cultural affinity, and trust in national platforms; Foreign Customers are expected to grow at the fastest CAGR of approximately 8.56% from 2026 to 2035 driven by increasing global platform access, multilingual support, and improving cross-border trust mechanisms.
-
By Price Range, the USD 1,000 to USD 10,000 mid-market range is the most commercially significant and actively traded segment; the Below USD 1,000 segment is the fastest-growing driven by print-on-demand platforms, photography, and digital art democratising first-time collector access.
-
By Platform, Auction Platforms dominated through heritage auction house digital extensions by Christie's and Sotheby's commanding the highest average transaction values; Marketplace and Artist-Direct platforms are the fastest-growing through Artsy, Saatchi Art, and Singulart democratising accessible art access for mid-market collectors.
Online Art Market Segment Analysis
By Type: Paintings dominate, Photography grows fastest
Paintings retained the dominant art type position in the Online Art Market in 2025 with approximately 35% of revenues, reflecting the category's fundamental status as the most recognised, institutionally validated, and collector-trusted art form across all price segments from affordable emerging artist works sold through online galleries for hundreds of dollars through blue-chip blue-chip works from established artists transacting at multi-million-dollar levels through premium online auction platforms. Paintings' dominance is sustained by the deeply embedded psychological association between oil on canvas and authentic fine art investment value that takes precedence over newer art categories in the purchase decisions of established and high-net-worth collectors who account for the majority of online art market revenue by value. The online channel has enabled a significant democratisation of the paintings market, where digital photography of artworks, standardised condition reporting, and secure payment infrastructure enable collectors to confidently purchase paintings valued up to several hundred thousand dollars without physical inspection, a threshold that was considerably lower for online art transactions a decade ago.
Photography is projected to grow at the fastest art type CAGR of approximately 9.61% through 2035, driven by a compelling convergence of factors that make it uniquely suited to online commerce and particularly resonant with younger and digitally native collector demographics who are entering the art market in growing numbers. Photography's digital-native format makes it ideally suited to online platform presentation, where screen display reproduces photographic artworks with high fidelity enabling confident online purchase without the physical colour accuracy and texture questions that apply to paintings. Limited-edition photographic prints from emerging and established photographers are available at price points from a few hundred to several thousand dollars that represent accessible entry points for first-time collectors, while major photographic works from iconic photographers’ command premium prices that establish photography's credibility as a serious investment art category alongside paintings.
By Customer Type: Domestic Customers dominate, Foreign Customers grow fastest
Domestic Customers retained the dominant customer type position in 2025 with approximately 65% of global Online Art Market revenues, reflecting the fundamental commercial advantages of same-country art purchase including shared cultural context enabling deeper aesthetic connection to locally-produced art, lower shipping costs and logistical complexity, absence of import duty and customs documentation requirements, and the greater familiarity with domestic platform payment systems and consumer protection frameworks that reduce perceived transaction risk. Domestic buyers demonstrate significantly higher repeat purchase rates on regional online art platforms than foreign buyers, reflecting the stronger ongoing relationships they build with platforms curating locally relevant artist rosters. National language, currency, and cultural reference alignment between domestic buyers and the artists and platforms they engage with creates a natural commercial advantage that sustains domestic customer revenue leadership.
The Foreign Customers are the quickest growing market segment with growth rate of 8.56% CAGR for period up to year 2035. This is attributed to the increasing efficiency of online art platforms in terms of facilitating cross-border discovery, buying, and transportation of art works through use of multilingual user interface, international transaction capabilities, transparent cross-border freight charges, import duties calculation tools, and provenance documentation for meeting increased due diligence required in international art transactions. The rising worldwide interest in art styles not accessible locally such as contemporary Chinese art work which appeals Western customers, and Latin American and contemporary African art work which has gained global acceptance is developing cross-border customer flow which is facilitated only online art platforms as opposed to traditional international art fairs.
By Price Range: Mid-Market dominates, Entry-Level grows fastest
The USD 1,000 to USD 10,000 mid-market price range represents the most commercially active and liquid segment of the Online Art Market in 2025, serving the largest and most rapidly growing segment of established collectors who have progressed beyond introductory purchases but have not yet reached the ultra-high-net-worth collector level where primary relationships are managed through prestigious galleries and major auction houses. This price range encompasses original works from established emerging and mid-career artists, limited-edition prints from recognized contemporary photographers and printmakers, and secondary market transactions of early-career works from artists who have subsequently achieved greater recognition. Online platforms including Artsy, Saatchi Art, and Singulart have most comprehensively served this mid-market segment, providing the professional platform infrastructure including artist biography, exhibition history, comparable price data, certificate of authenticity, and secure payment processing that collectors require for confident purchases in this price range.
The Below USD 1,000 segment is the fastest-growing price range through 2035, driven by print-on-demand platforms including Fine Art America and Redbubble that have created entirely new categories of affordable art merchandise and limited-edition prints accessible to the mass-market collector audience that traditional art retail has never effectively served. The growth of artist-direct social commerce through Instagram and TikTok shops where artists sell affordable original and reproduction works directly to follower communities without gallery or platform intermediary fees is creating a rapidly expanding accessible art economy that is progressively converting art appreciators into art buyers at the lowest price thresholds. Digitally-delivered art forms including fine art photography downloads, AI-generated art prints, and digital illustration licenses are additionally expanding the below-USD-1,000 segment through products with zero physical production and shipping costs.
Online Art Market Regional Analysis
|
Region |
Major Country |
Share within Region (%) |
|---|---|---|
|
North America |
United States |
~82% |
|
Europe |
United Kingdom |
~31% |
|
Asia Pacific |
China |
~48% |
|
Middle East & Africa |
UAE |
~30% |
|
Latin America |
Brazil |
~43% |
North America Online Art Market Insights
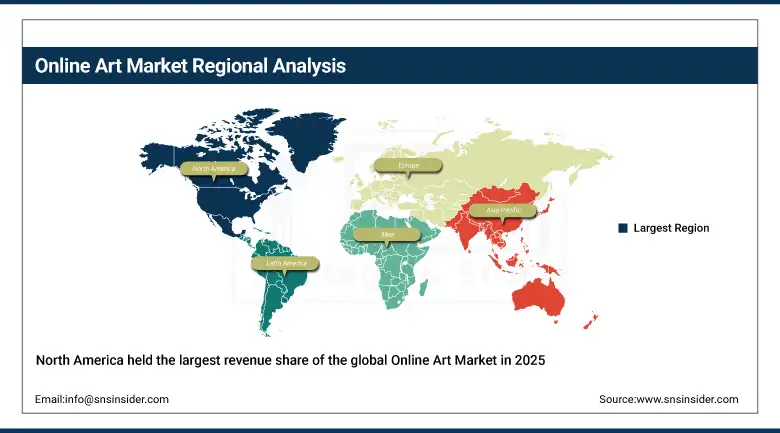
North America held the largest revenue share of the global Online Art Market in 2025, led by the United States with approximately 82% of North American revenues, driven by the highest per-capita art spending, the deepest institutional and UHNW collector base, and the commercial headquarters of the world's leading online art platforms including Artsy, Saatchi Art, and the digital operations of Christie's and Sotheby's. The U.S. market's tech-affluent consumer culture, where digital commerce is the default purchasing channel across consumer goods categories, accelerates online art adoption relative to more gallery-centric European and Asian art markets.
Get Customized Report as per Your Business Requirement - Enquiry Now
Asia Pacific Online Art Market Insights
The region of Asia Pacific will witness the highest regional CAGR, which will be close to 9.36%, till 2035, owing to the rapid increase in disposable income that will give rise to an influx of collectors in countries like China, South Korea, Singapore, and India; the emergence of a digitally adept generation of collectors, who have been exposed to art through digital means and not physical galleries; and the international recognition of contemporary Chinese art and K-art from South Korea. Leading Asia Pacific with respect to number of collectors is China, owing to the presence of its domestic collector base and strong digital commerce infrastructure, wherein digital commerce platforms such as Taobao (Alibaba Group) and JD.com have fine arts dedicated sales channels for China-based collectors.
Europe Online Art Market Insights
Europe represents a significant online art market anchored by the UK's world-class auction house digital platforms including Christie's, Sotheby's, and Bonhams, combined with the sophisticated collector communities of Germany, France, the Netherlands, and Scandinavia that are progressively embracing online art discovery and purchase. The UK leads European online art revenues through its combination of heritage auction house digital capabilities, a vibrant contemporary art scene attracting global collectors, and English-language platform accessibility that serves international collector audiences. Artfinder and Singulart, two significant European online art marketplace platforms, have built substantial cross-border collector communities from their London and Paris headquarters.
Middle East & Africa and Latin America Online Art Market Insights
MEA and Latin America represent some other new emerging regions where online art is becoming more popular, thanks to increased digital connectivity, growth of HNW art collector community with an international interest in art collection, and increasing visibility of regional artists in international online platforms. The UAE is leading in terms of MEA adoption due to the fact that the region enjoys strong reputation as an art fair hosting destination courtesy of Art Dubai, which brings internationally recognized collectors to the region and allows them to interact with local artists throughout the year via the Internet. Latin America is increasingly being recognized among international collectors for its unique contemporary art scene.
Online Art Market Growth Drivers:
-
Digital transformation of art commerce and growing first-time collector adoption of online platforms driven by improved authentication, augmented reality previews, and accessible price points
The primary structural growth drivers for the Online Art Market are the progressive digitization of the entire art commerce value chain, where improved digital photography standards, blockchain authentication, secure payment processing, and professional logistics support have removed the practical barriers that historically made online art purchase psychologically uncomfortable for collectors accustomed to physical inspection and gallery relationships, combined with the democratization of art market entry through online platforms offering access to millions of artworks across every price range that has converted millions of art appreciators into active online art collectors for the first time.
The December 2024 acquisition by YourArt of a majority share in Artmajeur to form the new ArtMajeur by YourArt company in the worldwide online art market and the May 2025 partnership between Times OOH and ArtCrush Gallery for showcasing digital art from more than 20,000 artists in public locations in India and Mauritius illustrate the trends of consolidation and distribution channel creation that are enabling the growth of the online art commercial landscape in non-e-commerce forms such as public space art placements, corporate art, and hotel art that will power the Online Art Market through the forecast period ending 2035.
Online Art Market Restraints
-
Authentication and provenance concerns for high-value purchases without physical inspection, fraudulent artwork risk, and copyright enforcement complexity limiting market confidence at premium price points
One of the major constraints to the Online Art Market is the constant worry by the collectors about the authenticity of the piece of art, accurate attribution of the same, and the condition representation for the high cost artwork bought without having seen the same physically where the risks in terms of costs for authentication mistakes or misrepresentation of the condition are high and the process of resolving the disputes regarding artwork purchased from online sources is much more complicated than in case of consumer goods. Unauthorized reproduction and misattribution of artworks that may sometimes be sold as original on open market places constitute another constraint due to the fact that a lot of money will have to be spent on checking the authenticity of these works. Intellectual property rights violations for digital art and print-on-demand reproductions constitute another problem.
Online Art Market Opportunities
-
NFT and blockchain provenance infrastructure, art-as-alternative-investment product development, and emerging market collector base expansion
The maturation of blockchain-based provenance and authenticity certification infrastructure for physical artworks, building on the technical lessons learned from the NFT market cycle, represents the most transformative trust infrastructure development for the online art market, enabling collectors to verify ownership history, authenticity certification, and condition reporting for physical artworks with the same immutability and transparency that NFT ownership records provide for digital works. Art as an alternative investment product, where fractional ownership platforms, art-backed lending services, and regulated art investment funds make fine art accessible as a portfolio diversification asset to HNW investors without the physical acquisition and management requirements of direct art collecting, represents an emerging financial services application that will expand the online art market's addressable investor audience. Emerging market collector base expansion across South and Southeast Asia, Latin America, and Sub-Saharan Africa, where rising middle-class wealth and digital connectivity are creating new first-generation collector communities, represents the most significant long-term growth opportunity for online art platforms willing to invest in localized curation, language support, and accessible price range focus.
Recent Developments:
-
May 2025: Times OOH collaborated with ArtCrush Gallery, a digital art platform, to display digital artworks from a community of over 20,000 global and Indian artists across Times OOH's vast digital network including key airports, Mumbai Metro Line 1, and premium city media assets in Bengaluru, Ahmedabad, and Mauritius Airport.
-
2025: Artsy launched its exclusive online showcase 'Artists for Kamala' featuring 164 artworks by renowned artists including Jeff Koons, demonstrating the unique civic and cultural convening capability of major online art platforms at global scale and speed.
-
December 2024: YourArt acquired a majority stake in Artmajeur, an online art platform founded in 2000, creating the combined ArtMajeur by YourArt entity to build a more powerful competitive presence in the global online art marketplace.
-
2025: Christie's expanded its online-only auction programme with enhanced digital preview capabilities and mobile bidding functionality, sustaining the growth of online auction participation that has consistently attracted new buyer demographics beyond the traditional physical auction attendee profile.
-
2025: Sotheby's advanced its digital consignment and valuation services, enabling collectors globally to submit artworks for auction consideration and receive initial valuations through an entirely digital workflow without requiring in-person meetings with specialist appraisers.
Online Art Market Key Players
-
Artsy Inc.
-
Saatchi Art LLC
-
Fine Art America LLC
-
Sotheby's
-
Christie's
-
Singulart SAS
-
Artfinder Ltd.
-
Ugallery LLC
-
The Artling Pte. Ltd.
-
Artspace LLC
-
Invaluable LLC
-
1stDibs Commerce Inc.
-
DeviantArt Inc.
-
Catawiki BV
-
Paddle8 Inc.
-
Wilder World
-
Opensea (Ozone Networks Inc.)
-
Rarible Inc.
-
Foundation Labs
-
ArtMajeur by YourArt
Online Art Market Report Scope:
| Report Attributes | Details |
|---|---|
| Market Size in 2025 | USD 12.16 Billion |
| Market Size by 2035 | USD 24.03 Billion |
| CAGR | CAGR of 7.05% From 2026 to 2035 |
| Base Year | 2025 |
| Forecast Period | 2026-2035 |
| Historical Data | 2022-2024 |
| Report Scope & Coverage | Market Size, Segments Analysis, Competitive Landscape, Regional Analysis, DROC & SWOT Analysis, Forecast Outlook |
| Key Segments | • By Type (Paintings, Drawings, Prints, Photography, Sculptures, Digital Art and NFTs, Others) • By Customer Type (Domestic Customers, Foreign Customers) • By Price Range (Below USD 1,000, USD 1,000 to USD 10,000, Above USD 10,000) • By Platform (Auction Platforms, Gallery Platforms, Artist-Direct Platforms, Marketplace Platforms, Others) |
| Regional Analysis/Coverage | North America (US, Canada, Mexico), Europe (Eastern Europe [Poland, Romania, Hungary, Turkey, Rest of Eastern Europe] Western Europe] Germany, France, UK, Italy, Spain, Netherlands, Switzerland, Austria, Rest of Western Europe]), Asia Pacific (China, India, Japan, South Korea, Vietnam, Singapore, Australia, Rest of Asia Pacific), Middle East & Africa (Middle East [UAE, Egypt, Saudi Arabia, Qatar, Rest of Middle East], Africa [Nigeria, South Africa, Rest of Africa], Latin America (Brazil, Argentina, Colombia, Rest of Latin America) |
| Company Profiles | Artsy Inc., Saatchi Art LLC, Fine Art America LLC, Sotheby's, Christie's, Singulart SAS, Artfinder Ltd., Ugallery LLC, The Artling Pte. Ltd., Artspace LLC, Invaluable LLC, 1stDibs Commerce Inc., DeviantArt Inc., Catawiki BV, Paddle8 Inc., Wilder World, Opensea (Ozone Networks Inc.), Rarible Inc., Foundation Labs, ArtMajeur by YourArt |
Get in Touch
