Operational Technology (OT) Security Market Size Analysis:
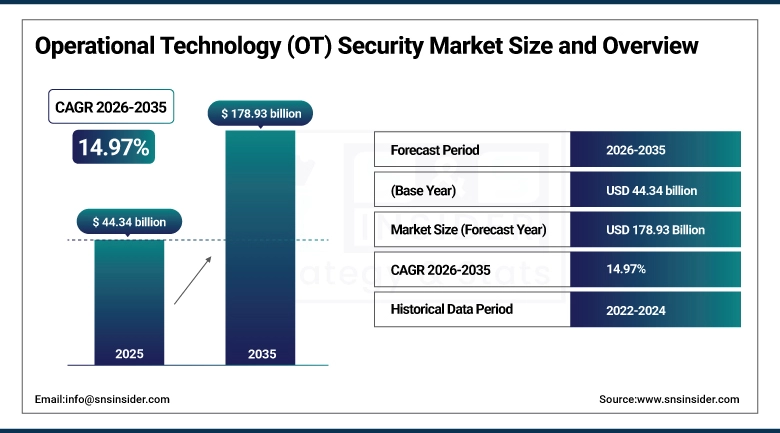
The Operational Technology (OT) Security Market size was valued at USD 44.34 Billion in 2025 and is projected to reach USD 178.93 Billion by 2035, growing at a CAGR of 14.97% during 2026-2035
The Operational Technology (OT) Security Market is expanding due to the industrial networks are even more vulnerable to cyber-attacks and disruption. Increasing deployment of IoT and smart manufacturing solutions are among the factors driving the demand for strong OT security solutions. Compliance to regulations and safety standards promote deployment in critical infrastructure and manufacturing environments. Moreover, AI and machine learning progress is boosting threat detection thereby increasing the adoption and efficacy of OT security solutions.
70% of leading OT security solutions (e.g., Nozomi Networks, Claroty, Dragos) now integrate AI/ML for behavioral analytics.
Operational Technology (OT) Security Market Size & Growth:
-
Market Size in 2025: USD 44.34 Billion
-
Market Size by 2035: USD 178.93 Billion
-
CAGR: 14.97% from 2026 to 2035
-
Base Year: 2025
-
Forecast Period: 2026–2035
-
Historical Data: 2022–2024
To Get More Information On Operational Technology (OT) Security Market - Request Free Sample Report
Operational Technology (OT) Security Market Trends
-
Cloud-based technologies help the scalable, off-site monitoring and management of industrial networks capable of operating in real-time.
-
AI/ML-enabled OT security enables predictive analytics and threat intelligence to facilitate a faster and more intelligent response to incidents.
-
Increasing adoption of smart factories and connected infrastructure drive demand for advanced OT security solutions.
-
Owned and managed/integration services provide recurring revenue and fast deployments in industrial environments.
-
The increasing industrialization in developing regions has led to the development and adoption of advanced OT security in the next-generation.
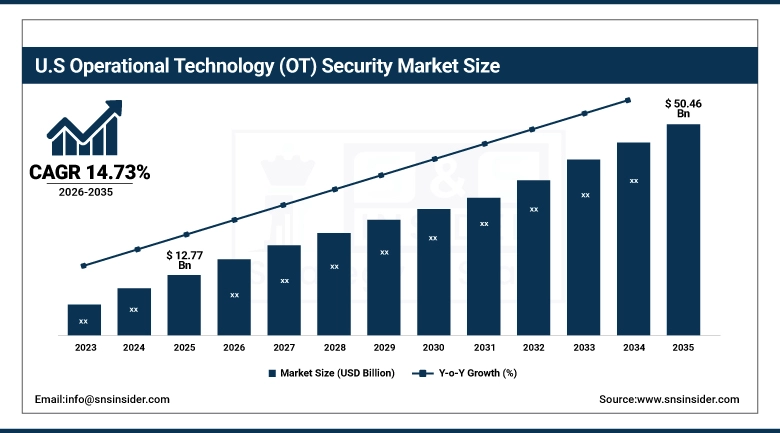
U.S. OT Security Market Size Outlook:
The U.S. Operational Technology (OT) Security Market was valued at USD 12.77 Billion in 2025 and is projected to reach USD 50.46 Billion by 2035, growing at a CAGR of 14.73% during 2026-2035. Operational Technology (OT) Security Market growth is driven by increasing number of advanced and complex cyberattacks on critical infrastructure and industrial control systems. The growing use of smart manufacturing, IoT, and Industrial Control Systems (ICS) demands strong security to protect operations.
Government regulations and industry standards are compelling organizations to adopt modern OT security. Growing requirement of situational awareness in industrial facilities and enterprises operating in energy, transportation, and manufacturing sectors also contribute to the market growth. Increased investment in predictive security using AI and machine learning boosts system reliability.
Operational Technology (OT) Security Market Segment Analysis
-
By component, solutions led the Operational Technology (OT) Security Market with ~71.67% share in 2025, while services registered the fastest growth with a CAGR of 15.57%.
-
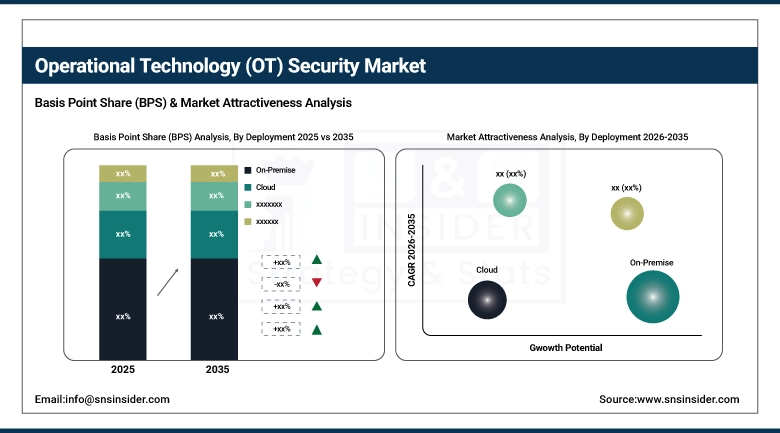
By deployment, on-premise solutions dominated the market with ~43.64% share in 2025, whereas cloud-based deployments showed the fastest growth with a CAGR of 15.73%.
-
By service, managed security services led the market with ~41.76% share in 2025, while integration services recorded the fastest growth with a CAGR of 15.69%.
-
By end-user, the power and electrical sector held ~40.56% share in 2025, while the transportation sector grew the fastest with a CAGR of 15.84%.
By Deployment, On-Premise Dominate While Cloud Shows Rapid Growth
In 2025, based on deployment, the on-premise segments are expected to have a significant market share, as they are adopted widely by end-users as they can adhere to the norms for the safety and security of the end-users assets. Cloud-based OT security market, in contrast, is growing quickly as companies opt for scalable, adaptable and remote cloud-managed monitoring. Today, the on-premise solutions still deliver those vital industrial environments.
By Component, Solution Leads Market While Services Registers Fastest Growth
Solutions dominate the Operational Technology (OT) Security Market, solutions are estimated to have the largest market share and the market would continue to dominate the market throughout the forecast period due to a high demand for threat detection, monitoring, and incident response systems. But what does grow fastest is services, as businesses increasingly look to consulting, integration, and managed security packages. Solutions for the Industrial Network: Real Time Security and Compliance are Still the Answer”.
By Service, Managed Security Services Lead While Integration Services Registers Fastest Growth
Managed Security Services are a category of service that join all critical security requirements monitoring, detecting, and incident responding for OT in the guise of a service. Integration services, however, are generating the fastest growth as organizations demand smooth deployment and integration of OT security solutions into current industrial systems. That includes the need for managed services to ensure operations will work. And as OT environments become more complex, customized integration solutions get quick traction.
By End-User, Power & Electrical Lead While Transportation Grow Fastest
On the basis of end-user, the power & electrical segment dominates the Operational Technology (OT) Security Market owing to its critical infrastructure with high exposure to cyber-attacks. The transportation industry is the fastest-growing sector however as rail, aviation and logistics adopt OT security solutions to safeguard sophisticated, operational networks. Power and electrical is still the biggest sector. For transportation, it’s benefiting from increased investments in smart mobility and connected systems.
Operational Technology (OT) Security Market Growth Drivers:
-
Rising Cyber Threats and Industrial Digitalization Fueling Operational Technology Security Adoption Globally.
The OT Security Market Growth primarily include rising number of incidents of cyber attacks on industrial networks, and increasing digitalization and automation of industrial plants. With the rise of smart factories, IoT and connected infrastructure, security capabilities have grown in importance. Other industries, such as power, transportation and manufacturing, are adopting sophisticated monitoring and threat-detection systems.
Over 60% of global manufacturers have implemented smart factory technologies, including connected machines, sensors, and automation.
Operational Technology (OT) Security Market Restraints:
-
High Implementation Costs and Legacy System Integration Challenges Limiting OT Security Market Expansion
High-level investment in OT Secure Solutions that are not period’ OTSSs are expensive, limiting initial adoption by small and medium enterprises. Legacy industrial systems may be difficult and time-consuming to integrate with. Scarcity of cyber-security skilled experts also impacts performance of the deployment. Operational challenges are increased due to frequent updates and maintenance. Hesitation from prospective end-users about down-time during deployment restricts market expansion.
Operational Technology (OT) Security Market Opportunities:
-
Cloud Adoption and AI-Powered Solutions Driving Growth in Operational Technology Security
The OT security solutions in the cloud support industrial networks in a scalable and remote network management. AI and machine learning implementation provide predictive analytics and real-time threat intelligence. Rising demand for smart grids, smart transportation, and Industry 4.0 projects continues to drive growth. Services around management, integration offer steady revenue, quick implementation. The opportunity is to innovate for the next wave of OT security solutions across industries in emerging markets.
Predictive analytics in OT environments can prevent up to 40% of unplanned downtime by identifying malicious or abnormal device behavior early.
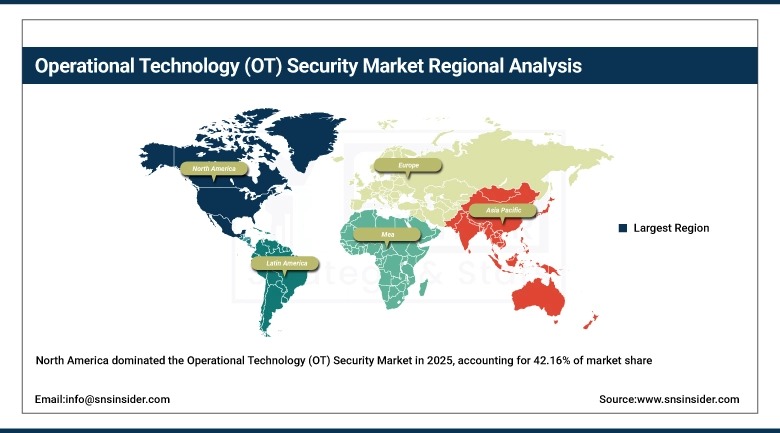
North America Operational Technology (OT) Security Market Insights
In 2025 North America dominated the Operational Technology (OT) Security Market and accounted for 42.16% of revenue share, this leadership is due to the rapid digitization and early adoption of advanced security solutions. Demand has also been stoked by the rising prevalence of cyber-attacks on critical infrastructure like energy, utilities and manufacturing. Furthermore, favorable government regulations and huge investment in cybersecurity technologies fueled the market growth of North America.
Get Customized Report as Per Your Business Requirement - Enquiry Now
U.S. Operational Technology (OT) Security Market Insights
U.S. operational technology (OT) security market is likely to emerge as a highly lucrative vertical in the years to come. Surging cyberattacks on critical infrastructure, along with stringent regulatory requirements such as NERC CIP and TSA pipeline directives are driving adoption. Growing IT–OT convergence and the incorporation of AI-powered monitoring tools also drive demand.
Asia-pacific Operational Technology (OT) Security Market Insights
Asia-pacific is expected to witness the fastest growth in the Operational Technology (OT) Security Market over 2026-2035, with a projected CAGR of 15.66% due to increasing pace of industrialization, the growing adoption of Industry 4.0, and smart manufacturing programs. Rising spending on essential services, including energy, transport, and utilities, is driving demand for security. Furthermore, growing cyber threats in emerging economies and favorable government digitalization policies are contributing to the market gaining strong traction.
China Operational Technology (OT) Security Market Insights
China OT (Operational Technology) Security Market is growing based on widespread industrial digitalization and smart manufacturing projects sponsored by government. Rising adoption of Industrial IoT, 5G and automation in energy, transport, and manufacturing sectors is making security of OT even more critical. Increased cyber threats against critical infrastructure have led to greater regulation and large investment in security.
Europe Operational Technology (OT) Security Market Insights
In 2025, Europe emerged as a promising region in the Operational Technology (OT) Security Market, due to increasing penetration of automation, IoT, and smart grid projects in the region is expected to drive demand for sophisticated OT security solutions. Increasing number of cyber attacks on manufacturing and energy verticals have also spurred security spending. Partnership between government and technology suppliers are also encouraging innovation and boosting Europe’s outlook.
Germany Operational Technology (OT) Security Market Insights
Germany’s OT Security Market is growing, driven by the country’s robust industrial base, as well as its leadership in the adoption of Industry 4.0. The adoption of robotics, automation, and connected systems in manufacturing is creating the need for OT security solutions with advanced capabilities.
Latin America (LATAM) and Middle East & Africa (MEA) Operational Technology (OT) Security Market Insights
The Operational Technology (OT) Security Market is experiencing moderate growth in the Latin America (LATAM) and Middle East & Africa (MEA) regions, due to growing awareness of cyber risk across critical infrastructure sectors. Slow digital transformation in oil & gas, energy, and, manufacturing sectors is inviting the demand for OT security solutions. However, budgetary limitations, insufficient skilled workforce, and slow implementation of regulations are hindering adoption pace.
Operational Technology (OT) Security Market Competitive Landscape:
Fortinet is a global leader with a significant share across vital categories, such as energy, manufacturing and transportation, the company is a favorite vendor. Fortinet remains committed to OT security leadership and innovation with an emphasis on zero-trust architectures, AI-driven threat detection, and compliance-ready solutions around the world.
-
In March 2025, Fortinet expanded its OT Security Platform to better protect critical infrastructure. Enhancements include improved FortiGuard OT-specific threat visibility, ruggedized segmentation and 5G solutions, and upgraded SecOps tools for automated threat response and regulatory compliance tracking
Cisco has solidified its leadership role in the Operational Technology (OT) area of cybersecurity, combining its large networking footprint with its advanced security solutions to enable the protection of critical infrastructure in the manufacturing, energy, transportation and utilities sectors among others. Modular, integrated solutions secure traditional IT, cloud, and critical infrastructure, from endpoints to edge, to cloud, and throughout the IoT continuum, allowing customers to harness the power of digital transformation.
-
In March 2025, Cisco completed its $28 billion acquisition of Splunk, a major player in cybersecurity and analytics. This acquisition enhances Cisco's capabilities in data analytics and artificial intelligence, enabling more intuitive and automated cybersecurity solutions for OT environments.
Tenable OT Security provides South African organizations with the ability to converge industry sectors into a single view for any IoT, OT or IT environment, enabling them to discover and address vulnerabilities. It allows monitoring for threats in real-time and ranking them according to their takeout potential, thereby making the security posture robust and healthier.
-
In March 2025, Tenable launched Tenable One for OT/IoT, providing unified exposure management across IT, OT, and IoT environments. These updates strengthen organizations’ ability to detect threats, manage risks, and secure their entire industrial and IT landscape.
Seckiot, OT Cybersecurity Map grants non-intrusive visibility on networks, inventory, segmentation and vulnerabilities without impacting process. The company also provides advanced threat detection through IoCs, signature analysis, and machine learning for the discovery of anomalies and risk activity. Seckiot's offerings assist companies to fortify their industrial and IoT network and become immune to dynamic cyber threats.
-
In September 2025, Seckiot enhanced its OT Cybersecurity Map to provide full visibility into industrial networks, including inventory, segmentation, and vulnerability detection. The company partnered with Alstef Group to strengthen cybersecurity in airport baggage handling systems.
Operational Technology (OT) Security Companies are:
-
Cisco
-
Tenable
-
Seckiot
-
Broadcom
-
Trellix
-
Microsoft
-
Okta
-
Palo Alto Networks
-
Qualys
-
Zscaler
-
CyberArk
-
Rapid7
-
Kaspersky
-
SentinelOne
-
Thales
-
Armis
-
Darktrace
-
Nozomi Networks
| Report Attributes | Details |
|---|---|
| Market Size in 2025 | USD 44.34 Billion |
| Market Size by 2035 | USD 178.93 Billion |
| CAGR | CAGR of 14.97% From 2026 to 2035 |
| Base Year | 2025 |
| Forecast Period | 2026-2035 |
| Historical Data | 2022-2024 |
| Report Scope & Coverage | Market Size, Segments Analysis, Competitive Landscape, Regional Analysis, DROC & SWOT Analysis, Forecast Outlook |
| Key Segments | • By Component (Solution and Services) • By Deployment (On-Premise, Cloud, Hybrid, and Others) • By Service (Power & Electrical, Mining, Transportation, Manufacturing, and Others) • By End-User (Electronics Manufacturers, Automotive OEMs, Medical Device Manufacturers, and Industrial System Integrators) |
| Regional Analysis/Coverage | North America (US, Canada), Europe (Germany, France, UK, Italy, Spain, Poland, Turkey, Rest of Europe), Asia Pacific (China, India, Japan, South Korea, Singapore, Australia, Rest of Asia Pacific), Middle East & Africa (UAE, Saudi Arabia, Qatar, South Africa, Rest of Middle East & Africa), Latin America (Brazil, Argentina, Rest of Latin America) |
| Company Profiles | Fortinet, Cisco, Tenable, Seckiot, Check Point, Broadcom, Trellix, Microsoft, Okta, Palo Alto Networks, Qualys, Zscaler, CyberArk, Rapid7, Kaspersky, SentinelOne, Thales, Armis, Darktrace, Nozomi Networks. |
Get in Touch
