Optical Brighteners Market Size & Overview:
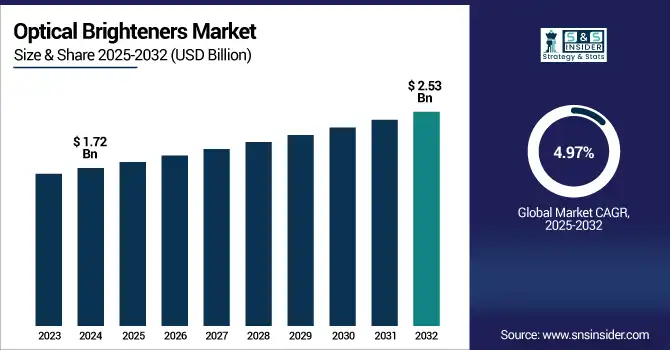
The Optical Brighteners Market size was USD 1.72 billion in 2024 and is expected to reach USD 2.53 billion by 2032, growing at a CAGR of 4.97% over the forecast period of 2025-2032.
To Get more information on Optical Brighteners Market - Request Free Sample Report
Optical brighteners market analysis highlights that the increasing demand for paper and packaging products is a key factor propelling market growth. It is due to the widespread use in the paper industry to increase paper brightness, whiteness, and other optical attributes that are believed to be critical properties of printing paper, writing paper, and premium packaging paper. With e-commerce, retail packaging, and branded consumer goods growing worldwide, manufacturers upgrade to high-end packaging with desirable clean and bright visual characteristics, which are provided by optical brighteners. Moreover, the rise in demand for sustainable and recyclable packaging solutions has led to the utilization of eco-friendly material compatible optical brighteners, which in turn, is catalyzing the market expansion, driving the optical brighteners market growth.
U.S. paperboard production has transitioned strategically to packaging, with more than 50% of total production going to that end use, as reported by the American Forest & Paper Association (AF&PA). Demand for paper alternatives is being driven by state level legislation related to Extended Producer Responsibility (EPR) and plastic bans as seen as seen in California and other states.
Optical Brighteners Market Dynamics:
Drivers
-
Increasing Use of Plastics and Polymers Drives the Market Growth
The rising demand for plastics and polymers is one of the major factors driving the growth of the global optical brighteners market over the foreseeable future. Optical brightener added in plastic materials for improvement of whiteness, brightness, clarity, etc., which are used mostly in the plastics. These are used to prevent the inherent color from becoming yellow while processing and getting UV exposure after some time. In order to cater to the increasing demand for visually enticing packaging in consumer goods, automotive parts, and electronic components, manufacturers are gradually adding these optical brighteners to a wide range of polymers, including polypropylene, polyethylene, and polystyrene.
In November 2024, ExxonMobil announced a USD 200 million investment in Texas to increase advanced recycling capacity that will enable the company to process a further 350mm lbs of plastic waste a year by 2020.
Restrain
-
High Cost of Specialty Grades May Hamper the Market Growth
Specialty grades of optical brighteners are extremely cost-intensive, limiting their use to specific high-value environments only, thus limiting the growth of the market in all other, more cost-sensitive sectors. These specialty formulations, catering to premium applications such as security printing, electronics, and advanced textiles, address strict performance properties [e.g., improved UV stability, brightness, or complex substrates]. Nonetheless, the cost of these super pure materials is so high because of the research, manufacturing, and quality control required to make them. These high prices lead to lower adoption rates, especially in emerging markets and with industries operating on narrow margins, shifting preference toward more affordable alternatives or white pigments and traditional whitening agents.
Opportunities
-
Innovation In UV-Stable and High-Performance Formulations Creates an Opportunity in the Market
The high UV stability and high-performance formulations of optical brighteners represent significant opportunities for innovation in the optical brightener market. Unlike conventional optical brighteners that degrade quickly under irradiative UV light or high temperatures, narrowing their application in outdoor or high-performance applications. Recent advances in chemical engineering, though, allow for brighteners that resist UV light degradation, retaining their brightness and performance for long periods of time and in highly toxic environmental conditions. Such new formulations can help to meet the long-term aesthetic and durability requirements that are particularly critical for the use of PLA in outdoor textiles, automotive interiors, high-end packaging, and construction materials, respectively, driving the optical brighteners market trends.
Optical Brighteners Market Segmentation Analysis:
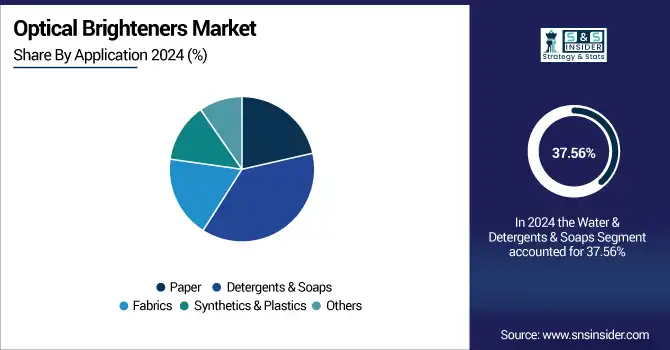
By Application
Detergents & Soaps held the largest optical brighteners market share, around 37.56%, in 2024. It is due to the large-scale use of these additives in household and industrial cleaning products in the year 2024. Optical brighteners are successfully added to laundry detergents, dishwashing liquids, and bar soaps for the appearance improvement of the outer surface of clothes or a dish, visually seen as whiter and cleaner under UV light. With the association of cleanliness with brightness, consumers in recent years started perceiving clean products to be working more efficiently, and manufacturers, capitalizing on this trend, are focusing on enhancing product performance and customer satisfaction.
Paper held a significant optical brighteners market share due to the high utilization of brighteners in improving the aesthetic characteristics of paper-based products. Optical brighteners are a compound added in the paper-making process that makes paper appear whiter, brighter, and higher contrast, thus making prints clearer and easier to read. These additives are particularly beneficial when manufacturing high-end printing & writing papers, magazines, packaging goods, and specialty papers.
By End Use
The consumer products segment held the largest market share, around 42%, in 2024. It is due to the high demand for visually enhanced goods in everyday household and personal care applications. Optical brighteners are used in a variety of locations, mostly to enhance the appearance of things with the idea that they make fabrics, surfaces, and skin appear to be cleaner and brighter, for example, in laundry detergents, soaps, cosmetics, and personal hygiene products. As brightness is a quality symbol and often associated with effectiveness, such additives tend to be incorporated by the manufacturers as value added feature.
Security & Safety hold a significant market share in the optical brighteners market. It is owing to the increasing adoption of fluorescent whitening agents compounds for the application of anti-counterfeiting, authentication, and visibility. Invisible marks, only visible in UV light, making use of optical brighteners, are frequently used in security inks, banknotes, passports, identity cards, and official documents as an efficient protection against forgery and fraud.
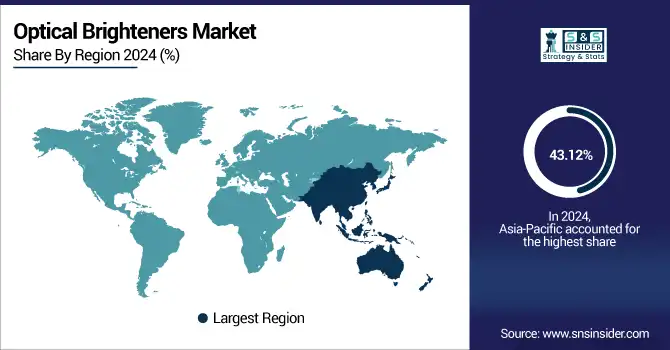
Optical Brighteners Market Regional Outlook:
Asia Pacific held the largest market share, around 43.12%, in 2024. Asia pacific optical brighteners market held a significant market share and is the fastest-growing segment in the forecast period. It is owing to the high growth rate for the personal care and cosmetics sectors in countries including China, India, South Korea, and Japan. The growth of optical brightening agent can be attributed to increasing disposable incomes, urbanization, and changing lifestyle patterns, enabling higher spending on skincare and beauty products, which in turn will contribute to the growth of optical brighteners in moisturizing, softening, and skin-conditioning formulations. Moreover, the high presence of a young population, rising acceptance of grooming products, and heating up of trends have aided the expansion of the market.
In October 2024, BASF formed a strategic partnership with a Southeast Asian chemical distributor to strengthen sustainable optical brightener product offerings and expand regional access.
North America optical brighteners market held a significant market share and is the fastest-growing segment in the forecast period. It is due highly developed industrial infrastructure of the region, and mature end-use industries of the region, including detergents, paper, plastics, and textiles. Some of the biggest household cleaning products and personal care, and specialty chemicals manufacturers are also present in this region, which use optical brighteners for the aesthetic appeal of their products and strong consumer interest. The rising consumer awareness and inclination for goods of superior quality, which look brighter and cleaner, has been yet another driver for the growth of demand.
The U.S. optical brighteners market size was USD 249 million in 2024 and is expected to reach USD 415 million by 2032 and grow at a CAGR of 6.58% over the forecast period of 2025-2032. It is owing to the presence of a solid manufacturing environment, a wide base of consumers, and significant consumption from numerous end-user industries. With the U.S. being one of the key producers and consumers of detergents, paper products, and plastics, there is a large and stable market for optical brighteners to improve the appearance and performance of products.
Europe held a significant market share in the forecast period. It is owing to the presence of an established industrial base, stringent regulations regarding quality standards, and high determination towards sustainability in the region. Optical brighteners are used in a variety of mature markets in the region, including textiles, paper manufacturing, and consumer goods, to render products more visually appealing and of higher quality. Premium textiles and specialty papers are important products that require high levels of brightness and whiteness, and they are produced in countries such as Germany, France, and Italy, where optical brighteners are critical.
Get Customized Report as per Your Business Requirement - Enquiry Now
Key Players:
The major optical brighteners companies are BASF SE, Huntsman Corporation, Archroma, Milliken & Company, Eastman Chemical Company, Clariant AG, 3V Sigma S.p.A., Blankophor GmbH & Co. KG, Sarex Chemicals, Deepak Nitrite Limited, and Others.
Recent Development:
-
In March 2024, Novonesis introduced Luminous, the first enzyme-based biodegradable optical brightener that enhances the whiteness of fabrics in ways that support sustainable laundry practices in line with the UN Sustainable Development Goals.
-
In March 2023, BASF SE increased production capacity for optical brighteners at its Monthey, Switzerland site to meet growing demand globally planned for completion in 2024.
| Report Attributes | Details |
|---|---|
| Market Size in 2024 | USD 1.72 Billion |
| Market Size by 2032 | USD 2.53 Billion |
| CAGR | CAGR of 4.97% From 2025 to 2032 |
| Base Year | 2024 |
| Forecast Period | 2025-2032 |
| Historical Data | 2021-2023 |
| Report Scope & Coverage | Market Size, Segments Analysis, Competitive Landscape, Regional Analysis, DROC & SWOT Analysis, Forecast Outlook |
| Key Segments | •By Application (Paper, Detergents & Soaps, Fabrics, Synthetics & Plastics, Others) •By End-Use (Consumer Products, Security & Safety, Textiles & Apparel, Packaging, Others) |
| Regional Analysis/Coverage | North America (US, Canada, Mexico), Europe (Germany, France, UK, Italy, Spain, Poland, Turkey, Rest of Europe), Asia Pacific (China, India, Japan, South Korea, Singapore, Australia, Rest of Asia Pacific), Middle East & Africa (UAE, Saudi Arabia, Qatar, South Africa, Rest of Middle East & Africa), Latin America (Brazil, Argentina, Rest of Latin America) |
| Company Profiles | BASF SE, Huntsman Corporation, Archroma, Milliken & Company, Eastman Chemical Company, Clariant AG, 3V Sigma S.p.A., Blankophor GmbH & Co. KG, Sarex Chemicals, Deepak Nitrite Limited. |
Frequently Asked Questions
Asia Pacific led the Optical Brighteners Market in the region with the highest revenue share in 2024.
Increasing use of plastics and polymers drives the market growth.
Detergents & Soaps will grow rapidly in the Optical Brighteners Market from 2025 to 2032.
The expected CAGR of the global Optical Brighteners Market during the forecast period is 4.97%.
The Optical Brighteners Market was valued at USD 1.72 billion in 2024.
Get in Touch
