Optical Measurement Market Scope & Overview:
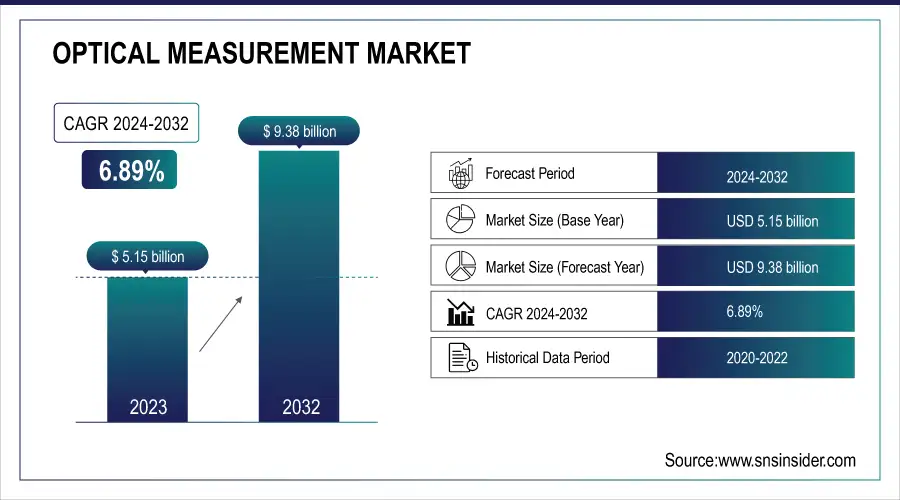
The Optical Measurement Market size was estimated at USD 5.15 billion in 2023 and is expected to reach USD 9.38 billion by 2032 at a CAGR of 6.89% during the forecast period of 2024-2032.
Optical measuring methods are used in various industries as a non-contact method that is often the fastest and most accurate. This method is very advantageous, and the devices can be applied to complete some challenging and quickly implemented tasks. The equipment has a benefit of real-time data transfers. As far as the devices are non-contact, the surface of the component under consideration will not be damaged. The technology is applied in a great number of areas ranging from assuring the quality of products to controlling vehicle speeds for road safety. The increasing demand for optical measuring instruments in the aerospace, automotive, military, medical, industrial, electronics manufacturing, energy, and power industries will propel market expansion. To keep mission-critical applications on track, the military Vertical demands precise measuring equipment that has undergone calibration and traceability scrutiny. Additionally, these instruments should comply with such bodies’ regulatory requirements standards like AS9100, ISO 9001, and their combinations to provide the most reliable and accurate metrology solutions.
To get more information on Optical Measurement Market - Request Free Sample Report
The several factors prompt the growth of the optical measurement market. The increasing complexity of manufactured products suggests a need for high-precision measurement solutions, which serves as an enabler for the adoption of advanced optical measurement systems. At the same time, the ongoing development of Industry 4.0 and smart manufacturing gives rise to the integration of optical measurement technologies into automated production lines, facilitating the improvement of efficiency and the reduction of human errors. In many cases, the goal of miniaturization set in electronics and medical devices dictates the high growth rate for the given market due to the need to ensure product quality and accuracy using measurement systems. The demand for integrated automation solutions is also increased through remarkable stringency of quality standards and norms applied in such large-scale industries as automotive and aerospace.
MARKET DYNAMICS
DRIVER
Technological progress in the future decade is not expected to slow down, given the constricted collaboration between different industries. These trends suggest a growing demand for various optical measurement systems, as witnessed in the rise of its markets.
The advancement of the optical measurement nowadays is induced by the developed of high-resolution cameras and innovative 3D scanning technology. Due to the technological breakthrough, the opportunities for the application of optical measurement have enlarged on the market both in the industrial and scientific spheres. The high-resolution cameras are improved in terms of the sensor, resolution, and image processing technology. Thus, the imaging is more vivid, clear, and distinct in details, therefore, the application range is broadened. Specifically, resolution and accuracy are highly required in industrial areas including manufacturing, medicine, and remote sensing. In such industries as aeronautics, automotive or electronics, high-resolution cameras are used for more precise component recognition and considerable decrease of defective objects in the flight or final products.
The 3D scanning technology is also upgraded in form of the rapid and precise three-dimensional design of an object. The laser or structured light captures the geometric details and provides profound images of an object. The latter is extremely important for industrial purposes such as reverse engineering, architecture, and virtual reality. The technology gives an opportunity to create digital models required for further improvements, control and examination in order to make it a reality. In such a way, the 3D scanning technology is used for more precise scientific investigation, analysis, and identification of multi-dimensional structures.
The increasing demand for such equipment originates from its market applications in industrial and scientific fields. The automotive and aerospace sectors are also expanding because of greater production rates and technology advancement.
The increasing demand for precise optical measurement systems is closely connected with the growing automotive and aerospace industries. The heightened production rates and rapid technological development observed in these segments explain the surge and the role of optical equipment in supporting them. Both automotive and aerospace producers witness an increased demand for a high level of production and the quality of the items they produce. With growing production rates, there is a need for the technologies that would facilitate a significant inspection and check of their characteristics at high precision and with minimal errors. Featuring a light-based technology, these systems measure dimensions, shapes and other characteristics of the objects they are directed at. A great advantage of these systems is the fact that they allow measurement without contact. It is imperative for many of the smaller and more intricate parts and devices produced in car engines, sensors, and safety systems. With the increased production, these units need to be tested and the optical measurement ensures they meet the necessary requirements. Similarly to the automotive industry, producers in the aerospace industry strive to speed up the production process and the increase in the production of aircraft leads to the increased demand for measurement of specific technical components.
It increased technological progress which has allowed the application of advanced sensors and the development of software, has further increased the opportunities and the scale of the use of optical measurement systems. On the one hand, they are able to provide the most accurate and reliable information. The manufacturers ensure efficiency and timeliness of these processes. The advantages are such that the automotive and aerospace industries, with their focus on increasing production rates and efforts to avoid errors in the process, prove to be the key segments causing the growing demand for precise and optical measurement systems in general.
RESTRAIN
The obstacle one may find with the adoption of advanced optical measurement systems is their high cost, which serves to hinder their adoption among small and medium-sized enterprises.
The primary contentious issue with the advanced optical measurement systems is their high initial cost that serves as a powerful barrier between the technology and adoption. This technology requires a considerable upfront payment to secure the installation and ever mounting procurement costs in the form of purchases of equipment to people with generally tight budgets, small and medium-sized enterprises. In summary, by being expensive to procure and furthermore requiring a considerable number of resources to be operational, this complicated system of sensors and tools serves to deny these businesses the opportunity to leverage their advantages in precision and performance. In turn, it limits their spread and cements a technological gap between setting corporations and smaller enterprises, hindering the effective rate of growth and innovation within the industries dependent on precise optical measurements.
KEY SEGMENTATION ANALYSIS
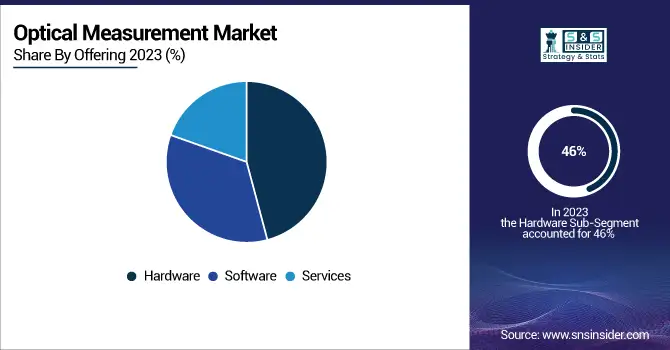
By Offering
The hardware segment dominated with a market share of over 46% in 2023. The different types of measuring instruments, cameras, optical sensors, etc., since, they are an essential part of the development of almost any system, make the functionality of the developed system possible to great extent. Furthermore, such devices are widely used in many industries, including automotive, aerospace, electronics, healthcare and many others, and the high demand is observed from one of the latter because extremely precise and highly reliable equipment is needed.
The software segment is currently fastest-growing segment in the Optical Measurement Market. It is associated with the growth of the competencies of the engines applied in the systems and the growing demand in integrating solutions. However, the software must become much more sophisticated to handle the tasks facing modern optical measurement systems.
By Component
The Video Measuring Machines segment held the largest market share in 2023 of more than 32%. The VMM’s have got a high degree of precision, can sample a variety of measurement points and perform multi-sensor inspection, and can do precisely and accurately that which they are designed to do. They are used widely in the manufacturing industry and quality inspection to handle the measurement of complex geometries. Therefore, they are dominating the microelectromechanical systems market.
Optical Digitizers and Scanners is the fastest growing segment in the market, as similar to VMM’s, the increasing demand for 3-dimensional scanning has increased the growth rate of ODS’s. The ODS’s form an important technology in the market and is used in the automotive and aerospace industries, manufacturing and electronics industries, R&D labs, and quality inspection departments.
By Vertical
The automotive industry dominated with a market share of over 34.08% in 2023. The reason for that is increasing usage of advanced driver assistance systems and autonomous cars, as well as tighter safety regulations. All those factors call for precise optical measurement tools to ensure the quality and performance of the systems and vehicles produced.
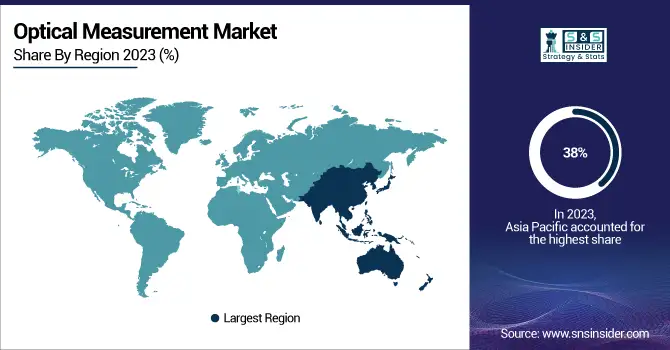
REGIONAL ANALYSIS
The Asia Pacific dominated the market with more than 38% in 2023. One of the reasons is the fast pace of the region’s industrialization pervading China, India, South Korea, and others. The industrial growth of those countries is immense and fuels the demand for precise measurement solutions. Additionally, the manufacturers are becoming more and more concerned with quality and are advocating reliable and steady, which is met by optical measurement technology. Finally, the governments of the majority of APAC countries recognize the value of technologies and innovation in the modern world and invest heavily in the advanced manufacturing sector, including the optical measurement market.
The North America will be the fastest-growing region in the optical measurement market. The first reason is the prevalence of technology companies on the continent, especially in the United States. Many technological developments, including optical measurement devices, are made in R&D in North America. The region also has both automotive and aerospace industries and both fields are major customers of optical measurement solutions.
Need any customization research on Optical Measurement Market - Enquiry Now
KEY PLAYERS
The major key players are Nikon Corporation,, Hexagon AB, Keysight Technologies Inc.., R&D Vision, AMETEK, Inc., Olympus Corporation, FARO Technologies Inc., Carl Zeiss AG,, Jenoptik AG, Keyence Corporation and others.
RECENT DEVELOPMENT
In January 2023: ZEISS acquired LENSO, one of the leading partners for 3D optical systems based in Poland. The main goal of the acquisition refers to the attempt to improve ZEISS’s position in the country and make it stronger on the market.
In November 2022: A transaction with RTDS Technologies, Inc., and Navitar was concluded by AMETEK, Inc. The value of this acquisition is USD 430 million. This acquisition helps AMETEK gain a unique position in those industries that are rapidly growing and adds more depth to its product line.
| Report Attributes | Details |
| Market Size in 2023 | US$ 5.15 Bn |
| Market Size by 2032 | US$ 9.38 Bn |
| CAGR | CAGR of 6.89% From 2024 to 2032 |
| Base Year | 2023 |
| Forecast Period | 2024-2032 |
| Historical Data | 2020-2022 |
| Report Scope & Coverage | Market Size, Segments Analysis, Competitive Landscape, Regional Analysis, DROC & SWOT Analysis, Forecast Outlook |
| Key Segments | • By Offering (Hardware, Camera, Lens and Sensors, Light Sources, Others, Software, Services, After Sales Services, Measurement Services) • By Component (Profile Projectors, Autocollimators, Measuring Microscopes, Video Measuring Machines, Optical Digitizers and Scanner) • By Vertical (Automotive, Aerospace & Defense, Energy and Power, Electronics Manufacturing, Industrial, Others) |
| Regional Analysis/Coverage | North America (US, Canada, Mexico), Europe (Eastern Europe [Poland, Romania, Hungary, Turkey, Rest of Eastern Europe] Western Europe] Germany, France, UK, Italy, Spain, Netherlands, Switzerland, Austria, Rest of Western Europe]), Asia Pacific (China, India, Japan, South Korea, Vietnam, Singapore, Australia, Rest of Asia Pacific), Middle East & Africa (Middle East [UAE, Egypt, Saudi Arabia, Qatar, Rest of Middle East], Africa [Nigeria, South Africa, Rest of Africa], Latin America (Brazil, Argentina, Colombia Rest of Latin America) |
| Company Profiles | Nikon Corporation, Hexagon AB, Keysight Technologies Inc., R&D Vision, AMETEK, Inc., Olympus Corporation, FARO Technologies Inc., Carl Zeiss AG, Jenoptik AG, and Keyence Corporation |
| Key Drivers | • Technological progress in the future decade is not expected to slow down, given the constricted collaboration between different industries. These trends suggest a growing demand for various optical measurement systems, as witnessed in the rise of its markets.
• The increasing demand for such equipment originates from its market applications in industrial and scientific fields. The automotive and aerospace sectors are also expanding because of greater production rates and technology advancement. |
| Market Restrain | • The obstacle one may find with the adoption of advanced optical measurement systems is their high cost, which serves to hinder their adoption among small and medium-sized enterprises. |
Frequently Asked Questions
Ans: Asia-Pacific is the dominating region in the Optical Measurement Market.
Ans: Technological progress in the future decade is not expected to slow down, given the constricted collaboration between different industries. These trends suggest a growing demand for various optical measurement systems, as witnessed in the rise of its markets.
Ans: Hardware is the dominating segment by offering capacity in the Optical Measurement Market.
Ans: Optical Measurement Market size was USD 5.15 Billion in 2023 and is expected to Reach USD 9.38 Billion by 2032.
Ans: The Optical Measurement Market is expected to grow at a CAGR of 6.89%.
Get in Touch
