Optical Test Equipment Market Report Scope & Overview:

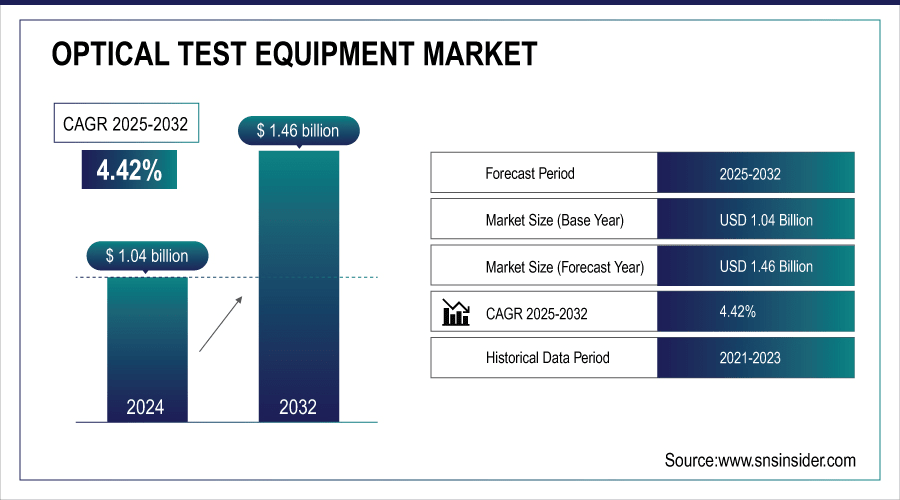
The Optical Test Equipment Market size was valued at USD 1.04 billion in 2024 and is expected to reach USD 1.46 billion by 2032 and grow at a CAGR of 4.42% over the forecast period of 2025-2032.

The global market is segmented into regional, type, application, technology and end user segments, further substantiated by market dynamics, competitive landscape and industry trends associated with it. Driving growth are the growing need for high capacity communication networks, proliferation of fiber, and greater adoption of advanced optical technologies in data center, telecom & defense. All such factors together are expected to boost innovation and transmission capabilities which will provide a stronger growth environment for the optical test equipment market during the forecast period.

For instance, adoption of AI-enabled optical test equipment has increased by 42% in data centers, enhancing testing speed and accuracy for high-capacity fiber networks.

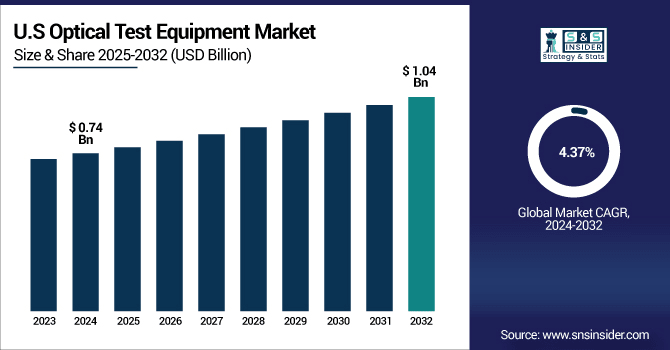
The U.S. Optical Test Equipment Market size was USD 0.74 billion in 2024 and is expected to reach USD 1.04 billion by 2032, growing at a CAGR of 4.37% over the forecast period of 2025–2032.

The U.S. market is propelled by the continued fiber network upgrades, explosive 5G rollouts, and growing need for high-speed data transport in both enterprise and consumer segments. Demand for data center infrastructure, along with high testing requirements in defense and aerospace, also drives the growth. Moreover, implementation of highly sophisticated testing tools to cater the rising complex nature of network environment, further improves the efficiency and reliability of overall operations, thereby confirming the establishing the country among prominent leaders in optical test equipment market.

For instance, integration of AI-driven optical test systems in defense and aerospace applications has grown by 40%, strengthening operational reliability and precision in complex network environments.

Market Dynamics:

Key Drivers:

  • Rising Fiber-Optic Network Deployments and 5G Infrastructure Expansion Driving Optical Test Equipment Demand Globally

Increase in demand for higher capacity of broadband services and rollout of 5G services has accelerated the installation of fiber-optic network across various regions. Optical test equipment is essential for performance, reliability, and quality during deployment and maintenance. Investment in ancient OTDR, Optical Power Meters and Spectrum Analysers, by service providers is on the high for ensuring network optimization and lessen downtime. Furthermore, the incorporation of IoT and cloud computing also drives the demand for high-precision testing tools that can cater to the growing complexities, high speed, and low latency of network architectures in developed and developing economies.

For instance, adoption of AI-driven optical transceiver testers has risen by 39%, accelerating validation of high-capacity data center and telecom equipment.

Restraints:

  • High Equipment Costs Limiting Adoption in Small-Scale Enterprises and Developing Economies

Optical test equipment commonly features advanced capabilities but is often prohibitively expensive to acquire and support, making it out of reach for many of the emerging networked-based telecom operators and enterprises in today′ s markets. In such settings, believed that budgetary constraints render the use of outdated testing methods, which lowers the accuracy and efficiency of testing. The cost barrier also hinders modernization at research institutions or among smaller service providers. Specific application requirements contribute to higher operational costs through a need for frequent calibration and training of skilled technicians — two factors that make widespread adoption especially difficult at the lower end of the market.

Opportunities:

  • Technological Advancements in Optical Testing Enabling Higher Precision and Automation Capabilities

New technologies such as artificial intelligence (AI)-driven analytics, remote monitoring, and automated fault-detection are transforming the optical test equipment space. These innovations improve the accuracy of testing, minimize human error, and fasten the troubleshooting process. By integrating cloud-based platforms, this offers greater capabilities towards data analysis and reporting in real-time thus enabling predictive maintenance through telemetry data in advance and making data center and telecom environments more agile. As the demand for 5G and FTTH projects continues to grow rapidly, more equipment manufacturers are seeking opportunities to implement high levels of operational efficiency within their testing solutions by creating smart, connected and easy-to-use test solutions that offer convenient deployment cycles.

For instance, integration of cloud-based optical test platforms has grown by 40%, enabling real-time data analysis, predictive maintenance, and agile operations for high-capacity networks.

Challenges:

  • Short Product Lifecycles and Rapid Technological Obsolescence Affecting Return on Investment

Rapid innovation in optical communication technologies entails more frequent product upgrades, which means that existing equipment will become obsolete earlier. Service providers and enterprises often find it challenging to recuperate their investments before they need to invest in the next advanced model. This has forced organisations to continually replenish budgets assigned for equipment upgrades also putting pressure on capital expenditure budgets. The inability to keep up with technology changes can lead to decreased competitiveness, inferior service quality and lost opportunities in higher growth market segments for smaller players.

Segmentation Analysis:

By Type

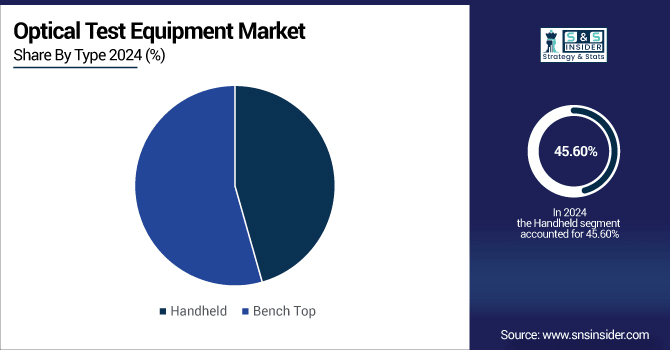
In 2024, handheld devices accounted for a dominant share of 45.60% of the Optical Test Equipment Market, due to its portability, affordability, and ease in network maintenance integration. Telecom service providers are getting highly attracted towards these devices for their FTTH installations, troubleshooting, and quick diagnostics. Several manufacturers including EXFO Inc. have developed cutting-edge, miniaturized, and portable solutions that consistently provide accurate results over robust hardware built to endure harsh environments in the face of ever-expanding telecom, broadband, and private network domains.

The Bench Top devices are projected to show the fastest growth with CAGR of 4.54% during 2024–2032, owing to high-end functionalities, better accuracy, and use for complex testing requirements. These are extensively used in manufacturing, R&D, and high-precision lab environments where fine optical measurements are needed. As demand for high-capacity network infrastructure and next-generation optical technologies is increasing, Keysight Technologies is extending its bench-top portfolio to multi-parameter testing and quality inspection.

By Application

In 2024, Telecom and Broadband dominated the market, accounting for 40.20% market share and is fastest-growing application with a 5.20% CAGR during 2024–2032, due to wide fibre-optic deployment, fast 5G expansion, and a rising broadband penetration rate globally. Demand for reliable high-speed connectivity is ever-increasing, making fuels this segment by constant infrastructure up gradation. Viavi Solutions has made a significant contribution by developing telecom and broadband test equipment, facilitating the proper installation, maintenance, and optimization of extensive network systems.

By Technology

In 2024, OTDRs held a 35.20% share of the technology segment due to their crucial functionality in identifying faults in fiber-optic cables, certifying networks, and validation of performance. Telecom operators favor the tool due to its quick detection of breaks, bends, and splices with high accuracy. Yokogawa Electric Corporation: Yokogawa is a leader in innovating behind optical time domain reflectometer (OTDR) systems that can now test single-mode and multi-mode fibers.

Optical Spectrum Analyzers are expected to witness the fastest Compound Annual Growth Rate (CAGR) of 5.48% during 2024–2032, owing to their essential role in wavelength division multiplexing (WDM) systems, and high-capacity optical networks. Such analyzers allow accurate measurements of channel wavelength, power, and channel spacing. Thorlabs Inc. is adding an analyzer range to its high-speed optical single-ended analyzer portfolio that addresses the demanding performance needs found in telecom and data center applications at 400G and higher transmission rates.

By End-User

Data Centers & Enterprises led the market in 2024 with a 45.24% share, driven by accelerated cloud adoption, hyperscale facility deployments, and increasing demand for secure high-speed optical connectivity. Optical test equipment is essential for these facilities to minimize and maximize performance. Fluke Networks is a trusted leader in network testing solutions that serve the enterprise-scale needs of today with AI, big data and latency-sensitive applications.

Government & Defense are anticipated to witness the fastest CAGR of 5.50% during 2024–2032 owing to adequate demands for secure and resilient communication networks. Adoption is being spurred by national broadband initiatives, military communication evolution and cybersecurity demands. AFL (A Furukawa Company) provides high-performance bespoke optical test solutions for tactical networks, satellite communication and mission-critical defence applications.

Regional Analysis:

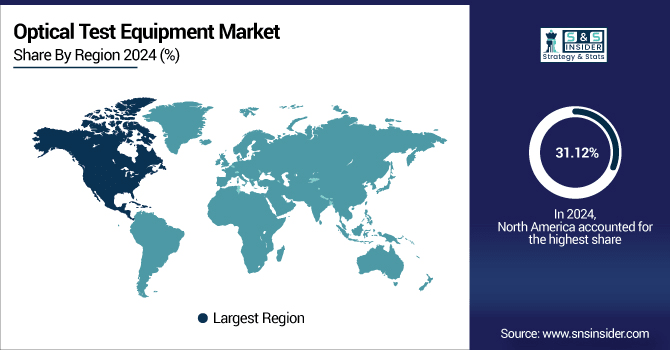
In 2024, North America accounted for biggest market share of optical test instruments Market, with 31.12% market share in the region that year, mainly due to well-developed telecom foundation, competent R technician surrounding, and prepared taking of 5 g in the region. The region has a significant set of data middle business and continuous expenditure in the broadband expansion, further more providing a tough collection to the optical test instruments Market in region. Moreover, U.S.-based key optical testing solution providers carry on technological advancements and competitive growth into the regional market.

  • The U.S. dominates the North American Optical Test Equipment Market due to advanced telecom infrastructure, rapid 5G rollouts, and large-scale data center expansion, supported by strong R&D capabilities and presence of leading industry players driving continuous innovation.

Asia Pacific is anticipated to be the fastest-growing region during 2024–2032 at a CAGR of 5.45% owing to rapid urbanization and the increasing number of broadband connections across the major economies such as China, India, U.S. & Japan among others combined with the large scale fiber deployment. Ramp-up Fiber Testing Demand due to Government-driven Digitalization Initiatives and Private Investment on 5G, FTTH Solution and Hyperscale Data Center Adoption in both urban and rural infrastructure projects continues to speed up, due to a strong manufacturing base in the region, and an ever-growing telecom subscriber base.

  • China leads the Asia Pacific market owing to massive fiber-optic network deployments, government-backed digital transformation initiatives, and rapid 5G adoption, coupled with significant manufacturing capacity and strong presence of domestic optical technology companies fueling market growth.

Europe’s optical test equipment market is driven by the region’s strong telecommunications infrastructure, increasing adoption of high-speed fiber networks, and growing investments in 5G and data center deployments. Advanced research initiatives, stringent quality standards, and rising demand from automotive and healthcare optics sectors further support market growth. Key players such as Thorlabs and EXFO are actively expanding their regional footprint to meet evolving needs.

  • Germany dominates Europe’s optical test equipment market due to its strong photonics industry, high R&D investments, advanced manufacturing infrastructure, and presence of leading optical equipment manufacturers, driving significant domestic demand and establishing the country as a regional technology leader.

In the Middle East & Africa, the UAE leads the optical test equipment market with strong investments in telecom infrastructure and smart city projects. Similarly, in Latin America, Brazil dominates due to expanding digital networks, government initiatives, and rising demand for advanced optical testing in data centers and enterprises.

Key Players:

Major Key Players in optical test equipment companies are VIAVI Solutions Inc., EXFO Inc., Anritsu Corporation, Keysight Technologies, Inc., Yokogawa Electric Corporation, AFL (Fujikura Ltd.), Tektronix, Inc., Fluke Networks, Corning Incorporated, OptoTest Corporation, JDSU, Kingfisher International, Thorlabs, Inc., OZ Optics Limited, Finisar Corporation, VeEX Inc., Lumentum Holdings Inc., Senko Advanced Components, Inc., Optronic Laboratories, Inc. and Fiber Instrument Sales, Inc and others.

Recent Developments:

  • In January 2024, VIAVI Solutions emphasized AI-driven network automation and Open RAN testing solutions, addressing the growing demand for 5G Standalone deployments and smart network monitoring.

  • In March 2024, EXFO showcased advanced AI-enabled optical test solutions at OFC 2024, focusing on photonic integrated circuit (PIC) testing and 400/800G transceiver validation for data centers.

Optical Test Equipment Market Report Scope:

Report Attributes Details
Market Size in 2024 USD 1.04 Billion 
Market Size by 2032 USD 1.46 Billion 
CAGR CAGR of 4.42% From 2025 to 2032
Base Year 2024
Forecast Period 2025-2032
Historical Data 2021-2023
Report Scope & Coverage Market Size, Segments Analysis, Competitive Landscape, Regional Analysis, DROC & SWOT Analysis, Forecast Outlook
Key Segments • By Type (Handheld and Bench Top)
• By Application (Telecom and Broadband, Oil and Gas, Private Data Network, Cable Television, Military & Aerospace and Other)
• By Technology (OTDR, Optical Spectrum Analyzers, Optical Power Meters and Others)
• By End-User (Enterprises & Data Centers, Government & Defense and Research & Educational Institutes)
Regional Analysis/Coverage North America (US, Canada, Mexico), Europe (Germany, France, UK, Italy, Spain, Poland, Turkey, Rest of Europe), Asia Pacific (China, India, Japan, South Korea, Singapore, Australia,Taiwan, Rest of Asia Pacific), Middle East & Africa (UAE, Saudi Arabia, Qatar, South Africa, Rest of Middle East & Africa), Latin America (Brazil, Argentina, Rest of Latin America)
Company Profiles VIAVI Solutions Inc., EXFO Inc., Anritsu Corporation, Keysight Technologies, Inc., Yokogawa Electric Corporation, AFL (Fujikura Ltd.), Tektronix, Inc., Fluke Networks, Corning Incorporated, OptoTest Corporation, JDSU , Kingfisher International, Thorlabs, Inc., OZ Optics Limited, Finisar Corporation, VeEX Inc., Lumentum Holdings Inc., Senko Advanced Components, Inc., Optronic Laboratories, Inc. and Fiber Instrument Sales, Inc.

Table Of Contents

1. Introduction

1.1 Market Definition & Scope

 1.2 Research Assumptions & Abbreviations

 1.3 Research Methodology

2. Executive Summary

2.1 Market Snapshot

 2.2 Market Absolute $ Opportunity Assessment & Y-o-Y Analysis, 2021–2032

 2.3 Market Size & Forecast, By Segmentation, 2021–2032

  2.3.1 Market Size By Type

  2.3.2 Market Size By Application

         2.3.3 Market Size By Technology

         2.3.4 Market Size By End-User

 2.4 Market Share & Bps Analysis By Region, 2024

 2.5 Industry Growth Scenarios – Conservative, Likely & Optimistic

 2.6 Industry CxO’s Perspective

3. Market Overview

3.1 Market Dynamics

  3.1.1 Drivers

  3.1.2 Restraints

  3.1.3 Opportunities

  3.1.4 Key Market Trends

 3.2 Industry PESTLE Analysis

 3.3 Key Industry Forces (Porter’s) Impacting Market Growth

 3.4 Industry Supply Chain Analysis

  3.4.1 Raw Material Suppliers

  3.4.2 Manufacturers

  3.4.3 Distributors/Suppliers

  3.4.4 Customers/End-Users

 3.5 Industry Life Cycle Assessment

 3.6 Parent Market Overview

 3.7 Market Risk Assessment

4. Statistical Insights & Trends Reporting

4.1 Pricing Analysis & Forecast

4.1.1 Overview

4.1.2 Pricing Analysis & Forecast By Product

4.1.3 Price Benchmarking By Key Players

4.2 Production & Manufacturing Statistics

4.2.1 Overview

4.2.2 Production Volume By Region

4.2.3 Manufacturing Capacity Utilization Rate

4.3 R&D Investment Trends

4.3.1 Overview

4.3.2 R&D Spending By Key Players

4.3.3 Emerging Technology Development Areas

4.4 Deployment Speed Metrics

4.4.1 Overview

4.4.2 Average Testing & Certification Time By Application

4.4.3 Regional Comparison of Deployment Speeds

4.5 Failure Rate & Accuracy Data

4.5.1 Overview

4.5.2 Failure Rates By Equipment Type

4.5.3 Accuracy Benchmarking Across Key Technologies

5. Optical Test Equipment Market Segmental Analysis & Forecast, By Type, 2021 – 2032, Value (Usd Billion)

5.1 Introduction

 5.2 Handheld

  5.2.1 Key Trends

  5.2.2 Market Size & Forecast, 2021 – 2032

 5.3 Benchtop

  5.3.1 Key Trends

  5.3.2 Market Size & Forecast, 2021 – 2032

6. Optical Test Equipment Market Segmental Analysis & Forecast, By Application, 2021 – 2032, Value (Usd Billion)

    6.1 Introduction

 6.2 Telecom and Broadband

  6.2.1 Key Trends

  6.2.2 Market Size & Forecast, 2021 – 2032

 6.3 Oil and Gas

  6.3.1 Key Trends

  6.3.2 Market Size & Forecast, 2021 – 2032

 6.4 Private Data Network

  6.4.1 Key Trends

  6.4.2 Market Size & Forecast, 2021 – 2032

     6.5 Cable Television

  6.5.1 Key Trends

  6.5.2 Market Size & Forecast, 2021 – 2032

     6.6 Military and Aerospace

  6.6.1 Key Trends

  6.6.2 Market Size & Forecast, 2021 – 2032

    6.7 Others

  6.7.1 Key Trends

  6.7.2 Market Size & Forecast, 2021 – 2032

7. Optical Test Equipment Market Segmental Analysis & Forecast, By Technology, 2021 – 2032, Value (Usd Billion)

    7.1 Introduction

 7.2 OTDR 

  7.2.1 Key Trends

  7.2.2 Market Size & Forecast, 2021 – 2032

 7.3 Optical Spectrum Analyzers

  7.3.1 Key Trends

  7.3.2 Market Size & Forecast, 2021 – 2032

 7.4 Optical Power Meters

  7.4.1 Key Trends

  7.4.2 Market Size & Forecast, 2021 – 2032

    7.5 Others

  7.5.1 Key Trends

  7.5.2 Market Size & Forecast, 2021 – 2032

8. Optical Test Equipment Market Segmental Analysis & Forecast, By End-User, 2021 – 2032, Value (Usd Billion)

    8.1 Introduction

 8.2 Enterprises & Data Centers

  8.2.1 Key Trends

  8.2.2 Market Size & Forecast, 2021 – 2032

 8.3 Government & Defense 

  8.3.1 Key Trends

  8.3.2 Market Size & Forecast, 2021 – 2032

  8.4 Research & Educational Institutes

  8.4.1 Key Trends

  8.4.2 Market Size & Forecast, 2021 – 2032

9. Optical Test Equipment Market Segmental Analysis & Forecast By Region, 2021 – 2025, Value (Usd Billion)

9.1 Introduction

9.2 North America

 9.2.1 Key Trends

 9.2.2 Optical Test Equipment Market Size & Forecast, By Type, 2021 – 2032

 9.2.3 Optical Test Equipment Market Size & Forecast, By Application, 2021 – 2032

 9.2.4 Optical Test Equipment Market Size & Forecast, By Technology, 2021 – 2032

 9.2.5 Optical Test Equipment Market Size & Forecast, By End-User, 2021 – 2032

 9.2.6 Optical Test Equipment Market Size & Forecast, By Country, 2021 – 2032

  9.2.6.1 USA

   9.2.6.1.1 Optical Test Equipment Market Size & Forecast, By Type, 2021 – 2032

   9.2.6.1.2 Optical Test Equipment Market Size & Forecast, By Application, 2021 – 2032

   9.2.6.1.3 Optical Test Equipment Market Size & Forecast, By Technology, 2021 – 2032

   9.2.6.1.4 Optical Test Equipment Market Size & Forecast, By End-User, 2021 – 2032

  9.2.6.2 Canada

   9.2.6.2.1 Optical Test Equipment Market Size & Forecast, By Type, 2021 – 2032

   9.2.6.2.2 Optical Test Equipment Market Size & Forecast, By Application, 2021 – 2032

   9.2.6.2.3 Optical Test Equipment Market Size & Forecast, By Technology, 2021 – 2032

   9.2.6.2.4 Optical Test Equipment Market Size & Forecast, By End-User, 2021 – 2032

9.3 Europe

 9.3.1 Key Trends

 9.3.2 Optical Test Equipment Market Size & Forecast, By Type, 2021 – 2032

 9.3.3 Optical Test Equipment Market Size & Forecast, By Application, 2021 – 2032

 9.3.4 Optical Test Equipment Market Size & Forecast, By Technology, 2021 – 2032

 9.3.5 Optical Test Equipment Market Size & Forecast, By End-User, 2021 – 2032

 9.3.6 Optical Test Equipment Market Size & Forecast, By Country, 2021 – 2032

  9.3.6.1 Germany

   9.3.6.1.1 Optical Test Equipment Market Size & Forecast, By Type, 2021 – 2032

   9.3.6.1.2 Optical Test Equipment Market Size & Forecast, By Application, 2021 – 2032

   9.3.6.1.3 Optical Test Equipment Market Size & Forecast, By Technology, 2021 – 2032

   9.3.6.1.4 Optical Test Equipment Market Size & Forecast, By End-User, 2021 – 2032

  9.3.6.2 UK

   9.3.6.2.1 Optical Test Equipment Market Size & Forecast, By Type, 2021 – 2032

   9.3.6.2.2 Optical Test Equipment Market Size & Forecast, By Application, 2021 – 2032

   9.3.6.2.3 Optical Test Equipment Market Size & Forecast, By Technology, 2021 – 2032

   9.3.6.2.4 Optical Test Equipment Market Size & Forecast, By End-User, 2021 – 2032

  9.3.6.3 France

   9.3.6.3.1 Optical Test Equipment Market Size & Forecast, By Type, 2021 – 2032

   9.3.6.3.2 Optical Test Equipment Market Size & Forecast, By Application, 2021 – 2032

   9.3.6.3.3 Optical Test Equipment Market Size & Forecast, By Technology, 2021 – 2032

   9.3.6.3.4 Optical Test Equipment Market Size & Forecast, By End-User, 2021 – 2032

  9.3.6.4 Italy

   9.3.6.4.1 Optical Test Equipment Market Size & Forecast, By Type, 2021 – 2032

   9.3.6.4.2 Optical Test Equipment Market Size & Forecast, By Application, 2021 – 2032

   9.3.6.4.3 Optical Test Equipment Market Size & Forecast, By Technology, 2021 – 2032

   9.3.6.4.4 Optical Test Equipment Market Size & Forecast, By End-User, 2021 – 2032

  9.3.6.5 Spain

   9.3.6.5.1 Optical Test Equipment Market Size & Forecast, By Type, 2021 – 2032

   9.3.6.5.2 Optical Test Equipment Market Size & Forecast, By Application, 2021 – 2032

   9.3.6.5.3 Optical Test Equipment Market Size & Forecast, By Technology, 2021 – 2032

   9.3.6.5.4 Optical Test Equipment Market Size & Forecast, By End-User, 2021 – 2032

  9.3.6.6 Russia

   9.3.6.6.1 Optical Test Equipment Market Size & Forecast, By Type, 2021 – 2032

   9.3.6.6.2 Optical Test Equipment Market Size & Forecast, By Application, 2021 – 2032

   9.3.6.6.3 Optical Test Equipment Market Size & Forecast, By Technology, 2021 – 2032

   9.3.6.6.4 Optical Test Equipment Market Size & Forecast, By End-User, 2021 – 2032

  9.3.6.7 Poland

   9.3.6.7.1 Optical Test Equipment Market Size & Forecast, By Type, 2021 – 2032

   9.3.6.7.2 Optical Test Equipment Market Size & Forecast, By Application, 2021 – 2032

   9.3.6.7.3 Optical Test Equipment Market Size & Forecast, By Technology, 2021 – 2032

   9.3.6.7.4 Optical Test Equipment Market Size & Forecast, By End-User, 2021 – 2032

  9.3.6.8 Rest of Europe

   9.3.6.8.1 Optical Test Equipment Market Size & Forecast, By Type, 2021 – 2032

   9.3.6.8.2 Optical Test Equipment Market Size & Forecast, By Application, 2021 – 2032

   9.3.6.8.3 Optical Test Equipment Market Size & Forecast, By Technology, 2021 – 2032

   9.3.6.8.4 Optical Test Equipment Market Size & Forecast, By End-User, 2021 – 2032   

9.4 Asia-Pacific

 9.4.1 Key Trends

 9.4.2 Optical Test Equipment Market Size & Forecast, By Type, 2021 – 2032

 9.4.3 Optical Test Equipment Market Size & Forecast, By Application, 2021 – 2032

 9.4.4 Optical Test Equipment Market Size & Forecast, By Technology, 2021 – 2032

 9.4.5 Optical Test Equipment Market Size & Forecast, By End-User, 2021 – 2032

 9.4.6 Optical Test Equipment Market Size & Forecast, By Country, 2021 – 2032

  9.4.6.1 China

   9.4.6.1.1 Optical Test Equipment Market Size & Forecast, By Type, 2021 – 2032

   9.4.6.1.2 Optical Test Equipment Market Size & Forecast, By Application, 2021 – 2032

   9.4.6.1.3 Optical Test Equipment Market Size & Forecast, By Technology, 2021 – 2032

   9.4.6.1.4 Optical Test Equipment Market Size & Forecast, By End-User, 2021 – 2032

  9.4.6.2 India

   9.4.6.2.1 Optical Test Equipment Market Size & Forecast, By Type, 2021 – 2032

   9.4.6.2.2 Optical Test Equipment Market Size & Forecast, By Application, 2021 – 2032

   9.4.6.2.3 Optical Test Equipment Market Size & Forecast, By Technology, 2021 – 2032

   9.4.6.2.4 Optical Test Equipment Market Size & Forecast, By End-User, 2021 – 2032

  9.4.6.3 Japan

   9.4.6.3.1 Optical Test Equipment Market Size & Forecast, By Type, 2021 – 2032

   9.4.6.3.2 Optical Test Equipment Market Size & Forecast, By Application, 2021 – 2032

   9.4.6.3.3 Optical Test Equipment Market Size & Forecast, By Technology, 2021 – 2032

   9.4.6.3.4 Optical Test Equipment Market Size & Forecast, By End-User, 2021 – 2032

  9.4.6.4 South Korea

   9.4.6.4.1 Optical Test Equipment Market Size & Forecast, By Type, 2021 – 2032

   9.4.6.4.2 Optical Test Equipment Market Size & Forecast, By Application, 2021 – 2032

   9.4.6.4.3 Optical Test Equipment Market Size & Forecast, By Technology, 2021 – 2032

   9.4.6.4.4 Optical Test Equipment Market Size & Forecast, By End-User, 2021 – 2032

  9.4.6.5 Australia

   9.4.6.5.1 Optical Test Equipment Market Size & Forecast, By Type, 2021 – 2032

   9.4.6.5.2 Optical Test Equipment Market Size & Forecast, By Application, 2021 – 2032

   9.4.6.5.3 Optical Test Equipment Market Size & Forecast, By Technology, 2021 – 2032

   9.4.6.5.4 Optical Test Equipment Market Size & Forecast, By End-User, 2021 – 2032

  9.4.6.6 ASEAN Countries

   9.4.6.6.1 Optical Test Equipment Market Size & Forecast, By Type, 2021 – 2032

   9.4.6.6.2 Optical Test Equipment Market Size & Forecast, By Application, 2021 – 2032

   9.4.6.6.3 Optical Test Equipment Market Size & Forecast, By Technology, 2021 – 2032

   9.4.6.6.4 Optical Test Equipment Market Size & Forecast, By End-User, 2021 – 2032

  9.4.6.7 Rest of Asia-Pacific

   9.4.6.7.1 Optical Test Equipment Market Size & Forecast, By Type, 2021 – 2032

   9.4.6.7.2 Optical Test Equipment Market Size & Forecast, By Application, 2021 – 2032

   9.4.6.7.3 Optical Test Equipment Market Size & Forecast, By Technology, 2021 – 2032

   9.4.6.7.4 Optical Test Equipment Market Size & Forecast, By End-User, 2021 – 2032

9.5 Latin America

 9.5.1 Key Trends

 9.5.2 Optical Test Equipment Market Size & Forecast, By Type, 2021 – 2032

 9.5.3 Optical Test Equipment Market Size & Forecast, By Application, 2021 – 2032

 9.5.4 Optical Test Equipment Market Size & Forecast, By Technology, 2021 – 2032

 9.5.5 Optical Test Equipment Market Size & Forecast, By End-User, 2021 – 2032

 9.5.6 Optical Test Equipment Market Size & Forecast, By Country, 2021 – 2032

  9.5.6.1 Brazil

   9.5.6.1.1 Optical Test Equipment Market Size & Forecast, By Type, 2021 – 2032

   9.5.6.1.2 Optical Test Equipment Market Size & Forecast, By Application, 2021 – 2032

   9.5.6.1.3 Optical Test Equipment Market Size & Forecast, By Technology, 2021 – 2032

   9.5.6.1.4 Optical Test Equipment Market Size & Forecast, By End-User, 2021 – 2032

  9.5.6.2 Argentina

   9.5.6.2.1 Optical Test Equipment Market Size & Forecast, By Type, 2021 – 2032

   9.5.6.2.2 Optical Test Equipment Market Size & Forecast, By Application, 2021 – 2032

   9.5.6.2.3 Optical Test Equipment Market Size & Forecast, By Technology, 2021 – 2032

   9.5.6.2.4 Optical Test Equipment Market Size & Forecast, By End-User, 2021 – 2032

  9.5.6.3 Mexico

   9.5.6.3.1 Optical Test Equipment Market Size & Forecast, By Type, 2021 – 2032

   9.5.6.3.2 Optical Test Equipment Market Size & Forecast, By Application, 2021 – 2032

   9.5.6.3.3 Optical Test Equipment Market Size & Forecast, By Technology, 2021 – 2032

   9.5.6.3.4 Optical Test Equipment Market Size & Forecast, By End-User, 2021 – 2032

  9.5.6.4 Colombia

   9.5.6.4.1 Optical Test Equipment Market Size & Forecast, By Type, 2021 – 2032

   9.5.6.4.2 Optical Test Equipment Market Size & Forecast, By Application, 2021 – 2032

   9.5.6.4.3 Optical Test Equipment Market Size & Forecast, By Technology, 2021 – 2032

   9.5.6.4.4 Optical Test Equipment Market Size & Forecast, By End-User, 2021 – 2032

  9.5.6.5 Rest of Latin America

   9.5.6.5.1 Optical Test Equipment Market Size & Forecast, By Type, 2021 – 2032

   9.5.6.5.2 Optical Test Equipment Market Size & Forecast, By Application, 2021 – 2032

   9.5.6.5.3 Optical Test Equipment Market Size & Forecast, By Technology, 2021 – 2032

   9.5.6.5.4 Optical Test Equipment Market Size & Forecast, By End-User, 2021 – 2032

9.6 Middle East & Africa

 9.6.1 Key Trends

 9.6.2 Optical Test Equipment Market Size & Forecast, By Type, 2021 – 2032

 9.6.3 Optical Test Equipment Market Size & Forecast, By Application, 2021 – 2032

 9.6.4 Optical Test Equipment Market Size & Forecast, By Technology, 2021 – 2032

 9.6.5 Optical Test Equipment Market Size & Forecast, By End-User, 2021 – 2032

 9.6.6 Optical Test Equipment Market Size & Forecast, By Country, 2021 – 2032

  9.6.6.1 UAE

   9.6.6.1.1 Optical Test Equipment Market Size & Forecast, By Type, 2021 – 2032

   9.6.6.1.2 Optical Test Equipment Market Size & Forecast, By Application, 2021 – 2032

   9.6.6.1.3 Optical Test Equipment Market Size & Forecast, By Technology, 2021 – 2032

   9.6.6.1.4 Optical Test Equipment Market Size & Forecast, By End-User, 2021 – 2032

  9.6.6.2 Saudi Arabia

   9.6.6.2.1 Optical Test Equipment Market Size & Forecast, By Type, 2021 – 2032

   9.6.6.2.2 Optical Test Equipment Market Size & Forecast, By Application, 2021 – 2032

   9.6.6.2.3 Optical Test Equipment Market Size & Forecast, By Technology, 2021 – 2032

   9.6.6.2.4 Optical Test Equipment Market Size & Forecast, By End-User, 2021 – 2032

  9.6.6.3 Qatar

   9.6.6.3.1 Optical Test Equipment Market Size & Forecast, By Type, 2021 – 2032

   9.6.6.3.2 Optical Test Equipment Market Size & Forecast, By Application, 2021 – 2032

   9.6.6.3.3 Optical Test Equipment Market Size & Forecast, By Technology, 2021 – 2032

   9.6.6.3.4 Optical Test Equipment Market Size & Forecast, By End-User, 2021 – 2032

  9.6.6.4 Egypt

   9.6.6.4.1 Optical Test Equipment Market Size & Forecast, By Type, 2021 – 2032

   9.6.6.4.2 Optical Test Equipment Market Size & Forecast, By Application, 2021 – 2032

   9.6.6.4.3 Optical Test Equipment Market Size & Forecast, By Technology, 2021 – 2032

   9.6.6.4.4 Optical Test Equipment Market Size & Forecast, By End-User, 2021 – 2032

  9.6.6.5 South Africa

   9.6.6.5.1 Optical Test Equipment Market Size & Forecast, By Type, 2021 – 2032

   9.6.6.5.2 Optical Test Equipment Market Size & Forecast, By Application, 2021 – 2032

   9.6.6.5.3 Optical Test Equipment Market Size & Forecast, By Technology, 2021 – 2032

   9.6.6.5.4 Optical Test Equipment Market Size & Forecast, By End-User, 2021 – 2032

  9.6.6.6 Rest of Middle East & Africa

   9.6.6.6.1 Optical Test Equipment Market Size & Forecast, By Type, 2021 – 2032

   9.6.6.6.2 Optical Test Equipment Market Size & Forecast, By Application, 2021 – 2032

   9.6.6.6.3 Optical Test Equipment Market Size & Forecast, By Technology, 2021 – 2032

   9.6.6.6.4 Optical Test Equipment Market Size & Forecast, By End-User, 2021 – 2032

10. Competitive Landscape

 10.1 Key Players' Positioning

 10.2 Competitive Developments

  10.2.1 Key Strategies Adopted (%), By Key Players, 2024

  10.2.2 Year-Wise Strategies & Development, 2021 – 2025

  10.2.3 Number Of Strategies Adopted By Key Players, 2024

 10.3 Market Share Analysis, 2024

 10.4 Product/Service & Application Benchmarking

  10.4.1 Product/Service Specifications & Features By Key Players

  10.4.2 Product/Service Heatmap By Key Players

  10.4.3 Application Heatmap By Key Players

 10.5 Industry Start-Up & Innovation Landscape

10.6 Key Company Profiles

 10.6.1 VIAVI Solutions Inc.

  10.6.1.1 Company Overview & Snapshot

  10.6.1.2 Product/Service Portfolio

  10.6.1.3 Key Company Financials

  10.6.1.4 SWOT Analysis

 10.6.2 EXFO Inc.

  10.6.2.1 Company Overview & Snapshot

  10.6.2.2 Product/Service Portfolio

  10.6.2.3 Key Company Financials

  10.6.2.4 SWOT Analysis

 10.6.3 Anritsu Corporation

  10.6.3.1 Company Overview & Snapshot

  10.6.3.2 Product/Service Portfolio

  10.6.3.3 Key Company Financials

  10.6.3.4 SWOT Analysis

 10.6.4 Keysight Technologies, Inc.

  10.6.4.1 Company Overview & Snapshot

  10.6.4.2 Product/Service Portfolio

  10.6.4.3 Key Company Financials

  10.6.4.4 SWOT Analysis

 10.6.5 Yokogawa Electric Corporation

  10.6.5.1 Company Overview & Snapshot

  10.6.5.2 Product/Service Portfolio

  10.6.5.3 Key Company Financials

  10.6.5.4 SWOT Analysis

 10.6.6 AFL (Fujikura Ltd.)

  10.6.6.1 Company Overview & Snapshot

  10.6.6.2 Product/Service Portfolio

  10.6.6.3 Key Company Financials

  10.6.6.4 SWOT Analysis

 10.6.7 Tektronix, Inc.

  10.6.7.1 Company Overview & Snapshot

  10.6.7.2 Product/Service Portfolio

  10.6.7.3 Key Company Financials

  10.6.7.4 SWOT Analysis

 10.6.8 Fluke Networks (Fortive Corporation)

  10.6.8.1 Company Overview & Snapshot

  10.6.8.2 Product/Service Portfolio

  10.6.8.3 Key Company Financials

  10.6.8.4 SWOT Analysis

 10.6.9 Corning Incorporated

  10.6.9.1 Company Overview & Snapshot

  10.6.9.2 Product/Service Portfolio

  10.6.9.3 Key Company Financials

  10.6.9.4 SWOT Analysis

 10.6.10 OptoTest Corporation

  10.6.10.1 Company Overview & Snapshot

  10.6.10.2 Product/Service Portfolio

  10.6.10.3 Key Company Financials

  10.6.10.4 SWOT Analysis

 10.6.11 JDSU

  10.6.11.1 Company Overview & Snapshot

  10.6.11.2 Product/Service Portfolio

  10.6.11.3 Key Company Financials

  10.6.11.4 SWOT Analysis

 10.6.12 Kingfisher International

  10.6.12.1 Company Overview & Snapshot

  10.6.12.2 Product/Service Portfolio

  10.6.12.3 Key Company Financials

  10.6.12.4 SWOT Analysis

 10.6.13 Thorlabs, Inc.

  10.6.13.1 Company Overview & Snapshot

  10.6.13.2 Product/Service Portfolio

  10.6.13.3 Key Company Financials

  10.6.13.4 SWOT Analysis

 10.6.14 OZ Optics Limited

  10.6.14.1 Company Overview & Snapshot

  10.6.14.2 Product/Service Portfolio

  10.6.14.3 Key Company Financials

  10.6.14.4 SWOT Analysis

 10.6.15 Finisar Corporation

  10.6.15.1 Company Overview & Snapshot

  10.6.15.2 Product/Service Portfolio

  10.6.15.3 Key Company Financials

  10.6.15.4 SWOT Analysis

 10.6.16 VeEX Inc.

  10.6.16.1 Company Overview & Snapshot

  10.6.16.2 Product/Service Portfolio

  10.6.16.3 Key Company Financials

  10.6.16.4 SWOT Analysis

 10.6.17 Lumentum Holdings Inc.

  10.6.17.1 Company Overview & Snapshot

  10.6.17.2 Product/Service Portfolio

  10.6.17.3 Key Company Financials

  10.6.17.4 SWOT Analysis

 10.6.18 Senko Advanced Components, Inc.

  10.6.18.1 Company Overview & Snapshot

  10.6.18.2 Product/Service Portfolio

  10.6.18.3 Key Company Financials

  10.6.18.4 SWOT Analysis

 10.6.19 Optronic Laboratories, Inc.

  10.6.19.1 Company Overview & Snapshot

  10.6.19.2 Product/Service Portfolio

  10.6.19.3 Key Company Financials

  10.6.19.4 SWOT Analysis

 10.6.20 Fiber Instrument Sales, Inc.

  10.6.20.1 Company Overview & Snapshot

  10.6.20.2 Product/Service Portfolio

  10.6.20.3 Key Company Financials

  10.6.20.4 SWOT Analysis

11. Analyst Recommendations

 11.1 SNS Insider Opportunity Map

 11.2 Industry Low-Hanging Fruit Assessment

 11.3 Market Entry & Growth Strategy

 11.4 Analyst Viewpoint & Suggestions On Market Growth

12. Assumptions

13. Disclaimer

14. Appendix

 14.1 List Of Tables

 14.2 List Of Figures

Key Segments: 

By Type

  • Handheld

  • Bench Top  

By Application

  • Telecom and Broadband

  • Oil and Gas

  • Private Data Network

  • Cable Television

  • Military and Aerospace

  • Other

By Technology

  • OTDR

  • Optical Spectrum Analyzers

  • Optical Power Meters

  • Others

By End-User

  • Enterprises & Data Centers

  • Government & Defense

  • Research & Educational Institutes

Request for Segment Customization as per your Business Requirement: Segment Customization Request

Regional Coverage:

North America

  • US

  • Canada

Europe

  • Germany

  • UK

  • France

  • Italy

  • Spain

  • Russia

  • Poland

  • Rest of Europe

Asia Pacific

  • China

  • India

  • Japan

  • South Korea

  • Australia

  • ASEAN Countries

  • Rest of Asia Pacific

Middle East & Africa

  • UAE

  • Saudi Arabia

  • Qatar

  • South Africa

  • Rest of Middle East & Africa

Latin America

  • Brazil

  • Argentina

  • Mexico

  • Colombia

  • Rest of Latin America

Request for Country Level Research Report: Country Level Customization Request

Available Customization 

With the given market data, SNS Insider offers customization as per the company’s specific needs. The following customization options are available for the report: 

  • Detailed Volume Analysis 

  • Criss-Cross segment analysis (e.g. Product X Application) 

  • Competitive Product Benchmarking 

  • Geographic Analysis 

  • Additional countries in any of the regions 

  • Customized Data Representation 

  • Detailed analysis and profiling of additional market players

An accurate research report requires proper strategizing as well as implementation. There are multiple factors involved in the completion of good and accurate research report and selecting the best methodology to compete the research is the toughest part. Since the research reports we provide play a crucial role in any company’s decision-making process, therefore we at SNS Insider always believe that we should choose the best method which gives us results closer to reality. This allows us to reach at a stage wherein we can provide our clients best and accurate investment to output ratio.

Each report that we prepare takes a timeframe of 350-400 business hours for production. Starting from the selection of titles through a couple of in-depth brain storming session to the final QC process before uploading our titles on our website we dedicate around 350 working hours. The titles are selected based on their current market cap and the foreseen CAGR and growth.


The 5 steps process:

Step 1: Secondary Research:

Secondary Research or Desk Research is as the name suggests is a research process wherein, we collect data through the readily available information. In this process we use various paid and unpaid databases which our team has access to and gather data through the same. This includes examining of listed companies’ annual reports, Journals, SEC filling etc. Apart from this our team has access to various associations across the globe across different industries. Lastly, we have exchange relationships with various university as well as individual libraries.

Secondary Research

Step 2: Primary Research

When we talk about primary research, it is a type of study in which the researchers collect relevant data samples directly, rather than relying on previously collected data.  This type of research is focused on gaining content specific facts that can be sued to solve specific problems. Since the collected data is fresh and first hand therefore it makes the study more accurate and genuine.

We at SNS Insider have divided Primary Research into 2 parts.

Part 1 wherein we interview the KOLs of major players as well as the upcoming ones across various geographic regions. This allows us to have their view over the market scenario and acts as an important tool to come closer to the accurate market numbers. As many as 45 paid and unpaid primary interviews are taken from both the demand and supply side of the industry to make sure we land at an accurate judgement and analysis of the market.

This step involves the triangulation of data wherein our team analyses the interview transcripts, online survey responses and observation of on filed participants. The below mentioned chart should give a better understanding of the part 1 of the primary interview.

Primary Research

Part 2: In this part of primary research the data collected via secondary research and the part 1 of the primary research is validated with the interviews from individual consultants and subject matter experts.

Consultants are those set of people who have at least 12 years of experience and expertise within the industry whereas Subject Matter Experts are those with at least 15 years of experience behind their back within the same space. The data with the help of two main processes i.e., FGDs (Focused Group Discussions) and IDs (Individual Discussions). This gives us a 3rd party nonbiased primary view of the market scenario making it a more dependable one while collation of the data pointers.

Step 3: Data Bank Validation

Once all the information is collected via primary and secondary sources, we run that information for data validation. At our intelligence centre our research heads track a lot of information related to the market which includes the quarterly reports, the daily stock prices, and other relevant information. Our data bank server gets updated every fortnight and that is how the information which we collected using our primary and secondary information is revalidated in real time.

Data Bank Validation

Step 4: QA/QC Process

After all the data collection and validation our team does a final level of quality check and quality assurance to get rid of any unwanted or undesired mistakes. This might include but not limited to getting rid of the any typos, duplication of numbers or missing of any important information. The people involved in this process include technical content writers, research heads and graphics people. Once this process is completed the title gets uploader on our platform for our clients to read it.

Step 5: Final QC/QA Process:

This is the last process and comes when the client has ordered the study. In this process a final QA/QC is done before the study is emailed to the client. Since we believe in giving our clients a good experience of our research studies, therefore, to make sure that we do not lack at our end in any way humanly possible we do a final round of quality check and then dispatch the study to the client.