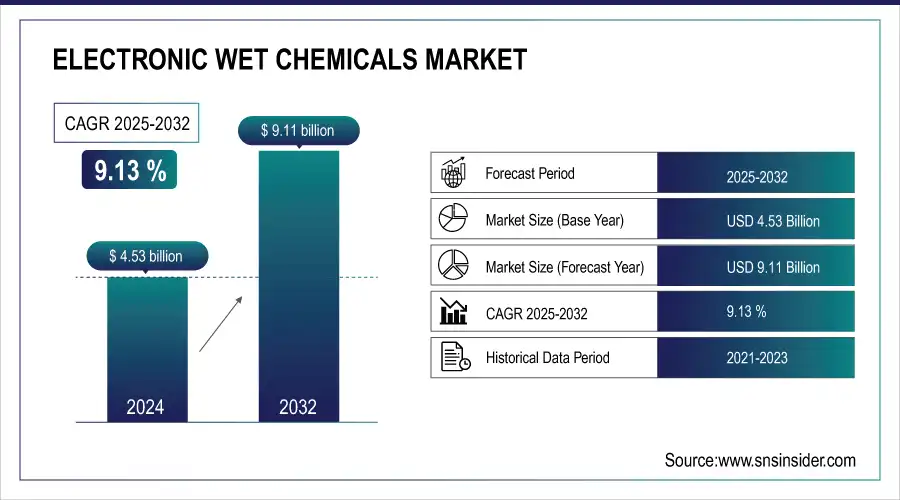
The Electronic Wet Chemicals Market size was valued at USD 4.53 Billion in 2024 and is projected to reach USD 9.11 Billion by 2032, growing at a CAGR of 9.13 % during 2025-2032.
The electronic wet chemicals Market is expanding at a rapid pace due to rising requirement for ultra pure chemicals across the semiconductors electronics and solar industry. Such chemicals, including acids, solvents, and cleaning chemicals, are essential for wafer fabrication, circuit board manufacturing and advanced packaging. With the development of 5G, AI, and IoT and other technologies, the precision, and performance requirements of materials have become increasingly demanding. The trend toward sustainability is also stimulating the creation of green and efficient chemical processes. Supply chain worries are making local production and sourcing more critical. Demand for dependable, high purity chemicals that meet the highest industry standards is expected to sustain the market expansion.
Eastman has introduced a high-purity electronic grade isopropyl alcohol (IPA) to its EastaPure™ portfolio, ensuring superior quality and reliability for semiconductor manufacturers. This new solvent, made in the U.S., addresses growing demand by providing a domestically sourced solution with 99.99% purity and reliable supply.
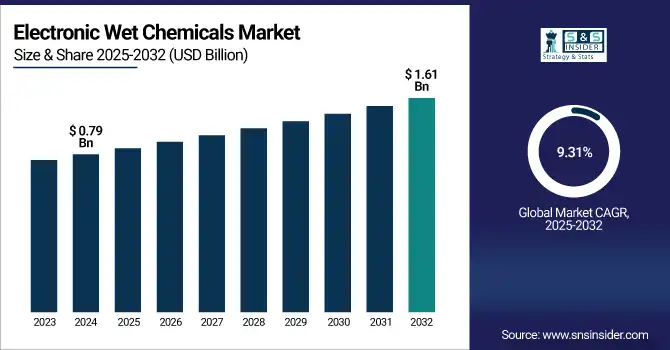
The U.S. electronic wet chemicals market size was valued at USD 0.79 Billion in 2024 and is projected to reach USD 1.61 Billion by 2032, growing at a CAGR of 9.31%, driven by increasing automation across industries like manufacturing and automotive, advancements in high-intensity LED and customizable lighting technologies, and the rise of AI and machine learning for enhanced image processing. Additionally, the adoption of machine vision in medical and food industries fuels market growth.
Drivers:
Impact of Precision Cleaning on Semiconductor Manufacturing Yields and Operational Efficiency
High purity cleaning is critical when it comes to improving the yields in semiconductor fabrication of wafers and components, because nothing can be in that processed product that could degrade yields. Particles, oils and contaminants may produce microstructural defects in the semiconductor leading to poor performance and potential failure. Ultra-pure electronic wet chemicals, such as isopropyl alcohol and premium cleaning agents, can easily remove such contaminants from sensitive areas without causing damage. This cleaning facilitates higher quality control with less runout for less waste in production. The result is higher semiconductor chip yields, increased operating efficiency and a greater number of successful devices. The use of these sophisticated cleaning compositions is necessary to prevent compromising the integrity and performance of semiconductor devices and to maximize production efficiencies.
Chemistry underpins the USD 50 billion global electronics materials market, growing at ~5% annually to support rising demand for electronic products. With U.S. electronics manufacturing resurging, domestic chemical production is expanding to support increased semiconductor capacity and boost the U.S. market share.
Opportunities:
Leveraging Connected Intelligence for Enhanced Quality Operations in Life Sciences
Adopting connected intelligence through cloud solutions in quality operations allows life sciences organizations to seamlessly integrate data across various departments, enhancing efficiency and decision-making. By leveraging artificial intelligence (AI), these cloud-based systems enable real-time insights, improve data accuracy, and drive proactive quality management throughout the product lifecycle. AI algorithms can analyze vast amounts of data from production, safety, and regulatory compliance, identifying patterns and potential risks early. This integration helps companies respond more swiftly to market demands, regulatory changes, and operational challenges, ultimately optimizing processes. Furthermore, connected intelligence reduces silos, fosters collaboration, and ensures that quality standards are consistently met, contributing to more operations that are efficient, reduced costs, and faster time-to-market for products.
Challenges:
Data Integration Complexity Impedes Seamless Quality Operations Across Functions
Data integration complexity is a significant challenge in adopting connected intelligence for quality operations. Pharmaceutical companies use different disparate systems within safety, regulatory, clinical, and manufacturing areas as well. Data stored in various databases and systems can be in varying formats or may be based on different technologies, complicating the task of aggregating and integrating data. The absence of the “right” middleware for facilitating seamless interaction across the previously cited systems may compromise time delays, errors, and decision-making support. In order to do this, businesses require strong integration tools that provide seamless data flow between systems, standardize data formats, and provide real-time access to reliable information. This integration must also be in accordance with compliance standards to adhere to regulate while streamlining operations and promoting data-driven decision-making throughout the product cycle.
By Type
The acetic acid segment held a dominant electronic wet chemicals market share of around 55% in 2024, on account of its indispensable requirement across the semiconductor and electronic component cleaning industries. Its ability to extract impurities and demand for electronics and high tech is driving the market.
The isopropyl acid segment is expected to witness the fastest growth in the electronic wet chemicals market over 2025-2032, with a CAGR of 12.59%, due to its critical role in cleaning and surface preparation in semiconductor manufacturing. Its effectiveness in removing contaminants, coupled with increasing demand for high-performance electronics and advanced technologies, drives its rapid adoption.
By Form
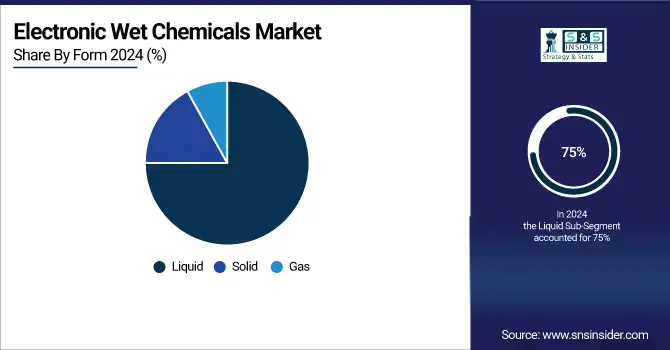
The liquid segment held a dominant share of around 75% in the electronic wet chemicals market in 2024, due to its wide application use in cleaning and etching process, as such on the semiconductor production. The need for high purity and accurate liquid chemicals for use in device manufacturing and surface treatment drive this predominance.
The gas segment is expected to witness the fastest growth in the electronic wet chemicals market from 2025-2032, with a CAGR of 12.55%. This segment growth is driven by growing usage of gas-based chemicals in etching and deposition for advanced semiconductor and display production technologies as it contributes to miniaturization and accuracy.
By Application
The Semiconductor Manufacturing segment held a dominant market share of around 46% in 2024 and is projected to experience the fastest growth during 2025-2032, at a CAGR of 10.21%. The growth is driven by increased demand for advanced semiconductors in AI, IoT, automotive, and consumer applications. With a growing market demand for smaller and higher powered chips, there is a greater dependence on high-purity wet chemicals for advanced etching and manufacturing processes.
By End User Industry
The Electronics & Semiconductor Industry segment held a dominant share of around 56% in the electronic wet chemicals market in 2024, driven by the growing demand for advanced semiconductor devices, miniaturization of components, and increased use of electronic devices across various sectors such as consumer electronics, telecommunications, and computing.
The Automotive Industry segment is expected to witness the fastest growth in the electronic wet chemicals market from 2025-2032, with a CAGR of 10.99%. This expansion is driven by increasing sales of electric vehicles (EVs), which demand sophisticated electronics components and materials and greater demand for reliable wet chemicals in auto electronics and manufacturing.
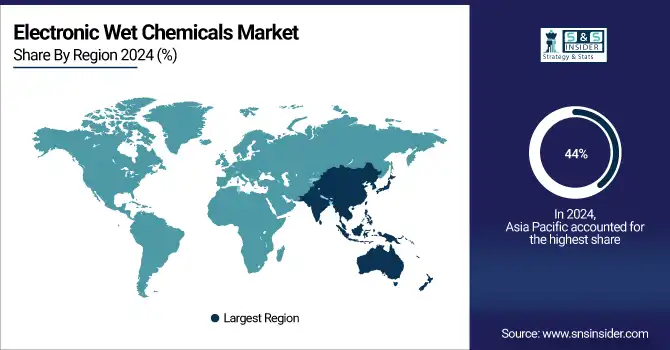
In 2024, the Asia-Pacific dominated the electronic wet chemicals market and accounted for 44% of revenue share, owing to presence of leading semiconductor manufacturing plants in countries such as Japan, Taiwan, South Korea, China, rising investment in advanced chip production, consumer electronics requirement, and favorable government initiatives.
China leads the Asia-Pacific electronic wet chemicals market due to its strong semiconductor manufacturing base and rapid expansion of electronics production.
North America is projected to register the fastest CAGR of 10.37% during 2025-2032, due to rapid investments for semiconductor fab, rise in advanced technology, such as AI, 5G, and strong government support, such as CHIPS Act for domestic semiconductor manufacturer and supply chain resilience.
The U.S. leads the country in electronic wet chemicals market, due to robust semiconductor manufacturing, rising R&D investments, and strong presence of major chipmakers and tech firms.
In 2024, Europe emerged as a promising region in the electronic wet chemicals market, based on growing investments in semiconductor manufacturing facilities, favorable government policies promoting microelectronics, and growth in the clean energy and automotive industries. In addition, the region’s emphasis on technological self-sufficiency is underlining the need for high-purity chemical products.
LATAM and MEA is experiencing steady growth in the electronic wet chemicals market, which can be attributed to the growing investment in electronics manufacturing, increasing demand for consumer electronics, and supportive government policies. Data center proliferation and increasing interest in regionalizing semiconductor manufacturing are also driving the need for development of more advanced wet chemical processes.
The electronic wet chemicals market companies Air Products and Chemicals, Inc., BASF SE, Cabot Microelectronics Corporation, Dow Chemical Company, Fujifilm Corporation, Honeywell International Inc., KMG Chemicals, Inc., Linde plc, Mitsubishi Chemical Corporation, Sumitomo Chemical Co., Ltd., Technic Inc. and Others.
In April 2025, BASF is investing in an additional semiconductor-grade sulfuric acid plant at its site in Ludwigshafen, Germany to support the growing demand for advanced semiconductor manufacturing solutions. The plant, which is expected to begin operations by 2027, will create a reliable, high-quality supply of key chemicals for chip making in Europe.
In October 2024, Honeywell plans to spin off its Advanced Materials business into an independent company by the end of 2025 or early 2026, focusing on sustainability-driven specialty chemicals and materials. The move will enhance strategic focus and financial flexibility to foster innovation and growth in advanced materials for various industries.
Report Attributes | Details |
---|---|
Market Size in 2024 | USD 4.53 Billion |
Market Size by 2032 | USD 9.11 Billion |
CAGR | CAGR of 9.13% From 2025 to 2032 |
Base Year | 2024 |
Forecast Period | 2025-2032 |
Historical Data | 2021-2023 |
Report Scope & Coverage | Market Size, Segments Analysis, Competitive Landscape, Regional Analysis, DROC & SWOT Analysis, Forecast Outlook |
Key Segments | • By Type (Acetic acid, Phosphoric acid and Isopropyl acid), • By Form (Liquid, Solid and Gas), • By Application (Semiconductor Manufacturing, Flat Panel Display (FPD) Manufacturing, Solar Cell Manufacturing and Printed Circuit Board (PCB) Manufacturing), • By End User Industry (Electronics & Semiconductor Industry, Solar & Photovoltaic Industry, Automotive Industry and Consumer Electronics) |
Regional Analysis/Coverage | North America (US, Canada, Mexico), Europe (Germany, France, UK, Italy, Spain, Poland, Turkey, Rest of Europe), Asia Pacific (China, India, Japan, South Korea, Singapore, Australia, Taiwan, Rest of Asia Pacific), Middle East & Africa (UAE, Saudi Arabia, Qatar, South Africa, Rest of Middle East & Africa), Latin America (Brazil, Argentina, Rest of Latin America) |
Company Profiles | The electronic wet chemicals market companies Air Products and Chemicals, Inc., BASF SE, Cabot Microelectronics Corporation, Dow Chemical Company, Fujifilm Corporation, Honeywell International Inc., KMG Chemicals, Inc., Linde plc, Mitsubishi Chemical Corporation, Sumitomo Chemical Co., Ltd., Technic Inc. and Others |
Ans: The Electronic Wet Chemicals Market is expected to grow at a CAGR of 9.13 % during 2025-2032.
Ans: The Electronic Wet Chemicals was USD 4.53 Billion in 2024 and is expected to Reach USD 9.11 Billion by 2032.
Ans: Key drivers of the Electronic Wet Chemicals Market include the growth of semiconductor manufacturing, renewable energy demand, and advancements in electronics and automotive industries.
Ans: The “Acetic acid” segment dominated the Electronic Wet Chemicals Market.
Ans: Asia-Pacific dominated the Electronic Wet Chemicals Market in 2024.
1. Introduction
1.1 Market Definition
1.2 Scope (Inclusion and Exclusions)
1.3 Research Assumptions
2. Executive Summary
2.1 Market Overview
2.2 Regional Synopsis
2.3 Competitive Summary
3. Research Methodology
3.1 Top-Down Approach
3.2 Bottom-up Approach
3.3. Data Validation
3.4 Primary Interviews
4. Market Dynamics Impact Analysis
4.1 Market Driving Factors Analysis
4.1.1 Drivers
4.1.2 Restraints
4.1.3 Opportunities
4.1.4 Challenges
4.2 PESTLE Analysis
4.3 Porter’s Five Forces Model
5. Statistical Insights and Trends Reporting
5.1 Innovation in Chemical Purity and Performance
5.2 Industry 4.0 Integration
5.3 Industry 4.0 Integration
5.4 Consumer Demand for Enhanced Product Features
6. Competitive Landscape
6.1 List of Major Companies By Region
6.2 Market Share Analysis By Region
6.3 Product Benchmarking
6.3.1 Product specifications and features
6.3.2 Pricing
6.4 Strategic Initiatives
6.4.1 Marketing and promotional activities
6.4.2 Distribution and Supply Chain Strategies
6.4.3 Expansion plans and new product launches
6.4.4 Strategic partnerships and collaborations
6.5 Technological Advancements
6.6 Market Positioning and Branding
7. Electronic Wet Chemicals Market Segmentation By Type
7.1 Chapter Overview
7.2 Acetic acid
7.2.1 Acetic acid Market Trends Analysis (2021-2032)
7.2.2 Acetic acid Market Size Estimates and Forecasts to 2032 (USD Billion)
7.3 Phosphoric acid
7.3.1 Phosphoric acid Market Trends Analysis (2021-2032)
7.3.2 Phosphoric acid Market Size Estimates and Forecasts to 2032 (USD Billion)
7.4 Isopropyl acid
7.4.1 Isopropyl acid Market Trends Analysis (2021-2032)
7.4.2 Isopropyl acid Market Size Estimates and Forecasts to 2032 (USD Billion)
8. Electronic Wet Chemicals Market Segmentation By Form
8.1 Chapter Overview
8.2 Liquid
8.2.1 Liquid Market Trends Analysis (2021-2032)
8.2.2 Liquid Market Size Estimates and Forecasts to 2032 (USD Billion)
8.3 Solid
8.3.1 Solid Market Trends Analysis (2021-2032)
8.3.2 Solid Market Size Estimates and Forecasts to 2032 (USD Billion)
8.4 Gas
8.4.1 Gas Market Trends Analysis (2021-2032)
8.4.2 Gas Market Size Estimates and Forecasts to 2032 (USD Billion)
9. Electronic Wet Chemicals Market Segmentation By Application
9.1 Chapter Overview
9.2 Semiconductor Manufacturing
9.2.1 Semiconductor Manufacturing Market Trends Analysis (2021-2032)
9.2.2 Semiconductor Manufacturing Market Size Estimates and Forecasts to 2032 (USD Billion)
9.3 Flat Panel Display (FPD) Manufacturing
9.3.1 Flat Panel Display (FPD) ManufacturingMarket Trends Analysis (2021-2032)
9.3.2 Flat Panel Display (FPD) Manufacturing Market Size Estimates and Forecasts to 2032 (USD Billion)
9.4 Solar Cell Manufacturing
9.4.1 Solar Cell ManufacturingMarket Trends Analysis (2021-2032)
9.4.2 Solar Cell Manufacturing Market Size Estimates and Forecasts to 2032 (USD Billion)
9.5 Printed Circuit Board (PCB) Manufacturing
9.5.1 Printed Circuit Board (PCB) Manufacturing Market Trends Analysis (2021-2032)
9.5.2 Printed Circuit Board (PCB) Manufacturing Market Size Estimates and Forecasts to 2032 (USD Billion)
10. Electronic Wet Chemicals Market Segmentation By End User Industry
10.1 Chapter Overview
10.2 Electronics & Semiconductor Industry
10.2.1 Electronics & Semiconductor Industry Market Trends Analysis (2021-2032)
10.2.2 Electronics & Semiconductor Industry Market Size Estimates and Forecasts to 2032 (USD Billion)
10.3 Solar & Photovoltaic Industry
10.3.1 Solar & Photovoltaic Industry Market Trend Analysis (2021-2032)
10.3.2 Solar & Photovoltaic Industry Market Size Estimates and Forecasts to 2032 (USD Billion)
10.4 Automotive Industry
10.4.1 Automotive Industry Market Trends Analysis (2021-2032)
10.4.2 Automotive Industry Market Size Estimates and Forecasts to 2032 (USD Billion)
10.5 Consumer Electronics
10.5.1 Consumer Electronics Market Trends Analysis (2021-2032)
10.5.2 Consumer Electronics Market Size Estimates and Forecasts to 2032 (USD Billion)
11. Regional Analysis
11.1 Chapter Overview
11.2 North America
11.2.1 Trend Analysis
11.2.2 North America Electronic Wet Chemicals Market Estimates and Forecasts by Country (2021-2032) (USD Billion)
11.2.3 North America Electronic Wet Chemicals Market Estimates and Forecasts By Type (2021-2032) (USD Billion)
11.2.4 North America Electronic Wet Chemicals Market Estimates and Forecasts By Form (2021-2032) (USD Billion)
11.2.5 North America Electronic Wet Chemicals Market Estimates and Forecasts By Application (2021-2032) (USD Billion)
11.2.6 North America Electronic Wet Chemicals Market Estimates and Forecasts By End User Industry (2021-2032) (USD Billion)
11.2.7 USA
11.2.7.1 USA Electronic Wet Chemicals Market Estimates and Forecasts By Type (2021-2032) (USD Billion)
11.2.7.2 USA Electronic Wet Chemicals Market Estimates and Forecasts By Form (2021-2032) (USD Billion)
11.2.7.3 USA Electronic Wet Chemicals Market Estimates and Forecasts By Application (2021-2032) (USD Billion)
11.2.7.4 USA Electronic Wet Chemicals Market Estimates and Forecasts By End User Industry (2021-2032) (USD Billion)
11.2.8 Canada
11.2.8.1 Canada Electronic Wet Chemicals Market Estimates and Forecasts By Type (2021-2032) (USD Billion)
11.2.8.2 Canada Electronic Wet Chemicals Market Estimates and Forecasts By Form (2021-2032) (USD Billion)
11.2.8.3 Canada Electronic Wet Chemicals Market Estimates and Forecasts By Application (2021-2032) (USD Billion)
11.2.8.4 Canada Electronic Wet Chemicals Market Estimates and Forecasts By End User Industry (2021-2032) (USD Billion)
11.2.9 Mexico
11.2.9.1 Mexico Electronic Wet Chemicals Market Estimates and Forecasts By Type (2021-2032) (USD Billion)
11.2.9.2 Mexico Electronic Wet Chemicals Market Estimates and Forecasts By Form (2021-2032) (USD Billion)
11.2.9.3 Mexico Electronic Wet Chemicals Market Estimates and Forecasts By Application (2021-2032) (USD Billion)
11.2.9.4 Mexico Electronic Wet Chemicals Market Estimates and Forecasts By End User Industry (2021-2032) (USD Billion)
11.3 Europe
11.3.1 Trend Analysis
11.3.2 Europe Electronic Wet Chemicals Market Estimates and Forecasts by Country (2021-2032) (USD Billion)
11.3.3 Europe Electronic Wet Chemicals Market Estimates and Forecasts By Type (2021-2032) (USD Billion)
11.3.4 Europe Electronic Wet Chemicals Market Estimates and Forecasts By Form (2021-2032) (USD Billion)
11.3.5 Europe Electronic Wet Chemicals Market Estimates and Forecasts By Application (2021-2032) (USD Billion)
11.3.6 Europe Electronic Wet Chemicals Market Estimates and Forecasts By End User Industry (2021-2032) (USD Billion)
11.3.7 Germany
11.3.7.1 Germany Electronic Wet Chemicals Market Estimates and Forecasts By Type (2021-2032) (USD Billion)
11.3.7.2 Germany Electronic Wet Chemicals Market Estimates and Forecasts By Form (2021-2032) (USD Billion)
11.3.7.3 Germany Electronic Wet Chemicals Market Estimates and Forecasts By Application (2021-2032) (USD Billion)
11.3.7.4 Germany Electronic Wet Chemicals Market Estimates and Forecasts By End User Industry (2021-2032) (USD Billion)
11.3.8 France
11.3.8.1 France Electronic Wet Chemicals Market Estimates and Forecasts By Type (2021-2032) (USD Billion)
11.3.8.2 France Electronic Wet Chemicals Market Estimates and Forecasts By Form (2021-2032) (USD Billion)
11.3.8.3 France Electronic Wet Chemicals Market Estimates and Forecasts By Application (2021-2032) (USD Billion)
11.3.8.4 France Electronic Wet Chemicals Market Estimates and Forecasts By End User Industry (2021-2032) (USD Billion)
11.3.9 UK
11.3.9.1 UK Electronic Wet Chemicals Market Estimates and Forecasts By Type (2021-2032) (USD Billion)
11.3.9.2 UK Electronic Wet Chemicals Market Estimates and Forecasts By Form (2021-2032) (USD Billion)
11.3.9.3 UK Electronic Wet Chemicals Market Estimates and Forecasts By Application (2021-2032) (USD Billion)
11.3.9.4 UK Electronic Wet Chemicals Market Estimates and Forecasts By End User Industry (2021-2032) (USD Billion)
11.3.10 Italy
11.3.10.1 Italy Electronic Wet Chemicals Market Estimates and Forecasts By Type (2021-2032) (USD Billion)
11.3.10.2 Italy Electronic Wet Chemicals Market Estimates and Forecasts By Form (2021-2032) (USD Billion)
11.3.10.3 Italy Electronic Wet Chemicals Market Estimates and Forecasts By Application (2021-2032) (USD Billion)
11.3.10.4 Italy Electronic Wet Chemicals Market Estimates and Forecasts By End User Industry (2021-2032) (USD Billion)
11.3.11 Spain
11.3.11.1 Spain Electronic Wet Chemicals Market Estimates and Forecasts By Type (2021-2032) (USD Billion)
11.3.11.2 Spain Electronic Wet Chemicals Market Estimates and Forecasts By Form (2021-2032) (USD Billion)
11.3.11.3 Spain Electronic Wet Chemicals Market Estimates and Forecasts By Application (2021-2032) (USD Billion)
11.3.11.4 Spain Electronic Wet Chemicals Market Estimates and Forecasts By End User Industry (2021-2032) (USD Billion)
11.3.12 Netherlands
11.3.12.1 Poland Electronic Wet Chemicals Market Estimates and Forecasts By Type (2021-2032) (USD Billion)
11.3.12.2 Poland Electronic Wet Chemicals Market Estimates and Forecasts By Form (2021-2032) (USD Billion)
11.3.12.3 Poland Electronic Wet Chemicals Market Estimates and Forecasts By Application (2021-2032) (USD Billion)
11.3.12.4 Poland Electronic Wet Chemicals Market Estimates and Forecasts By End User Industry (2021-2032) (USD Billion)
11.3.13 Turkey
11.3.13.1 Turkey Electronic Wet Chemicals Market Estimates and Forecasts By Type (2021-2032) (USD Billion)
11.3.13.2 Turkey Electronic Wet Chemicals Market Estimates and Forecasts By Form (2021-2032) (USD Billion)
11.3.13.3 Turkey Electronic Wet Chemicals Market Estimates and Forecasts By Application (2021-2032) (USD Billion)
11.3.13.4 Turkey Electronic Wet Chemicals Market Estimates and Forecasts By End User Industry (2021-2032) (USD Billion)
11.3.14 Rest of Europe
11.3.14.1 Rest of Europe Electronic Wet Chemicals Market Estimates and Forecasts By Type (2021-2032) (USD Billion)
11.3.14.2 Rest of Europe Electronic Wet Chemicals Market Estimates and Forecasts By Form (2021-2032) (USD Billion)
11.3.14.3 Rest of Europe Electronic Wet Chemicals Market Estimates and Forecasts By Application (2021-2032) (USD Billion)
11.3.14.4 Rest of Europe Electronic Wet Chemicals Market Estimates and Forecasts By End User Industry (2021-2032) (USD Billion)
11.4 Asia-Pacific
11.4.1 Trend Analysis
11.4.2 Asia-Pacific Electronic Wet Chemicals Market Estimates and Forecasts by Country (2021-2032) (USD Billion)
11.4.3 Asia-Pacific Electronic Wet Chemicals Market Estimates and Forecasts By Type (2021-2032) (USD Billion)
11.4.4 Asia-Pacific Electronic Wet Chemicals Market Estimates and Forecasts By Form (2021-2032) (USD Billion)
11.4.5 Asia-Pacific Electronic Wet Chemicals Market Estimates and Forecasts By Application (2021-2032) (USD Billion)
11.4.6 Asia-Pacific Electronic Wet Chemicals Market Estimates and Forecasts By End User Industry (2021-2032) (USD Billion)
11.4.7 China
11.4.7.1 China Electronic Wet Chemicals Market Estimates and Forecasts By Type (2021-2032) (USD Billion)
11.4.7.2 China Electronic Wet Chemicals Market Estimates and Forecasts By Form (2021-2032) (USD Billion)
11.4.7.3 China Electronic Wet Chemicals Market Estimates and Forecasts By Application (2021-2032) (USD Billion)
11.4.7.4 China Electronic Wet Chemicals Market Estimates and Forecasts By End User Industry (2021-2032) (USD Billion)
11.4.8 India
11.4.8.1 India Electronic Wet Chemicals Market Estimates and Forecasts By Type (2021-2032) (USD Billion)
11.4.8.2 India Electronic Wet Chemicals Market Estimates and Forecasts By Form (2021-2032) (USD Billion)
11.4.8.3 India Electronic Wet Chemicals Market Estimates and Forecasts By Application (2021-2032) (USD Billion)
11.4.8.4 India Electronic Wet Chemicals Market Estimates and Forecasts By End User Industry (2021-2032) (USD Billion)
11.4.9 Japan
11.4.9.1 Japan Electronic Wet Chemicals Market Estimates and Forecasts By Type (2021-2032) (USD Billion)
11.4.9.2 Japan Electronic Wet Chemicals Market Estimates and Forecasts By Form (2021-2032) (USD Billion)
11.4.9.3 Japan Electronic Wet Chemicals Market Estimates and Forecasts By Application (2021-2032) (USD Billion)
11.4.9.4 Japan Electronic Wet Chemicals Market Estimates and Forecasts By End User Industry (2021-2032) (USD Billion)
11.4.10 South Korea
11.4.10.1 South Korea Electronic Wet Chemicals Market Estimates and Forecasts By Type (2021-2032) (USD Billion)
11.4.10.2 South Korea Electronic Wet Chemicals Market Estimates and Forecasts By Form (2021-2032) (USD Billion)
11.4.10.3 South Korea Electronic Wet Chemicals Market Estimates and Forecasts By Application (2021-2032) (USD Billion)
11.4.10.4 South Korea Electronic Wet Chemicals Market Estimates and Forecasts By End User Industry (2021-2032) (USD Billion)
11.4.11 Singapore
11.4.11.1 Singapore Electronic Wet Chemicals Market Estimates and Forecasts By Type (2021-2032) (USD Billion)
11.4.11.2 Singapore Electronic Wet Chemicals Market Estimates and Forecasts By Form (2021-2032) (USD Billion)
11.4.11.3 Singapore Electronic Wet Chemicals Market Estimates and Forecasts By Application (2021-2032) (USD Billion)
11.4.11.4 Singapore Electronic Wet Chemicals Market Estimates and Forecasts By End User Industry (2021-2032) (USD Billion)
11.4.12 Australia
11.4.12.1 Australia Electronic Wet Chemicals Market Estimates and Forecasts By Type (2021-2032) (USD Billion)
11.4.12.2 Australia Electronic Wet Chemicals Market Estimates and Forecasts By Form (2021-2032) (USD Billion)
11.4.12.3 Australia Electronic Wet Chemicals Market Estimates and Forecasts By Application (2021-2032) (USD Billion)
11.4.12.4 Australia Electronic Wet Chemicals Market Estimates and Forecasts By End User Industry (2021-2032) (USD Billion)
11.4.13 Taiwan
11.4.13.1 Taiwan Electronic Wet Chemicals Market Estimates and Forecasts By Type (2021-2032) (USD Billion)
11.4.13.2 Taiwan Electronic Wet Chemicals Market Estimates and Forecasts By Form (2021-2032) (USD Billion)
11.4.13.3 Taiwan Electronic Wet Chemicals Market Estimates and Forecasts By Application (2021-2032) (USD Billion)
11.4.13.4 Taiwan Electronic Wet Chemicals Market Estimates and Forecasts By End User Industry (2021-2032) (USD Billion)
11.4.14 Rest of Asia-Pacific
11.4.14.1 Rest of Asia-Pacific Electronic Wet Chemicals Market Estimates and Forecasts By Type (2021-2032) (USD Billion)
11.4.14.2 Rest of Asia-Pacific Electronic Wet Chemicals Market Estimates and Forecasts By Form (2021-2032) (USD Billion)
11.4.14.3 Rest of Asia-Pacific Electronic Wet Chemicals Market Estimates and Forecasts By Application (2021-2032) (USD Billion)
11.4.14.4 Rest of Asia-Pacific Electronic Wet Chemicals Market Estimates and Forecasts By End User Industry (2021-2032) (USD Billion)
11.5 Middle East and Africa and Africa
11.5.1 Trend Analysis
11.5.2 Middle East and Africa Electronic Wet Chemicals Market Estimates and Forecasts by Country (2021-2032) (USD Billion)
11.5.3 Middle East and Africa Electronic Wet Chemicals Market Estimates and Forecasts By Type (2021-2032) (USD Billion)
11.5.4 Middle East and Africa Electronic Wet Chemicals Market Estimates and Forecasts By Form (2021-2032) (USD Billion)
11.5.5 Middle East and Africa Electronic Wet Chemicals Market Estimates and Forecasts By Application (2021-2032) (USD Billion)
11.5.6 Middle East and Africa Electronic Wet Chemicals Market Estimates and Forecasts By End User Industry (2021-2032) (USD Billion)
11.5.7 UAE
11.5.7.1 UAE Electronic Wet Chemicals Market Estimates and Forecasts By Type (2021-2032) (USD Billion)
11.5.7.2 UAE Electronic Wet Chemicals Market Estimates and Forecasts By Form (2021-2032) (USD Billion)
11.5.7.3 UAE Electronic Wet Chemicals Market Estimates and Forecasts By Application (2021-2032) (USD Billion)
11.5.7.4 UAE Electronic Wet Chemicals Market Estimates and Forecasts By End User Industry (2021-2032) (USD Billion)
11.5.8 Saudi Arabia
11.5.8.1 Saudi Arabia Electronic Wet Chemicals Market Estimates and Forecasts By Type (2021-2032) (USD Billion)
11.5.8.2 Saudi Arabia Electronic Wet Chemicals Market Estimates and Forecasts By Form (2021-2032) (USD Billion)
11.5.8.3 Saudi Arabia Electronic Wet Chemicals Market Estimates and Forecasts By Application (2021-2032) (USD Billion)
11.5.8.4 Saudi Arabia Electronic Wet Chemicals Market Estimates and Forecasts By End User Industry (2021-2032) (USD Billion)
11.5.9 Qatar
11.5.9.1 Qatar Electronic Wet Chemicals Market Estimates and Forecasts By Type (2021-2032) (USD Billion)
11.5.9.2 Qatar Electronic Wet Chemicals Market Estimates and Forecasts By Form (2021-2032) (USD Billion)
11.5.9.3 Qatar Electronic Wet Chemicals Market Estimates and Forecasts By Application (2021-2032) (USD Billion)
11.5.9.4 Qatar Electronic Wet Chemicals Market Estimates and Forecasts By End User Industry (2021-2032) (USD Billion)
11.5.10 South Africa
11.5.10.1 South Africa Electronic Wet Chemicals Market Estimates and Forecasts By Type (2021-2032) (USD Billion)
11.5.10.2 South Africa Electronic Wet Chemicals Market Estimates and Forecasts By Form (2021-2032) (USD Billion)
11.5.10.3 South Africa Electronic Wet Chemicals Market Estimates and Forecasts By Application (2021-2032) (USD Billion)
11.5.10.4 South Africa Electronic Wet Chemicals Market Estimates and Forecasts By End User Industry (2021-2032) (USD Billion)
11.5.11 Rest of Middle East and Africa
11.5.11.1 Rest of Middle East and Africa Electronic Wet Chemicals Market Estimates and Forecasts By Type (2021-2032) (USD Billion)
11.5.11.2 Rest of Middle East and Africa Electronic Wet Chemicals Market Estimates and Forecasts By Form (2021-2032) (USD Billion)
11.5.11.3 Rest of Middle East and Africa Electronic Wet Chemicals Market Estimates and Forecasts By Application (2021-2032) (USD Billion)
11.5.11.4 Rest of Middle East and Africa Electronic Wet Chemicals Market Estimates and Forecasts By End User Industry (2021-2032) (USD Billion)
11.6 Latin America
11.6.1 Trend Analysis
11.6.2 Latin America Electronic Wet Chemicals Market Estimates and Forecasts by Country (2021-2032) (USD Billion)
11.6.3 Latin America Electronic Wet Chemicals Market Estimates and Forecasts By Type (2021-2032) (USD Billion)
11.6.4 Latin America Electronic Wet Chemicals Market Estimates and Forecasts By Form (2021-2032) (USD Billion)
11.6.5 Latin America Electronic Wet Chemicals Market Estimates and Forecasts By Application (2021-2032) (USD Billion)
11.6.6 Latin America Electronic Wet Chemicals Market Estimates and Forecasts By End User Industry (2021-2032) (USD Billion)
11.6.7 Brazil
11.6.7.1 Brazil Electronic Wet Chemicals Market Estimates and Forecasts By Type (2021-2032) (USD Billion)
11.6.7.2 Brazil Electronic Wet Chemicals Market Estimates and Forecasts By Form (2021-2032) (USD Billion)
11.6.7.3 Brazil Electronic Wet Chemicals Market Estimates and Forecasts By Application (2021-2032) (USD Billion)
11.6.7.4 Brazil Electronic Wet Chemicals Market Estimates and Forecasts By End User Industry (2021-2032) (USD Billion)
11.6.8 Argentina
11.6.8.1 Argentina Electronic Wet Chemicals Market Estimates and Forecasts By Type (2021-2032) (USD Billion)
11.6.8.2 Argentina Electronic Wet Chemicals Market Estimates and Forecasts By Form (2021-2032) (USD Billion)
11.6.8.3 Argentina Electronic Wet Chemicals Market Estimates and Forecasts By Application (2021-2032) (USD Billion)
11.6.8.4 Argentina Electronic Wet Chemicals Market Estimates and Forecasts By End User Industry (2021-2032) (USD Billion)
11.6.9 Rest of Latin America
11.6.9.1 Rest of Latin America Electronic Wet Chemicals Market Estimates and Forecasts By Type (2021-2032) (USD Billion)
11.6.9.2 Rest of Latin America Electronic Wet Chemicals Market Estimates and Forecasts By Form (2021-2032) (USD Billion)
11.6.9.3 Rest of Latin America Electronic Wet Chemicals Market Estimates and Forecasts By Application (2021-2032) (USD Billion)
11.6.9.4 Rest of Latin America Electronic Wet Chemicals Market Estimates and Forecasts By End User Industry (2021-2032) (USD Billion)
12. Company Profiles
12.1 Oracle Corporation
12.1.1 Company Overview
12.1.2 Financial
12.1.3 Products/ Services Offered
12.1.4 SWOT Analysis
12.2 SAP SE
12.2.1 Company Overview
12.2.2 Financial
12.2.3 Products/ Services Offered
12.2.4 SWOT Analysis
12.3 Microsoft Corporation
12.3.1 Company Overview
12.3.2 Financial
12.3.3 Products/ Services Offered
12.3.4 SWOT Analysis
12.4 IBM Corporation
12.4.1 Company Overview
12.4.2 Financial
12.4.3 Products/ Services Offered
12.4.4 SWOT Analysis
12.5 Manhattan Associates
12.5.1 Company Overview
12.5.2 Financial
12.5.3 Products/ Services Offered
12.5.4 SWOT Analysis
12.6 Epicor
12.6.1 Company Overview
12.6.2 Financial
12.6.3 Products/ Services Offered
12.6.4 SWOT Analysis
12.7 Zoho Corporation
12.7.1 Company Overview
12.7.2 Financial
12.7.3 Products/ Services Offered
12.7.4 SWOT Analysis
12.8 Fishbowl
12.8.1 Company Overview
12.8.2 Financial
12.8.3 Products/ Services Offered
12.8.4 SWOT Analysis
12.9 NetSuite
12.9.1 Company Overview
12.9.2 Financial
12.9.3 Products/ Services Offered
12.9.4 SWOT Analysis
12.10 DataLogic
12.10.1 Company Overview
12.10.2 Financial
12.10.3 Products/ Services Offered
12.10.4 SWOT Analysis
13. Use Cases and Best Practices
14. Conclusion
An accurate research report requires proper strategizing as well as implementation. There are multiple factors involved in the completion of good and accurate research report and selecting the best methodology to compete the research is the toughest part. Since the research reports we provide play a crucial role in any company’s decision-making process, therefore we at SNS Insider always believe that we should choose the best method which gives us results closer to reality. This allows us to reach at a stage wherein we can provide our clients best and accurate investment to output ratio.
Each report that we prepare takes a timeframe of 350-400 business hours for production. Starting from the selection of titles through a couple of in-depth brain storming session to the final QC process before uploading our titles on our website we dedicate around 350 working hours. The titles are selected based on their current market cap and the foreseen CAGR and growth.
The 5 steps process:
Step 1: Secondary Research:
Secondary Research or Desk Research is as the name suggests is a research process wherein, we collect data through the readily available information. In this process we use various paid and unpaid databases which our team has access to and gather data through the same. This includes examining of listed companies’ annual reports, Journals, SEC filling etc. Apart from this our team has access to various associations across the globe across different industries. Lastly, we have exchange relationships with various university as well as individual libraries.
Step 2: Primary Research
When we talk about primary research, it is a type of study in which the researchers collect relevant data samples directly, rather than relying on previously collected data. This type of research is focused on gaining content specific facts that can be sued to solve specific problems. Since the collected data is fresh and first hand therefore it makes the study more accurate and genuine.
We at SNS Insider have divided Primary Research into 2 parts.
Part 1 wherein we interview the KOLs of major players as well as the upcoming ones across various geographic regions. This allows us to have their view over the market scenario and acts as an important tool to come closer to the accurate market numbers. As many as 45 paid and unpaid primary interviews are taken from both the demand and supply side of the industry to make sure we land at an accurate judgement and analysis of the market.
This step involves the triangulation of data wherein our team analyses the interview transcripts, online survey responses and observation of on filed participants. The below mentioned chart should give a better understanding of the part 1 of the primary interview.
Part 2: In this part of primary research the data collected via secondary research and the part 1 of the primary research is validated with the interviews from individual consultants and subject matter experts.
Consultants are those set of people who have at least 12 years of experience and expertise within the industry whereas Subject Matter Experts are those with at least 15 years of experience behind their back within the same space. The data with the help of two main processes i.e., FGDs (Focused Group Discussions) and IDs (Individual Discussions). This gives us a 3rd party nonbiased primary view of the market scenario making it a more dependable one while collation of the data pointers.
Step 3: Data Bank Validation
Once all the information is collected via primary and secondary sources, we run that information for data validation. At our intelligence centre our research heads track a lot of information related to the market which includes the quarterly reports, the daily stock prices, and other relevant information. Our data bank server gets updated every fortnight and that is how the information which we collected using our primary and secondary information is revalidated in real time.
Step 4: QA/QC Process
After all the data collection and validation our team does a final level of quality check and quality assurance to get rid of any unwanted or undesired mistakes. This might include but not limited to getting rid of the any typos, duplication of numbers or missing of any important information. The people involved in this process include technical content writers, research heads and graphics people. Once this process is completed the title gets uploader on our platform for our clients to read it.
Step 5: Final QC/QA Process:
This is the last process and comes when the client has ordered the study. In this process a final QA/QC is done before the study is emailed to the client. Since we believe in giving our clients a good experience of our research studies, therefore, to make sure that we do not lack at our end in any way humanly possible we do a final round of quality check and then dispatch the study to the client.
By Type
Acetic acid
Phosphoric acid
Isopropyl acid
By Form
Liquid
Solid
Gas
By Application
Semiconductor Manufacturing
Flat Panel Display (FPD) Manufacturing
Solar Cell Manufacturing
Printed Circuit Board (PCB) Manufacturing
By End User Industry
Electronics & Semiconductor Industry
Solar & Photovoltaic Industry
Automotive Industry
Consumer Electronics
Request for Segment Customization as per your Business Requirement: Segment Customization Request
Regional Coverage:
North America
US
Canada
Mexico
Europe
Germany
France
UK
Italy
Spain
Poland
Turkey
Rest of Europe
Asia Pacific
China
India
Japan
South Korea
Singapore
Australia
Taiwan
Rest of Asia Pacific
Middle East & Africa
UAE
Saudi Arabia
Qatar
South Africa
Rest of Middle East & Africa
Latin America
Brazil
Argentina
Rest of Latin America
Request for Country Level Research Report: Country Level Customization Request
Available Customization
With the given market data, SNS Insider offers customization as per the company’s specific needs. The following customization options are available for the report:
Detailed Volume Analysis
Criss-Cross segment analysis (e.g. Product X Application)
Competitive Product Benchmarking
Geographic Analysis
Additional countries in any of the regions
Customized Data Representation
Detailed analysis and profiling of additional market players